Team:TU-Eindhoven/IntegralModel
From 2013.igem.org


Contents |
Integral Model
The last step in creating a comprehensive model of the contrast mechanism is merging all individual models. Previously the model to predict the FNR concentration in a cell was described. This model will be combined with the decoy sites model, which was extended to contain the specific promoter that was used in this research. Here, the properties of the merged model will be discussed.
Merging the Models
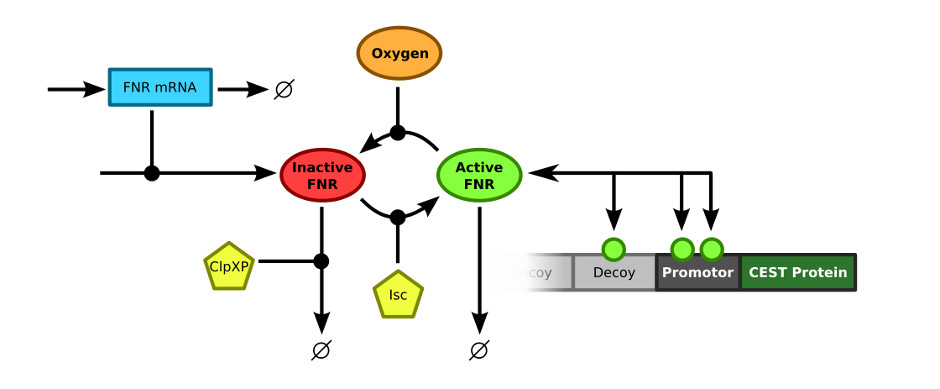
In order to merge the FNR model and the decoy sites model, the exact connection between the two models had to be defined. The FNR model describes the (active) FNR concentration in the bacterial cells. This active FNR species fulfills the role of transcription factor in the decoy sites model. Using this information, the models could simply be combined by merging the Active FNR species of the FNR model and the T (transcription factor) of the decoy sites model. The resulting model schematics are depicted in .
Results
This model was implemented as both a ODE and a stochastic model, various parameters were estimated as described on the FNR promoter page. One of the most interesting predictions that can be derived from the integral model is the influence of adding decoy sites to the DNA on the response to oxygen. and endeavor to visualize this prediction as clearly as possible.
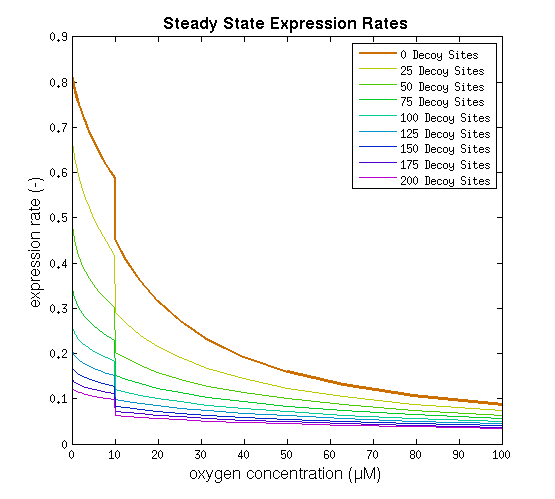
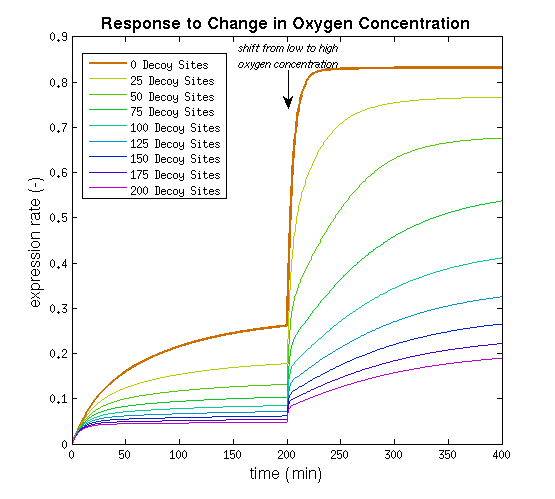
From it can be concluded that the sharpest response is realized using no decoy sites. Looking at it can be seen that adding decoy sites decreases the steady state expression rate, which is undesired. For a sharper response a weaker promoter would be needed in combination with stronger decoy sites, of which results are shown in .
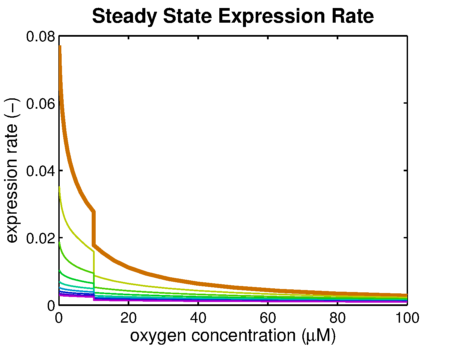
It can be seen that the response is sharper and more switch like, but the problem is that the expression rate decreases significantly. So using the weaker promoter would not allow for generating satisfactory MRI contrast, which is the main purpose of the project. Combining these observations, adding decoy sites to the construct appears to only have negative effects and the idea should be dismissed, based on the modeling results. Another conclusion that can be drawn from the models is that the expression rate needs around one hour to reach its peak, so any observable changes in protein concentration will be delayed by a little more than one hour.
Sensitivity Analysis
A sensitivity analysis is carried out over the integral model. It aims to see the effect of uncertainties in different parameters on the result curve. Therefore we know which parameters are crucial control points. In the sensitivity analysis, the parameters are added with a random error and put into the model. The method of Latin hypercube sampling is used to generate the error so that the error distribution is uniform over the region.
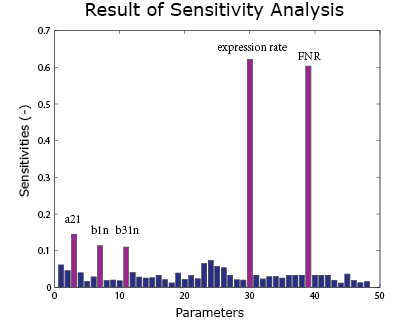
As the result() shows, the expression rate is most sensitive to the FNR concentration and the expression rate. It is also sensitive to $\alpha_{21}$, $\beta_1$ and $\beta_{31}$ under anaerobic condition. These parameters can be found in the FNR model .
EGFP Estimation
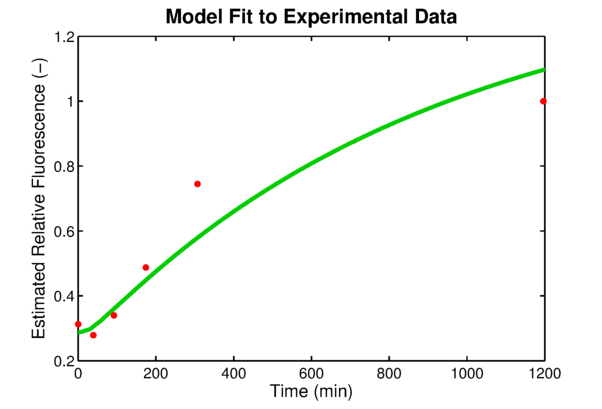
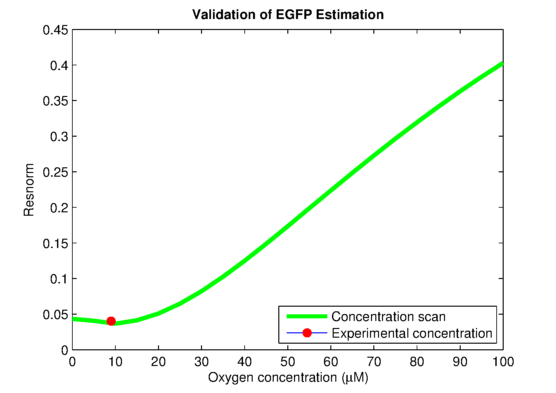
In order to link to the result from wetlab, the integral model needs to be adapted for EGFP. The two parameters, the absolute expression rate and the degradation rate of EGFP, are needed for the model. The degradation of EGFP is an exponential function and the half-life time of EGFP is about 26 hoursEGFPdegraPete Corish and Chris Tyler-Smith, Attenuation of green fluorescent protein half-life in mammalian cells. Protein Engineering 12, 1035-1040 (1999). The expression rate of EGFP is linear to the promoter occupancy which is known from the model. The ratio between the absolute expression rate and the relative expression rate will be estimated from the lab data. The result of this estimation is shown in . Furthermore, calculations showed in that the experimentally used oxygen concentration was indeed the concentration that gave the best model predictionsPLAnaA.Raue et al., Structural and practical identifiability analysis of of partially observed dynamical models by exploiting the profile likelihood.. Bioinformatics 25, 1923-1929 (2009).
The source code of all models can be found here.
 "
"


