"
"
Team:TU-Eindhoven/ODEModel
From 2013.igem.org


Contents |
FNR Dynamics
The FNR promoter is a key component in our project, since it facilitates the response to a change in oxygen concentration. Therefore a thorough model of the behavior of FNR is required to accurately predict the amount of MRI contrast agent in either aerobic or anaerobic environments.
FNR
The regulator of fumarate and nitrate reduction (FNR) is a transcription activator that controls the expression of genes in E.coli in response to oxygen starvation. BusbyFNRAnne M.L. Barnard, Jeffrey Green, and Stephen J.W. Busby, Transcription regulation by tandem-bound FNR at Escherichia coli promoters. Journal of bacteriology 185.20, 5993-6004 (2003) FNR is a protein that needs to acquire a Fe-S group to become functional. When the FNR protein is bound to a [4Fe-4S]2+ cluster it becomes apt to dimerization. The dimeric [4Fe-4S]2+-FNR is the active form that can bind to a FNR promoter. Oxygen however destabilizes the [4Fe-4S]2+ clusters of the dimers, resulting in monomers containing [2Fe-2S]2+ clusters. Since monomeric FNR can not activate transcription, this is the inactive form. In conclusion, the regulator FNR has three states: [4Fe-4S]2+-FNR, [2Fe-2S]2+ and apoprotein FNR.
The ODE Model
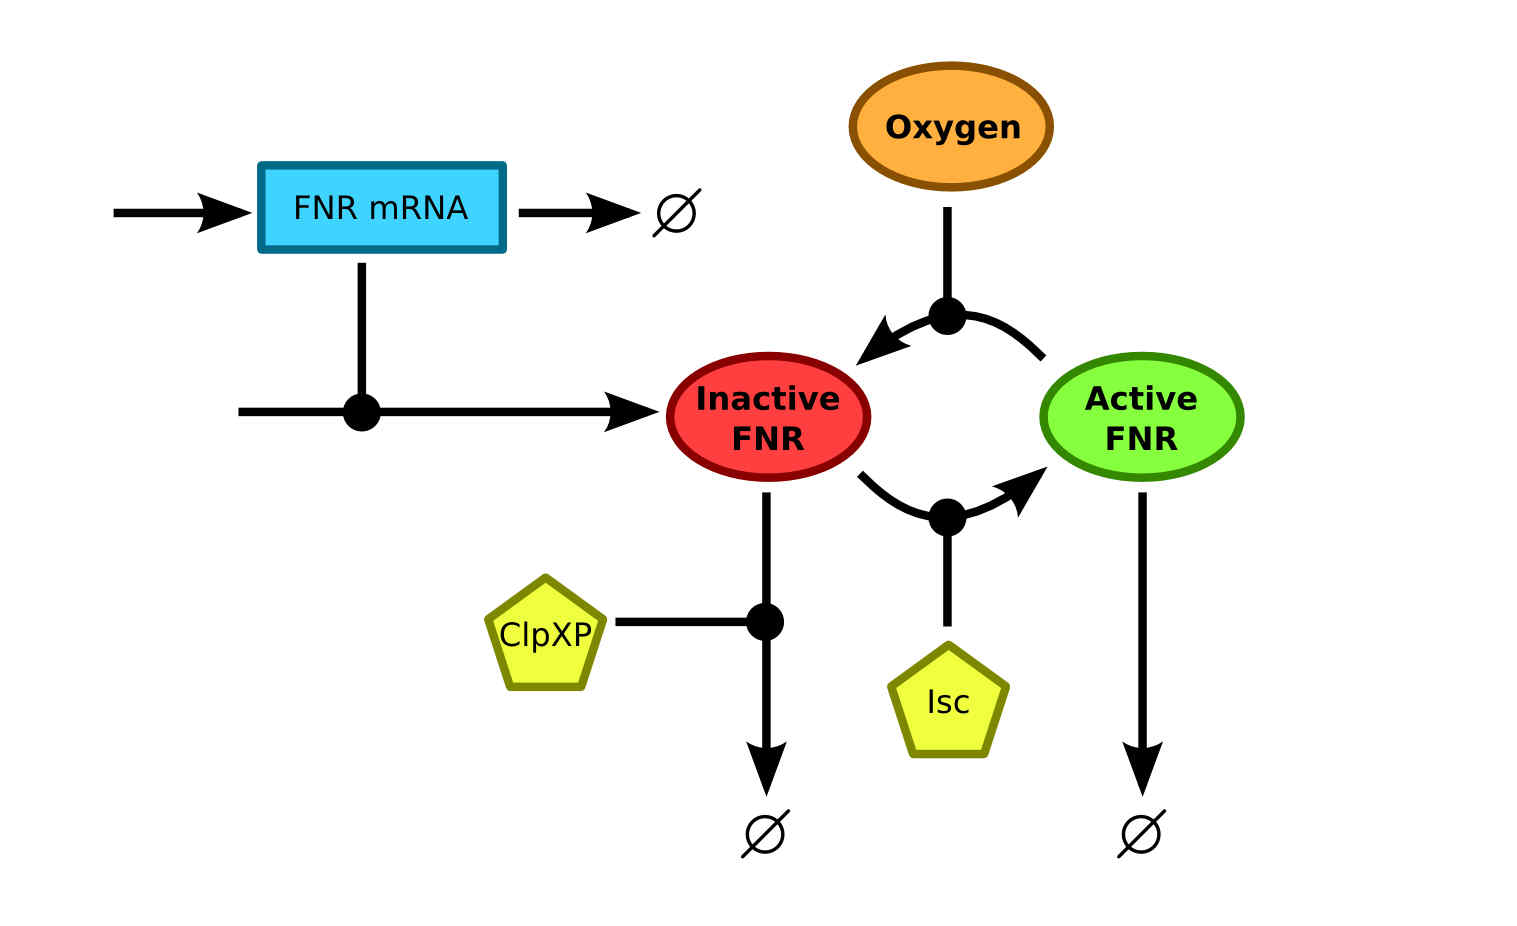
The expression rate of a contrast agent controlled by a FNR promoter is dependent on the amount of active FNR. Therefore a model that describes the conversion of FNR between the different states together with the production and degradation of FNR should be studied. Currently, the most integral model was described by Savageau et al.SavageauFNRDean A. Tolla and Michael A. Savageau, Regulation of Aerobic-to-Anaerobic Transitions by the FNR Cycle in Escherichia coli. Journal of molecular biology 397.4, 893-905 (2010) using data from a vast amount of previous researches into FNR. The schematics of the model are shown in . There it can be seen that the apoprotein FNR and [2Fe-2S]2+-FNR states are merged into one inactive FNR state. This simplification is useful since the only information that is of interest, is whether the FNR is active and can bind to the FNR promoter.
The degradation of inactive FNR is mainly caused by the ClpXP protease. The conversion from inactive to active FNR is facilitated by the Fe-S cluster assembly protein Isc. The disintegration of the active FNR to inactive FNR is, as mentioned before, facilitated by oxygen. This process is what makes the FNR regulation mechanism suitable for oxygen regulated protein expression.
The different parameters of this model were estimated using data of various researches, resulting in the values described in table 2 in the article of Savageau et al.SavageauFNR. Several parameters have separate values for anaerobic and aerobic conditions, since the facultative anaerobic E.coli changes its behavior based on the availability of oxygen.
This all comes together in the following equations, describing the FNR mRNA ($R_T$), inactive FNR ($T_{inactive}$) and active FNR ($T_{active}$):
Simulation Results
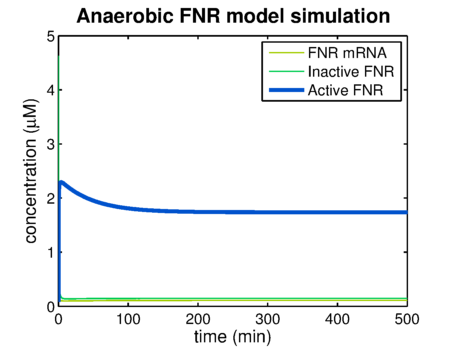
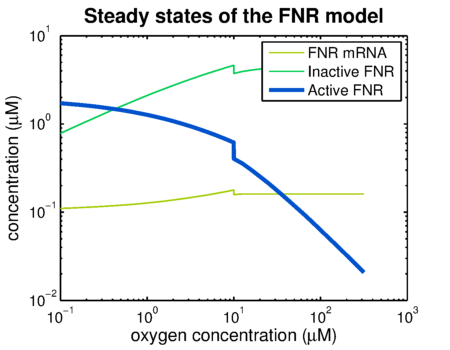
Using the FNR model predictions can be made of the levels of active and inactive FNR. shows the simulation of a system that has been put in an anaerobic environment, resulting in a graph showing the model reaching its steady state. Essential for the prediction of contrast agent expression levels at various oxygen concentrations is the correlation between the steady state FNR levels and the oxygen concentration. The predictions of these values are shown in . The leap at an oxygen concentration of 10 μM is caused by the switch between anaerobic and aerobic constants.
The Stochastic Model
Since the concentration of all the different species in bacterial cells is fairly low, it was decided to also generate a stochastic model of the FNR system. The schematics of course are the same as for the ODE model, but now we need to consider the different reactions and the chances of these reactions taking place. For the previously described FNR model, the reactions are:

References
The source code of all models can be found here.