Team:Duke/Project/Results/Part2
From 2013.igem.org
(Difference between revisions)
Hyunsoo kim (Talk | contribs) (→ACT1 reporters) |
Hyunsoo kim (Talk | contribs) (→Results: Part Characterization using Flow Cytometry) |
||
| Line 12: | Line 12: | ||
| - | [[File:TaleInduction.png| | + | [[File:TaleInduction.png|450px|center]] <br> |
<div align="center"> Figure 1.5.1. Change in Fluorescence with β-estradiol Induction</div> | <div align="center"> Figure 1.5.1. Change in Fluorescence with β-estradiol Induction</div> | ||
<br> | <br> | ||
| Line 19: | Line 19: | ||
| - | [[File:TaleInduction2.png| | + | [[File:TaleInduction2.png|730px|center]] <br> |
<div align="center"> Figure 1.5.2. Induction Curves for TALEs with Varying β-estradiol Concentrations</div> | <div align="center"> Figure 1.5.2. Induction Curves for TALEs with Varying β-estradiol Concentrations</div> | ||
<br> | <br> | ||
| Line 30: | Line 30: | ||
| - | [[File:ActReporter.png| | + | [[File:ActReporter.png|450px|center]] <br> |
<div align="center"> Figure 1.5.3. Reduced ACT1 Promoter Activity with Binding Sites in 5' UTR </div> | <div align="center"> Figure 1.5.3. Reduced ACT1 Promoter Activity with Binding Sites in 5' UTR </div> | ||
<br> | <br> | ||
Revision as of 18:23, 27 September 2013
Contents |
Results: Part Characterization using Flow Cytometry
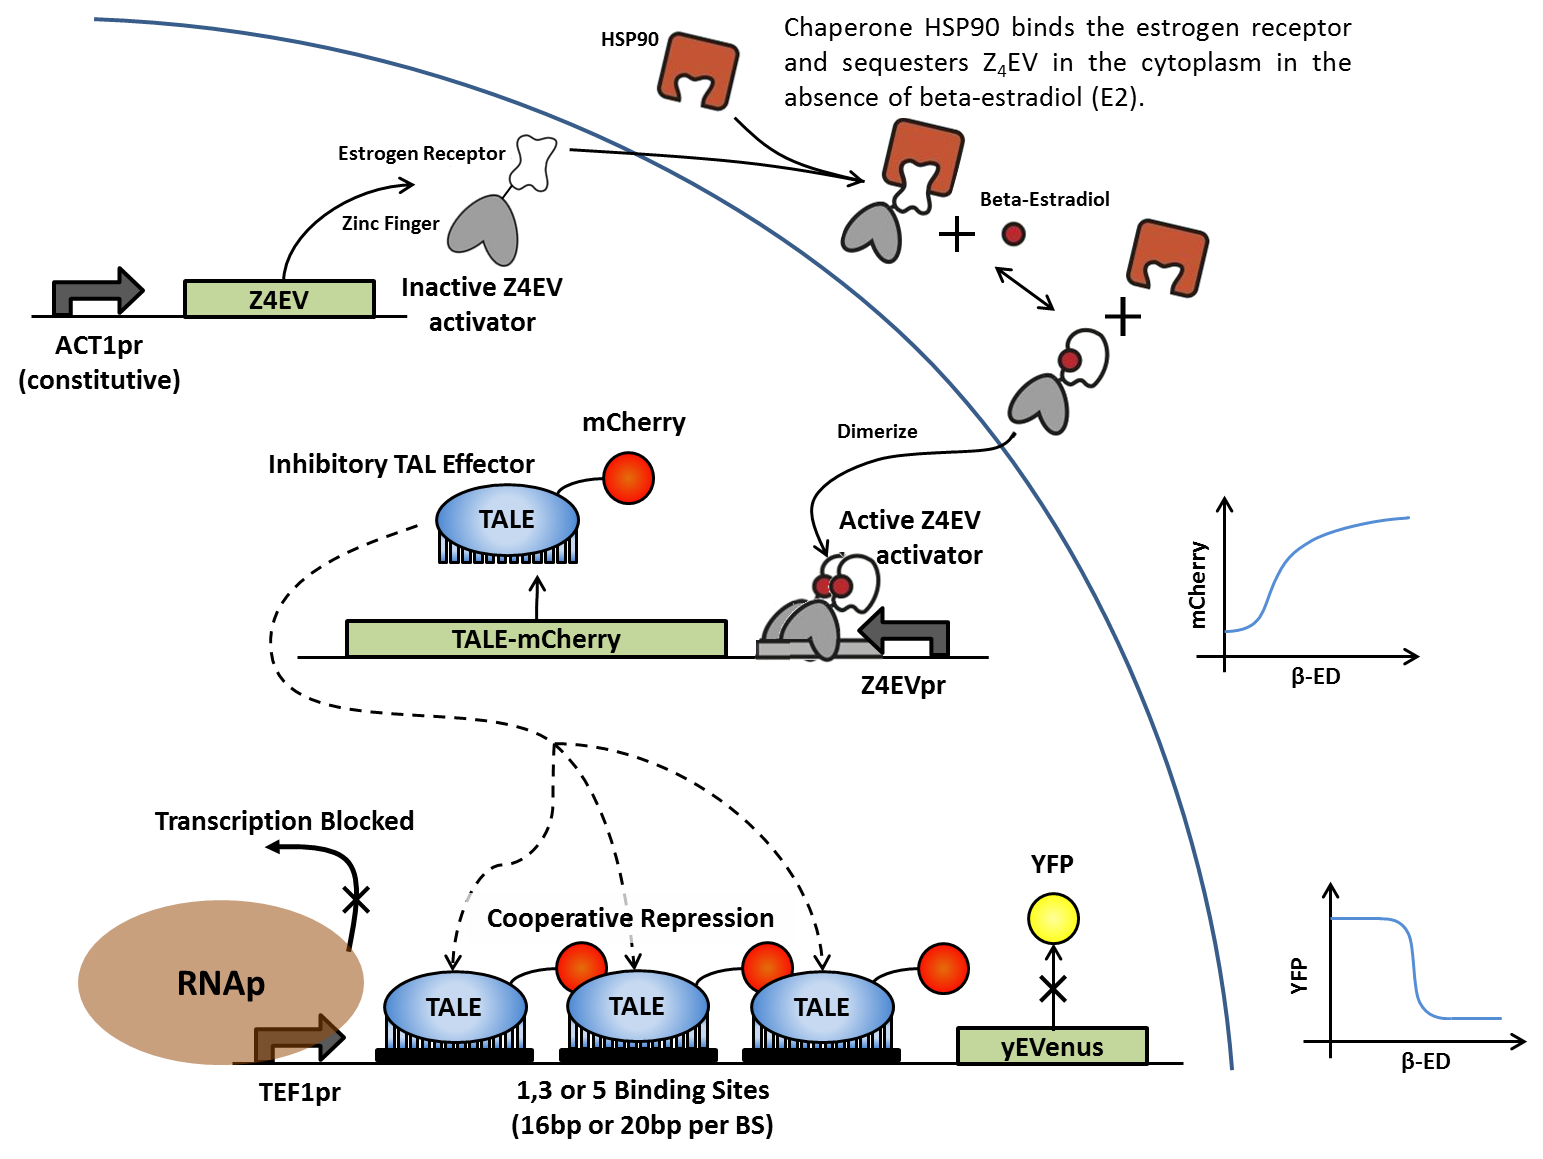
After being integrated into the yeast genome, parts were characterized individually by flow cytometry.
TALEs
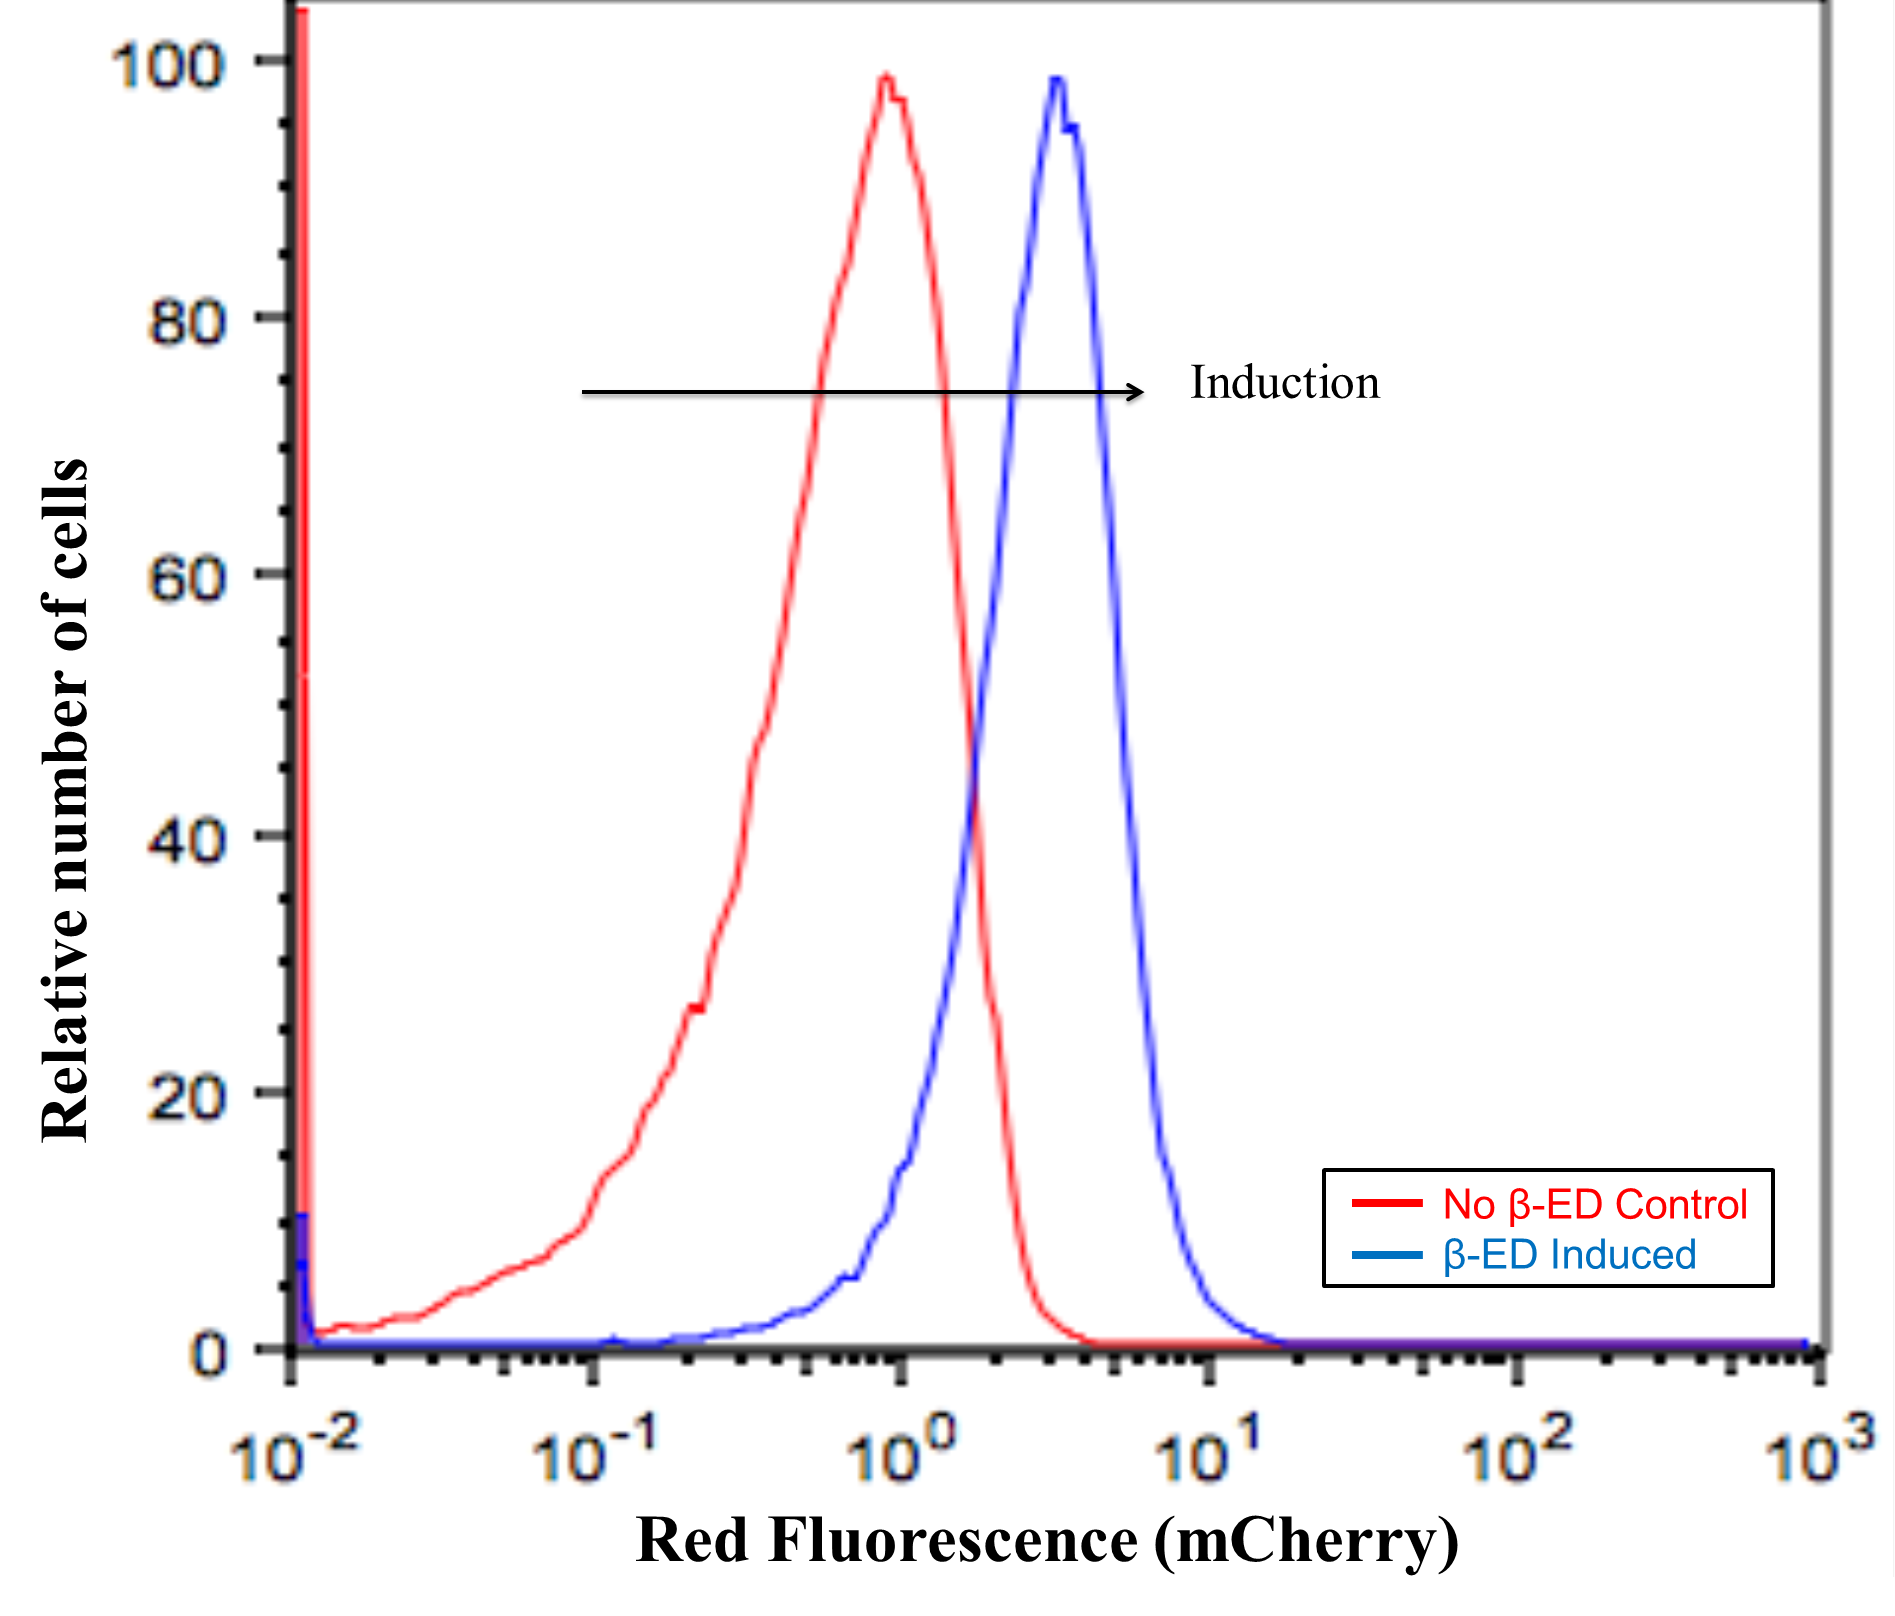
- Initial characterization: TALE-mCherry constructs are present and expression is inducible by β-estradiol. Cells were grown with and without β-estradiol and fluorescence was compared to background levels using a control strain. Our flow cytometry data shows ~4 fold increase in fluorescence with β-estradiol, indicating TALE transcription with operating mCherry tag.
Figure 1.5.1. Change in Fluorescence with β-estradiol Induction
- Relationship between beta-estradiol concentration and TALE-mCherry expression: Cells were grown in varied β-estradiol concentrations and fluorescence was compared to background levels using a control strain. The induction curves are shown for four strains of yeast that produced different TALEs (16B, 16C, 20B, and 20C) with β-ED concentrations of 0.1nM through 1000nM
Figure 1.5.2. Induction Curves for TALEs with Varying β-estradiol Concentrations
ACT1 reporters
- Initial characterization: ACT1-yEVenus constructs with no operators showed distinct constitutive gene expression (green). However, presence of operator sites in the 5' UTR knocked down constitutive expression almost to background levels. In lieu of these results, we decided to construct TEF1-promoter reporter constructs. TEF1 is a stronger constitutive promoter that we hoped would counteract the effects of the operator sequence on constitutive expression levels.
Figure 1.5.3. Reduced ACT1 Promoter Activity with Binding Sites in 5' UTR
TEF1 reporters
- Initial characterization: TEF1-yEVenus constructs with operator sites in the 5' UTR showed expression levels significantly higher than background levels, and comparatively higher than the ACT1-yEVenus constructs.
Figure 1.5.4. insert graph/data here
 "
"


