 "
"
Team:Duke/Modeling/2 1
From 2013.igem.org
(Difference between revisions)
Hyunsoo kim (Talk | contribs) (→Gene Expression Level vs. Number of Repressor Binding Sites) |
Hyunsoo kim (Talk | contribs) (→Gene Expression Level vs. Number of Repressor Binding Sites) |
||
| Line 29: | Line 29: | ||
[[File:Pbound_vs_kd.png|650px|center]] | [[File:Pbound_vs_kd.png|650px|center]] | ||
| - | <div align="center"> Figure | + | <div align="center"> Figure 4. P_bound vs. Kd </div> <br><br> |
| + | |||
| + | |||
| + | |||
| + | [[File:Pbound_vs_kd_graph.png|650px|center]] | ||
| + | <div align="center"> Figure 5. Graph of P_bound vs. Kd </div> <br><br> | ||
<br><br><br> | <br><br><br> | ||
</div> | </div> | ||
Revision as of 00:30, 22 September 2013


Contents |
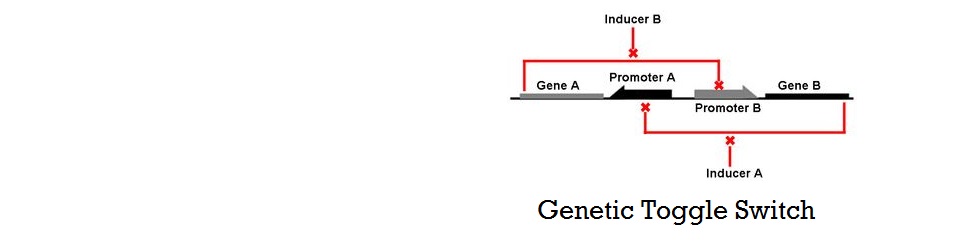
Mathematical Modeling of Bistable Toggle Switch
Application of the Thermodynamic Model of Cooperative Repression
To recap the derivation from the previous section, the key equation for thermodynamic model of cooperative repression is:

Figure 1. Recap of Thermodynamic Model
In this section, the above model will be explored; specifically, the relationship between the red-colored terms will be studied. First, the relationship between P_bound and the number of F_reg's will show the effect of changing number of binding sites on level of gene expression. Then, the relationship between P_bound and Ks_rd (Dissociation constant of repressor bound to DNA) will show the effect of changing binding strengths of repressors on level of gene expression.
Gene Expression Level vs. Number of Repressor Binding Sites

Figure 2. P_bound vs. Number of Freg's

Figure 3. Graph of P_bound vs. Number of Freg's
Gene Expression Level vs. Number of Repressor Binding Sites

Figure 4. P_bound vs. Kd

Figure 5. Graph of P_bound vs. Kd