 "
"
Team:Duke/Modeling/2 1
From 2013.igem.org
Hyunsoo kim (Talk | contribs) (→Gene Expression Level vs. Number of Repressor Binding Sites) |
Hyunsoo kim (Talk | contribs) (→Application of the Thermodynamic Model of Cooperative Repression) |
||
| Line 47: | Line 47: | ||
<br><br> | <br><br> | ||
| - | === Gene Expression Level vs. | + | === Gene Expression Level vs. Binding Strength of Repressors === |
[[File:Pbound_vs_kd.png|650px|center]] | [[File:Pbound_vs_kd.png|650px|center]] | ||
<div align="center"> Figure 5. P_bound vs. Kd </div> <br><br> | <div align="center"> Figure 5. P_bound vs. Kd </div> <br><br> | ||
| + | Similarly, the relationship between P_bound and the dissociation constants of repressors was studied in this section. | ||
| + | In addition to the variables and the values from previous section, a new set of variables were introduced to distinguish between weak and strong repressors. In the table shown below, the two "Kd,strong" is the dissociation constant for strong repressors, and "Kd,weak" is the dissociation constant for weak repressors. Because the strength of binding is represented as the "dissociation" constant, higher value translates to equilibrium shifting towards dissociated repressor ([DNA]+[Repressor]) instead of bound repressor ([DNA-Repressor]). | ||
| + | <br><br><br> | ||
| + | |||
| + | [[File:Thermo_variables2.png|650px|center]] | ||
| + | <div align="center"> Figure 3. P_bound vs. Number of Freg's </div> | ||
| + | Numbers from: | ||
| + | #Meckler et al., "Quantitative analysis of TALE-DNA interactions suggests polarity effects". Nucl. Acids Res. (2013) 41 (7): 4118-4128. | ||
| + | <br> | ||
| + | <br> | ||
| + | |||
| + | dfsdf | ||
[[File:Pbound_vs_kd_graph.png|750px|center]] | [[File:Pbound_vs_kd_graph.png|750px|center]] | ||
Revision as of 02:03, 22 September 2013


Contents |
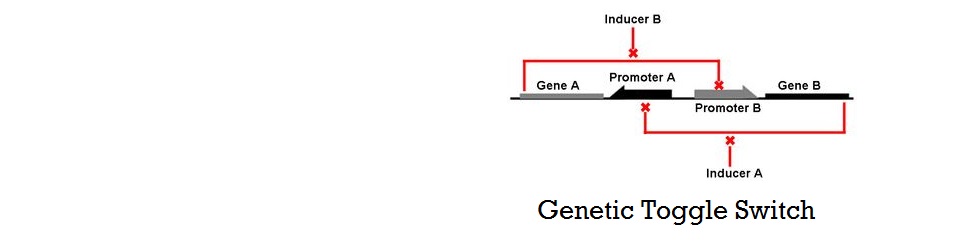
Mathematical Modeling of Bistable Toggle Switch
Application of the Thermodynamic Model of Cooperative Repression
To recap the derivation from the previous section, the key equation for thermodynamic model of cooperative repression is:

In this section, the above model will be explored; specifically, the relationship between the red-colored terms will be studied. First, the relationship between P_bound and the number of F_reg's will show the effect of changing number of binding sites on level of gene expression. Then, the relationship between P_bound and Ks_rd (Dissociation constant of repressor bound to DNA) will show the effect of changing binding strengths of repressors on level of gene expression.
Gene Expression Level vs. Number of Repressor Binding Sites

As highlighted in the equation shown above, the relationship between P_bound and the number of F_reg's was studied. First, reasonable values for the variables used were chosen after research. Websites were used to find the size of yeast genome (12e6 bps) and the number of RNAP molecults in a S.cerevisiae (2000~4000 RNAP/cell). Some journal papers were used as well, for example, to find the dissociation constants of a typical TALE (18 RVD's). The variables and their values are summarized below.

Numbers from:
- http://www.yeastgenome.org/cache/genomeSnapshot.html
- http://bionumbers.hms.harvard.edu/bionumber.aspx?&id=109211&ver=3&trm=polymerase
- Bintu et al., "Transcriptional regulation by the numbers". Current Opinion in Genetics and Development. 15, pp. 116-124 (2005)
- Meckler et al., "Quantitative analysis of TALE-DNA interactions suggests polarity effects". Nucl. Acids Res. (2013) 41 (7): 4118-4128.
First, the basal level of P_bound was calculated using F_reg = 1 (no Transcription Factors). Then, the P_bound values for the three cases--1 binding site, 3 binding sites, and 5 binding sites--were calculated for repressor level from 0.1 to 10,000 molecules/cell. Then finally, the P_bound values at these three cases were divided by the basal P_bound value to find the fold change in P_bound for the three cases. The result from these steps are graphed below.

The black, blue, and red data points indicate the fold change in P_bound when 1, 3 and 5 repressor binding sites are present. Qualitatively, it clearly looks like the slope of the hill function becomes steeper with additional binding sites. When a hill function was fitted onto these data points using "cftool" command on MATLAB, it was quantitatively shown that the apparent Hill coefficient increases from 1.00 to 2.99 then to 4.86 as the number of binding sites increased from 1 to 3, then to 5.
The significance of the result above is that a non-Hill equation that models the effect of multiple repressor sites on the probability of RNAP binding demonstrated increase in cooperativity with increasing number of binding sites.
Gene Expression Level vs. Binding Strength of Repressors

Similarly, the relationship between P_bound and the dissociation constants of repressors was studied in this section. In addition to the variables and the values from previous section, a new set of variables were introduced to distinguish between weak and strong repressors. In the table shown below, the two "Kd,strong" is the dissociation constant for strong repressors, and "Kd,weak" is the dissociation constant for weak repressors. Because the strength of binding is represented as the "dissociation" constant, higher value translates to equilibrium shifting towards dissociated repressor ([DNA]+[Repressor]) instead of bound repressor ([DNA-Repressor]).

Numbers from:
- Meckler et al., "Quantitative analysis of TALE-DNA interactions suggests polarity effects". Nucl. Acids Res. (2013) 41 (7): 4118-4128.
dfsdf
