Team:TU-Munich/Results/Recombinant
From 2013.igem.org
LouiseFunke (Talk | contribs) (→Half-life of the laccase in river water) |
LouiseFunke (Talk | contribs) (→Influence of the temperature) |
||
| Line 223: | Line 223: | ||
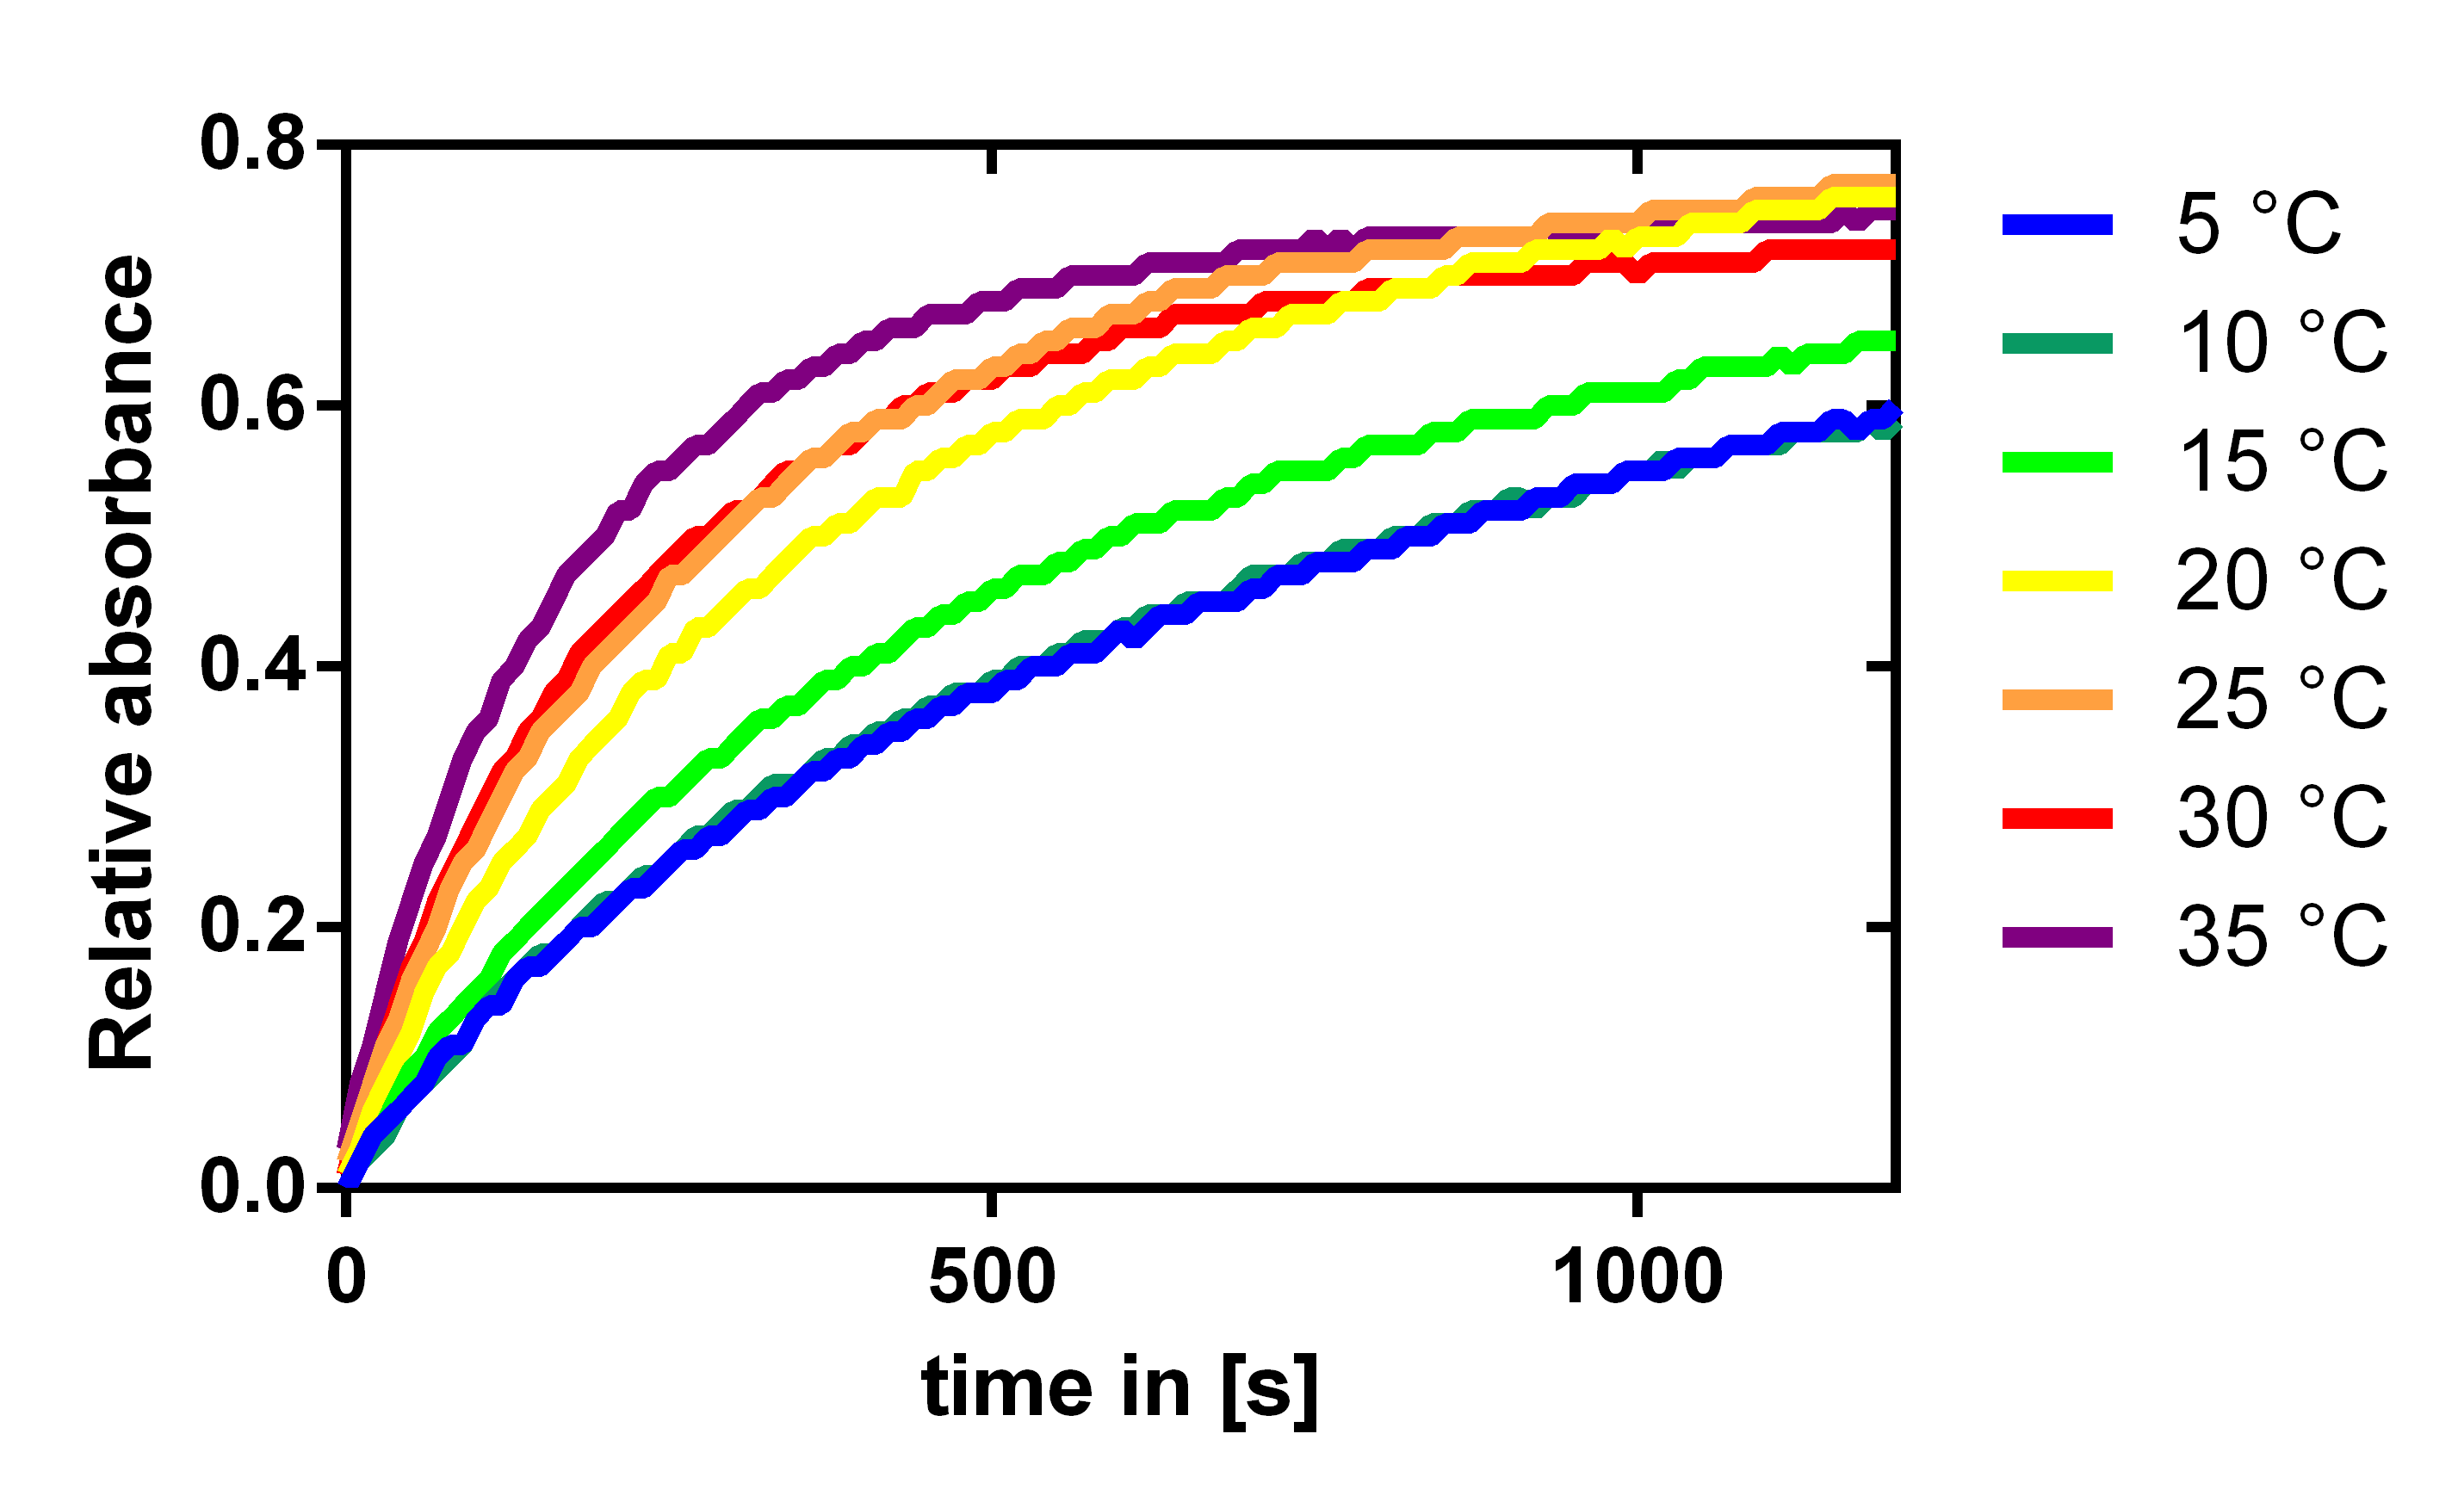
To analyze the temperature dependency of the laccase we determined the katalytic activity with a 1:100 enzyme dilution and 0.12 mM of the substrate ABTS. The enzymatic conversion could be followed by the absorbance of the resulting product at 405 nm. The enzyme and substrate were both incubated at the specific temperatures for half an hour before starting the reaction. | To analyze the temperature dependency of the laccase we determined the katalytic activity with a 1:100 enzyme dilution and 0.12 mM of the substrate ABTS. The enzymatic conversion could be followed by the absorbance of the resulting product at 405 nm. The enzyme and substrate were both incubated at the specific temperatures for half an hour before starting the reaction. | ||
As expected the enzymes efficiency is increasing with temperature, but it is also acceptable at lake and river temperatures which are about 10 to 15 °C. | As expected the enzymes efficiency is increasing with temperature, but it is also acceptable at lake and river temperatures which are about 10 to 15 °C. | ||
| - | + | <div class="visualClear"></div> | |
[[File:TUM13 Laccase_TempAuswertung.png|thumb|left|400px| '''Figure XX:''' Dependence of the activity of the laccase on the ambient temperature]] | [[File:TUM13 Laccase_TempAuswertung.png|thumb|left|400px| '''Figure XX:''' Dependence of the activity of the laccase on the ambient temperature]] | ||
Revision as of 21:52, 28 October 2013
Characterization of recombinant effector proteins
For the development of a transgenic water filter it is an essential task to create a collection of well described and functional effector proteins which are either able to bind (BioAccumulation) or to degrade (BioDegradation) xenobiotics which are present in the aquatic environment. This task was completed by the production of relevant effector proteins in E. coli and their subsequent purification and characterization. Deliberately we have chosen some well established BioBricks from the last years such as a laccase (<partinfo>BBa_K1159002</partinfo>) or the catechol dioxigenase (<partinfo>BBa_K648011</partinfo>) to improve these BioBricks. Beside these improvements we also added new BioBricks to the registry which we characterized in vitro such as the erythromycin esterase (EreB) (<partinfo>BBa_K1159000</partinfo>) or the NanoLuc luciferase (<partinfo>BBa_K1159001</partinfo>) which will be a useful tool for subsequent generations of iGEM students. For technical questions on our experiments, please see protein biochemical methods for further information. Beside these experiments with recombinant proteins we also characterized our stable transformed moss strains (see PhyscoFilter section).
| Protein | BioBrick | RFC | Size [kDa] | Disulfide bridges |
|---|---|---|---|---|
| Erythromycin esterase | [http://parts.igem.org/Part:BBa_K1159000 BBa_K1159000] | RFC[25] | 48.5 | none |
| Laccase | [http://parts.igem.org/Part:BBa_K1159002 BBa_K1159002] | RFC[25] | 58.8 | yes |
| Nano Luciferase | [http://parts.igem.org/Part:BBa_K1159001 BBa_K1159001] | RFC[25] | 19.4 | none |
| XylE | [http://parts.igem.org/Part:BBa_K648011 BBa_K648011] | RFC[10] | 4 x 35.4 | none |
| PP1 | [http://parts.igem.org/Part:BBa_K1159004 BBa_K1159004] | RFC[25] | 37.4 | none |
| DTT Dehydrochlorinase | [http://parts.igem.org/Part:BBa_K620000?title=Part:BBa_K620000 BBa_K620000] | RFC[10] | 23.4 | none |
| SpyCatcher | [http://parts.igem.org/Part:BBa_K1159200 BBa_K1159200] | RFC[25] | 12.6 | none |
| SpyTag | [http://parts.igem.org/wiki/index.php?title=Part:BBa_K1159201 BBa_K1159201] | RFC[25] | 1.9 | none |
| YFP_TEV_CFP | [http://parts.igem.org/Part:BBa_K1159112 BBa_K1159112] | RFC[25] | 55.2 | none |
Erythromycin Esterase (EreB)
The erythromycin esterase (EreB) is an enzyme found in some strains of Escherichia coli and which was introduced to the Parts Registry by the TU Munich iGEM Team 2013 in RFC[25]. As this BioBrick is derived from Escherichia coli it was to expect that it is well expressing in our experiments on recombinant effector proteins. For further information on the theoretical background of EreB please see our BioDegradation page.
Production and purification of recombinant EreB
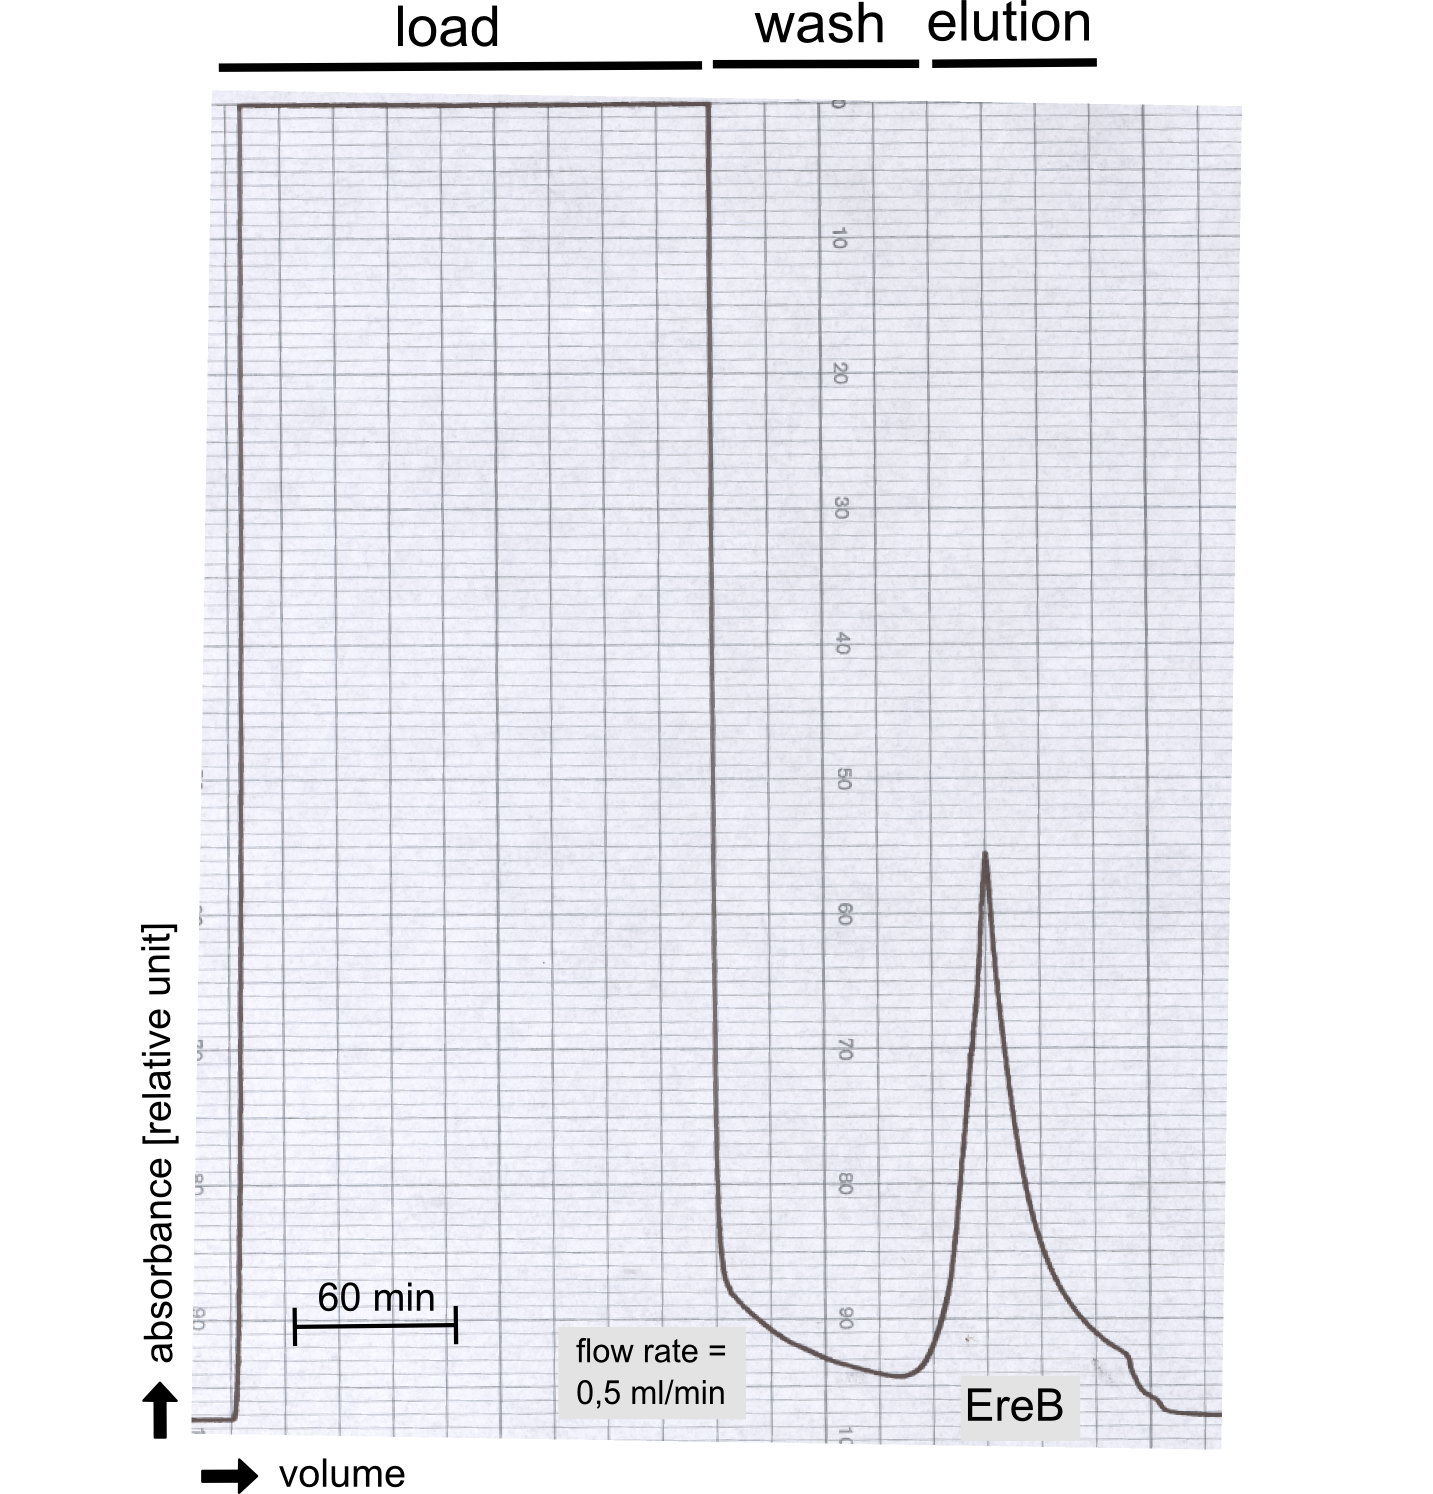
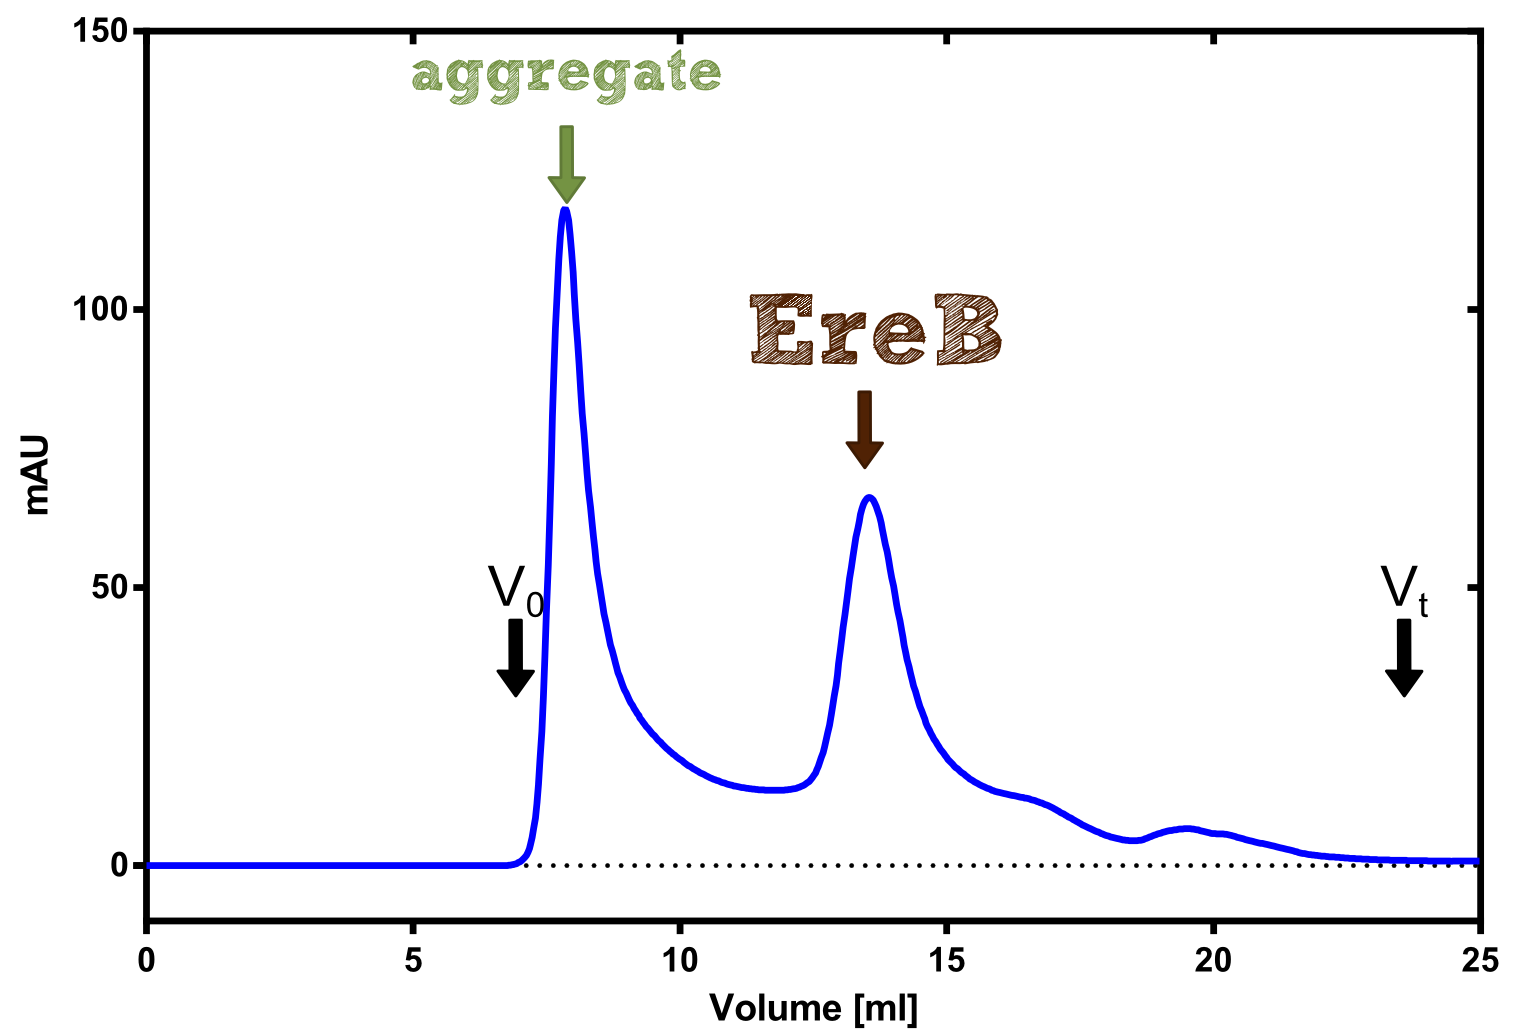
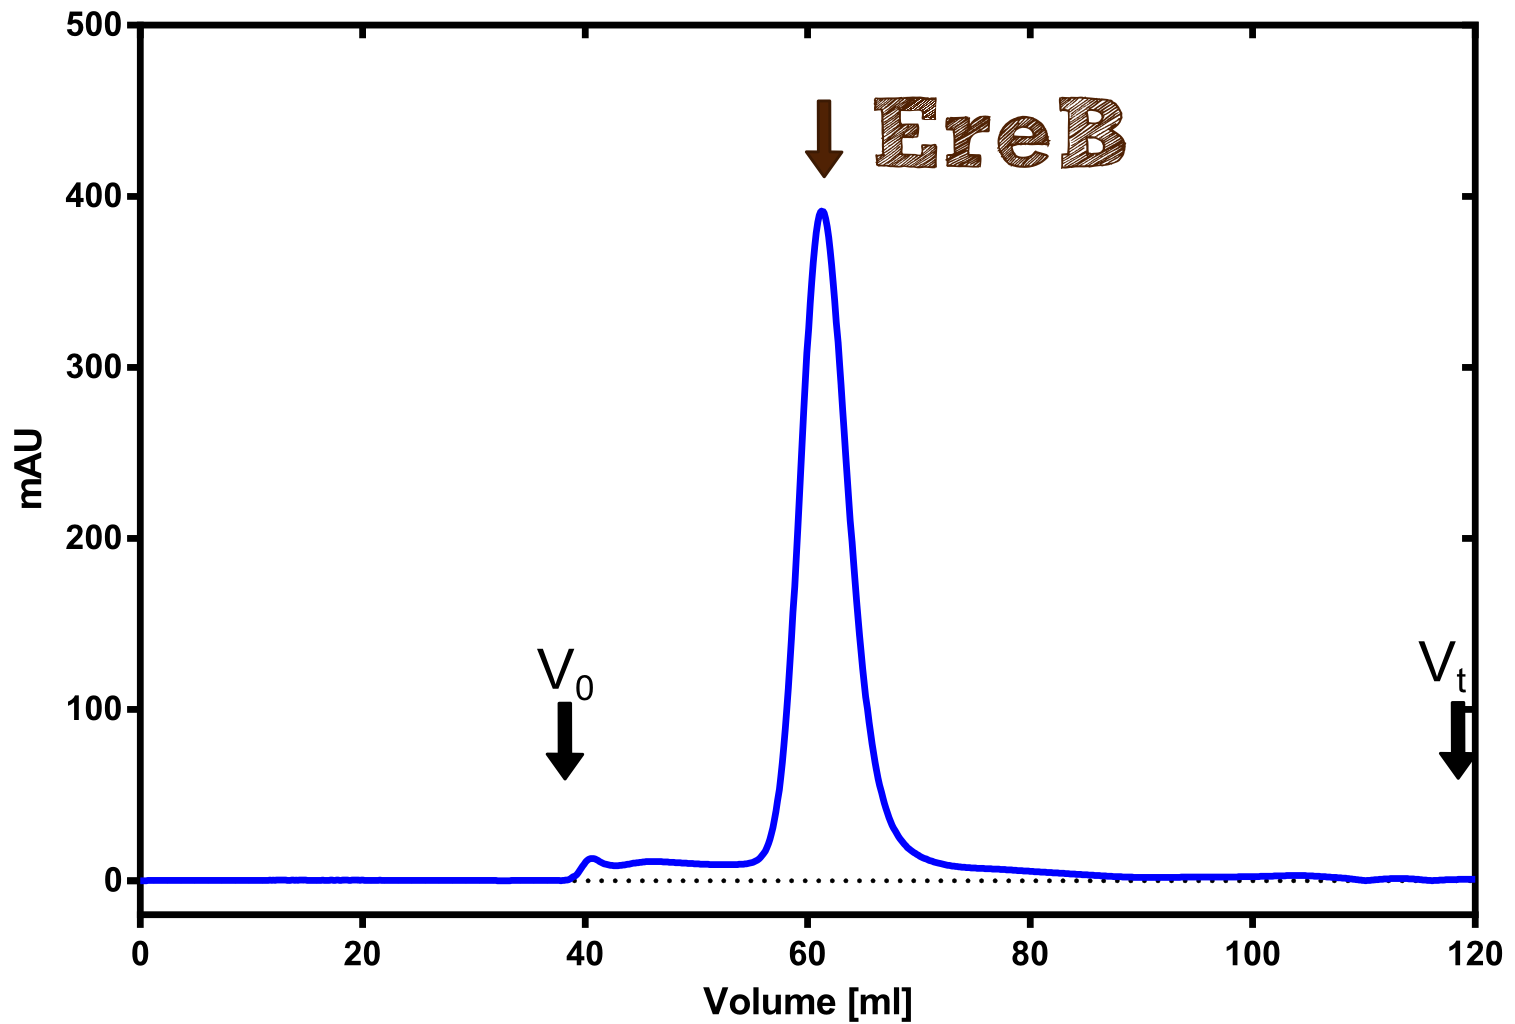
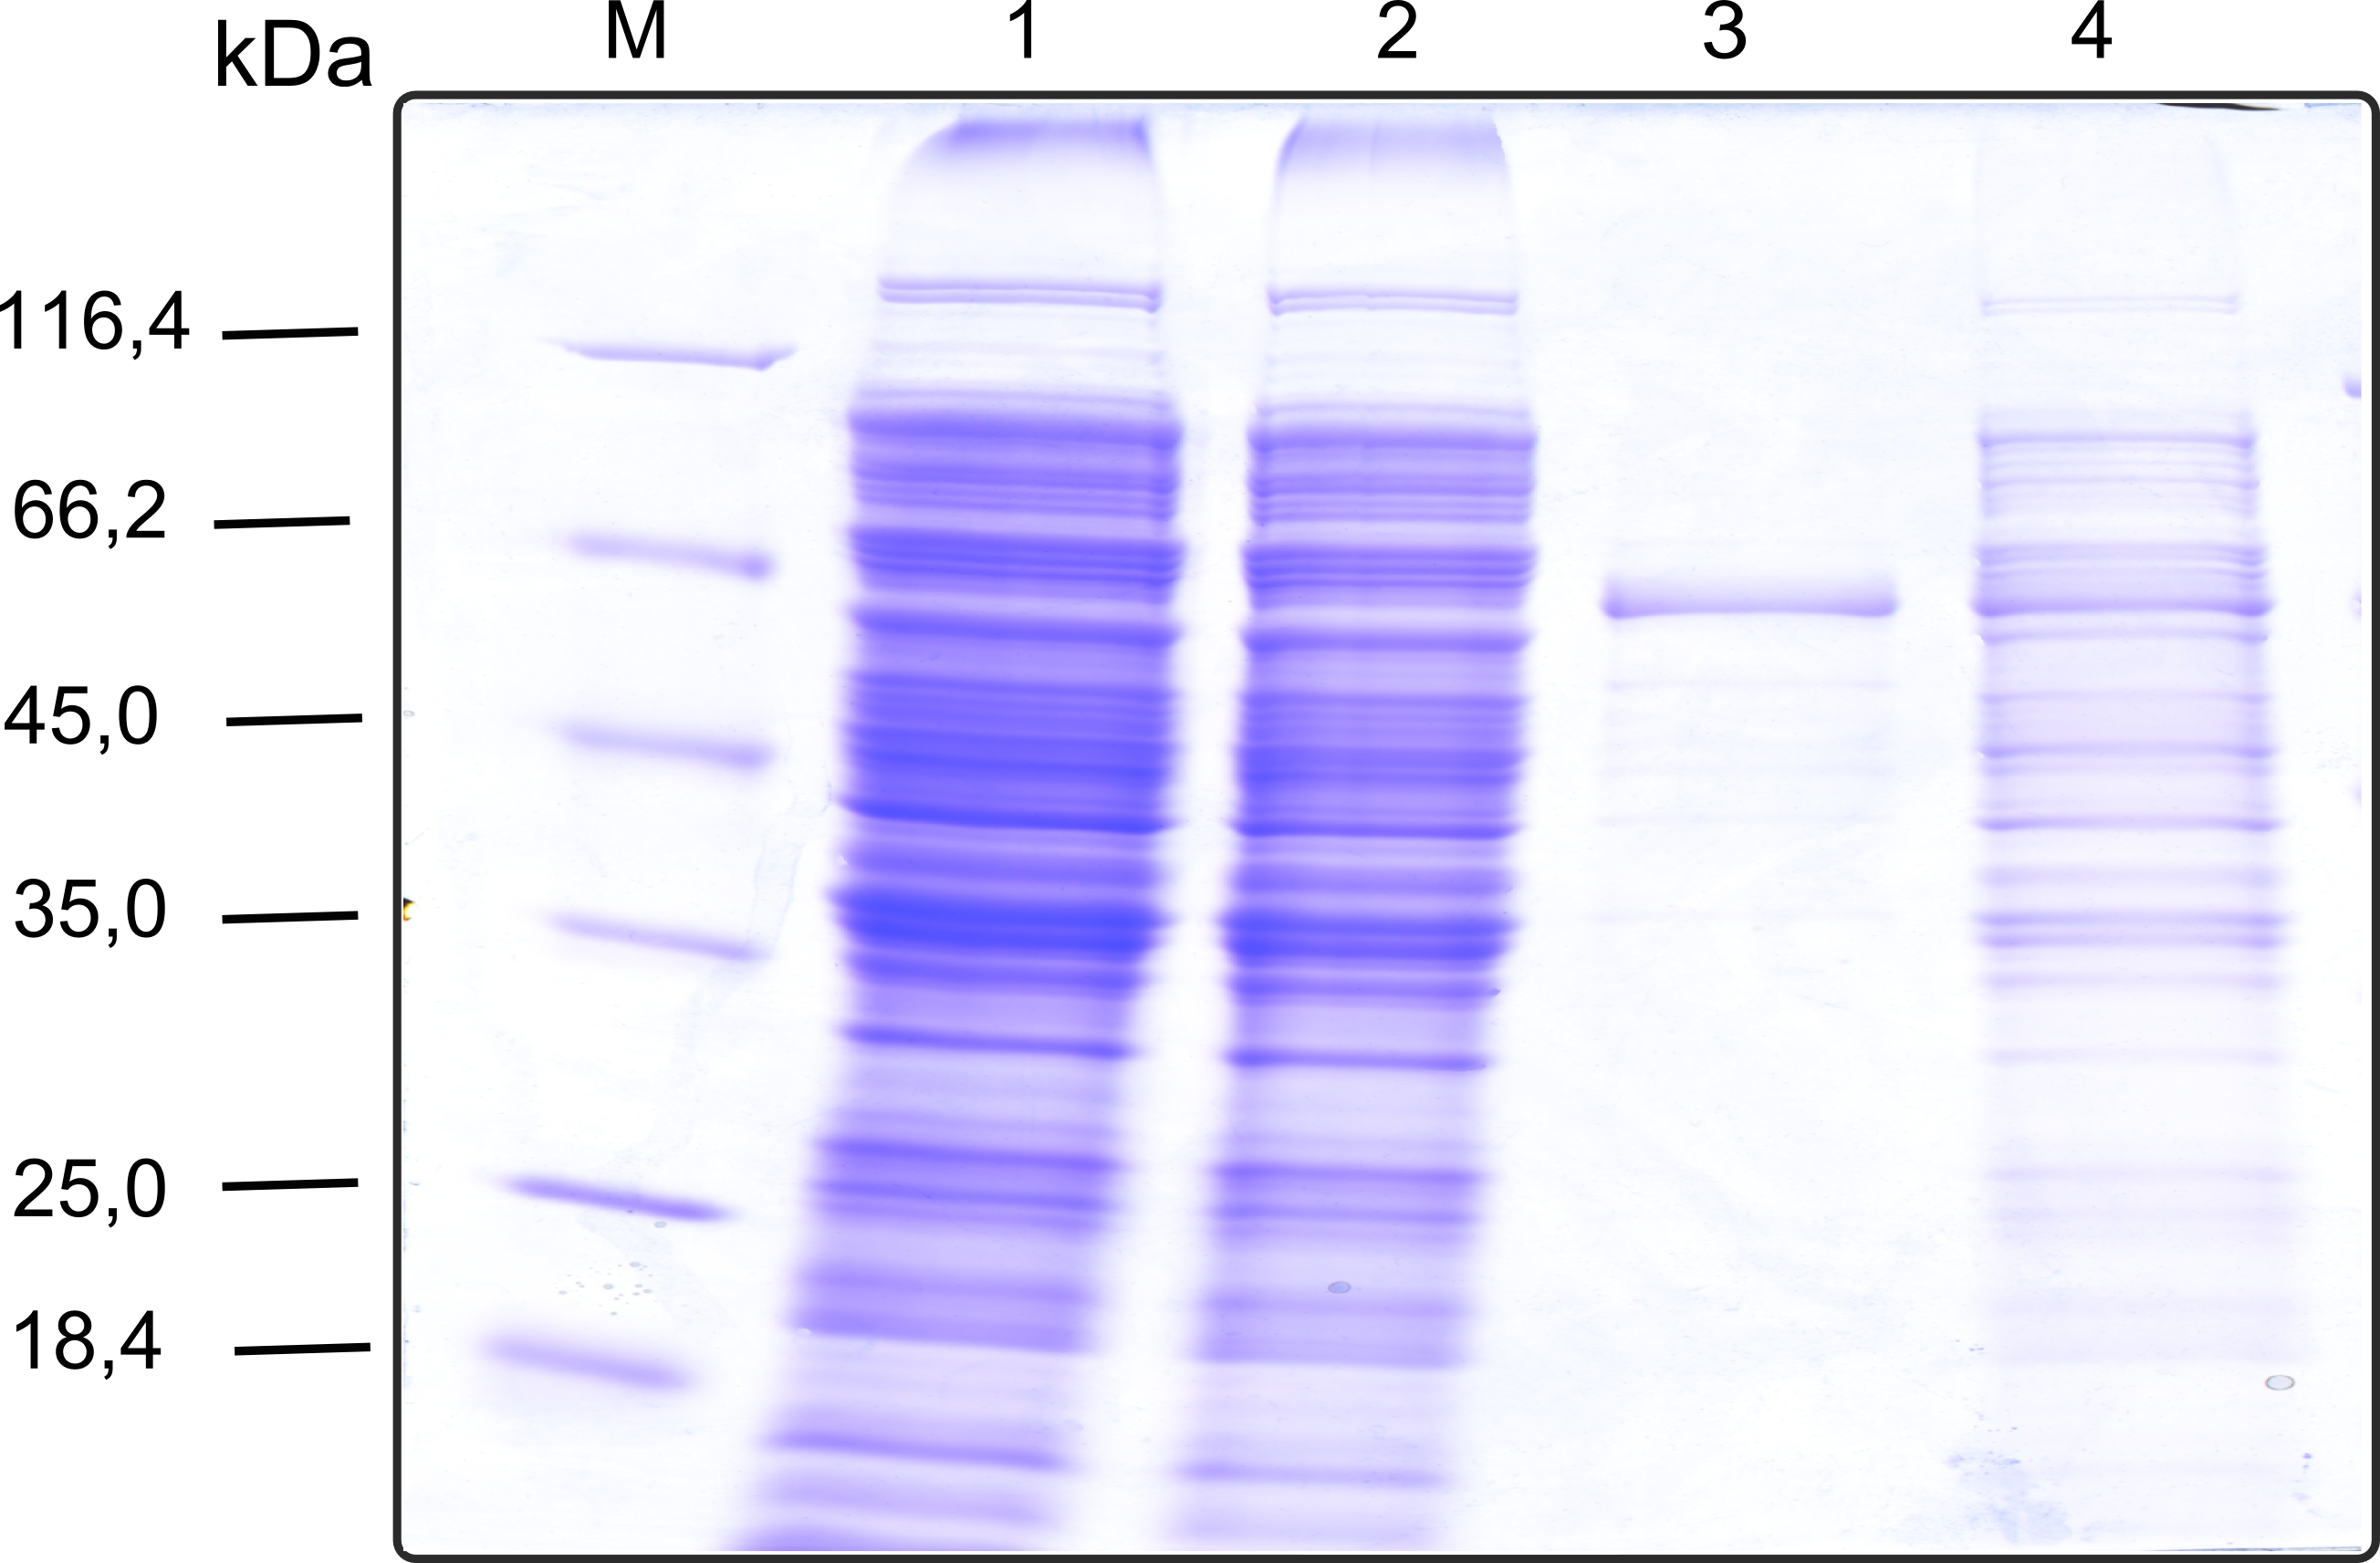
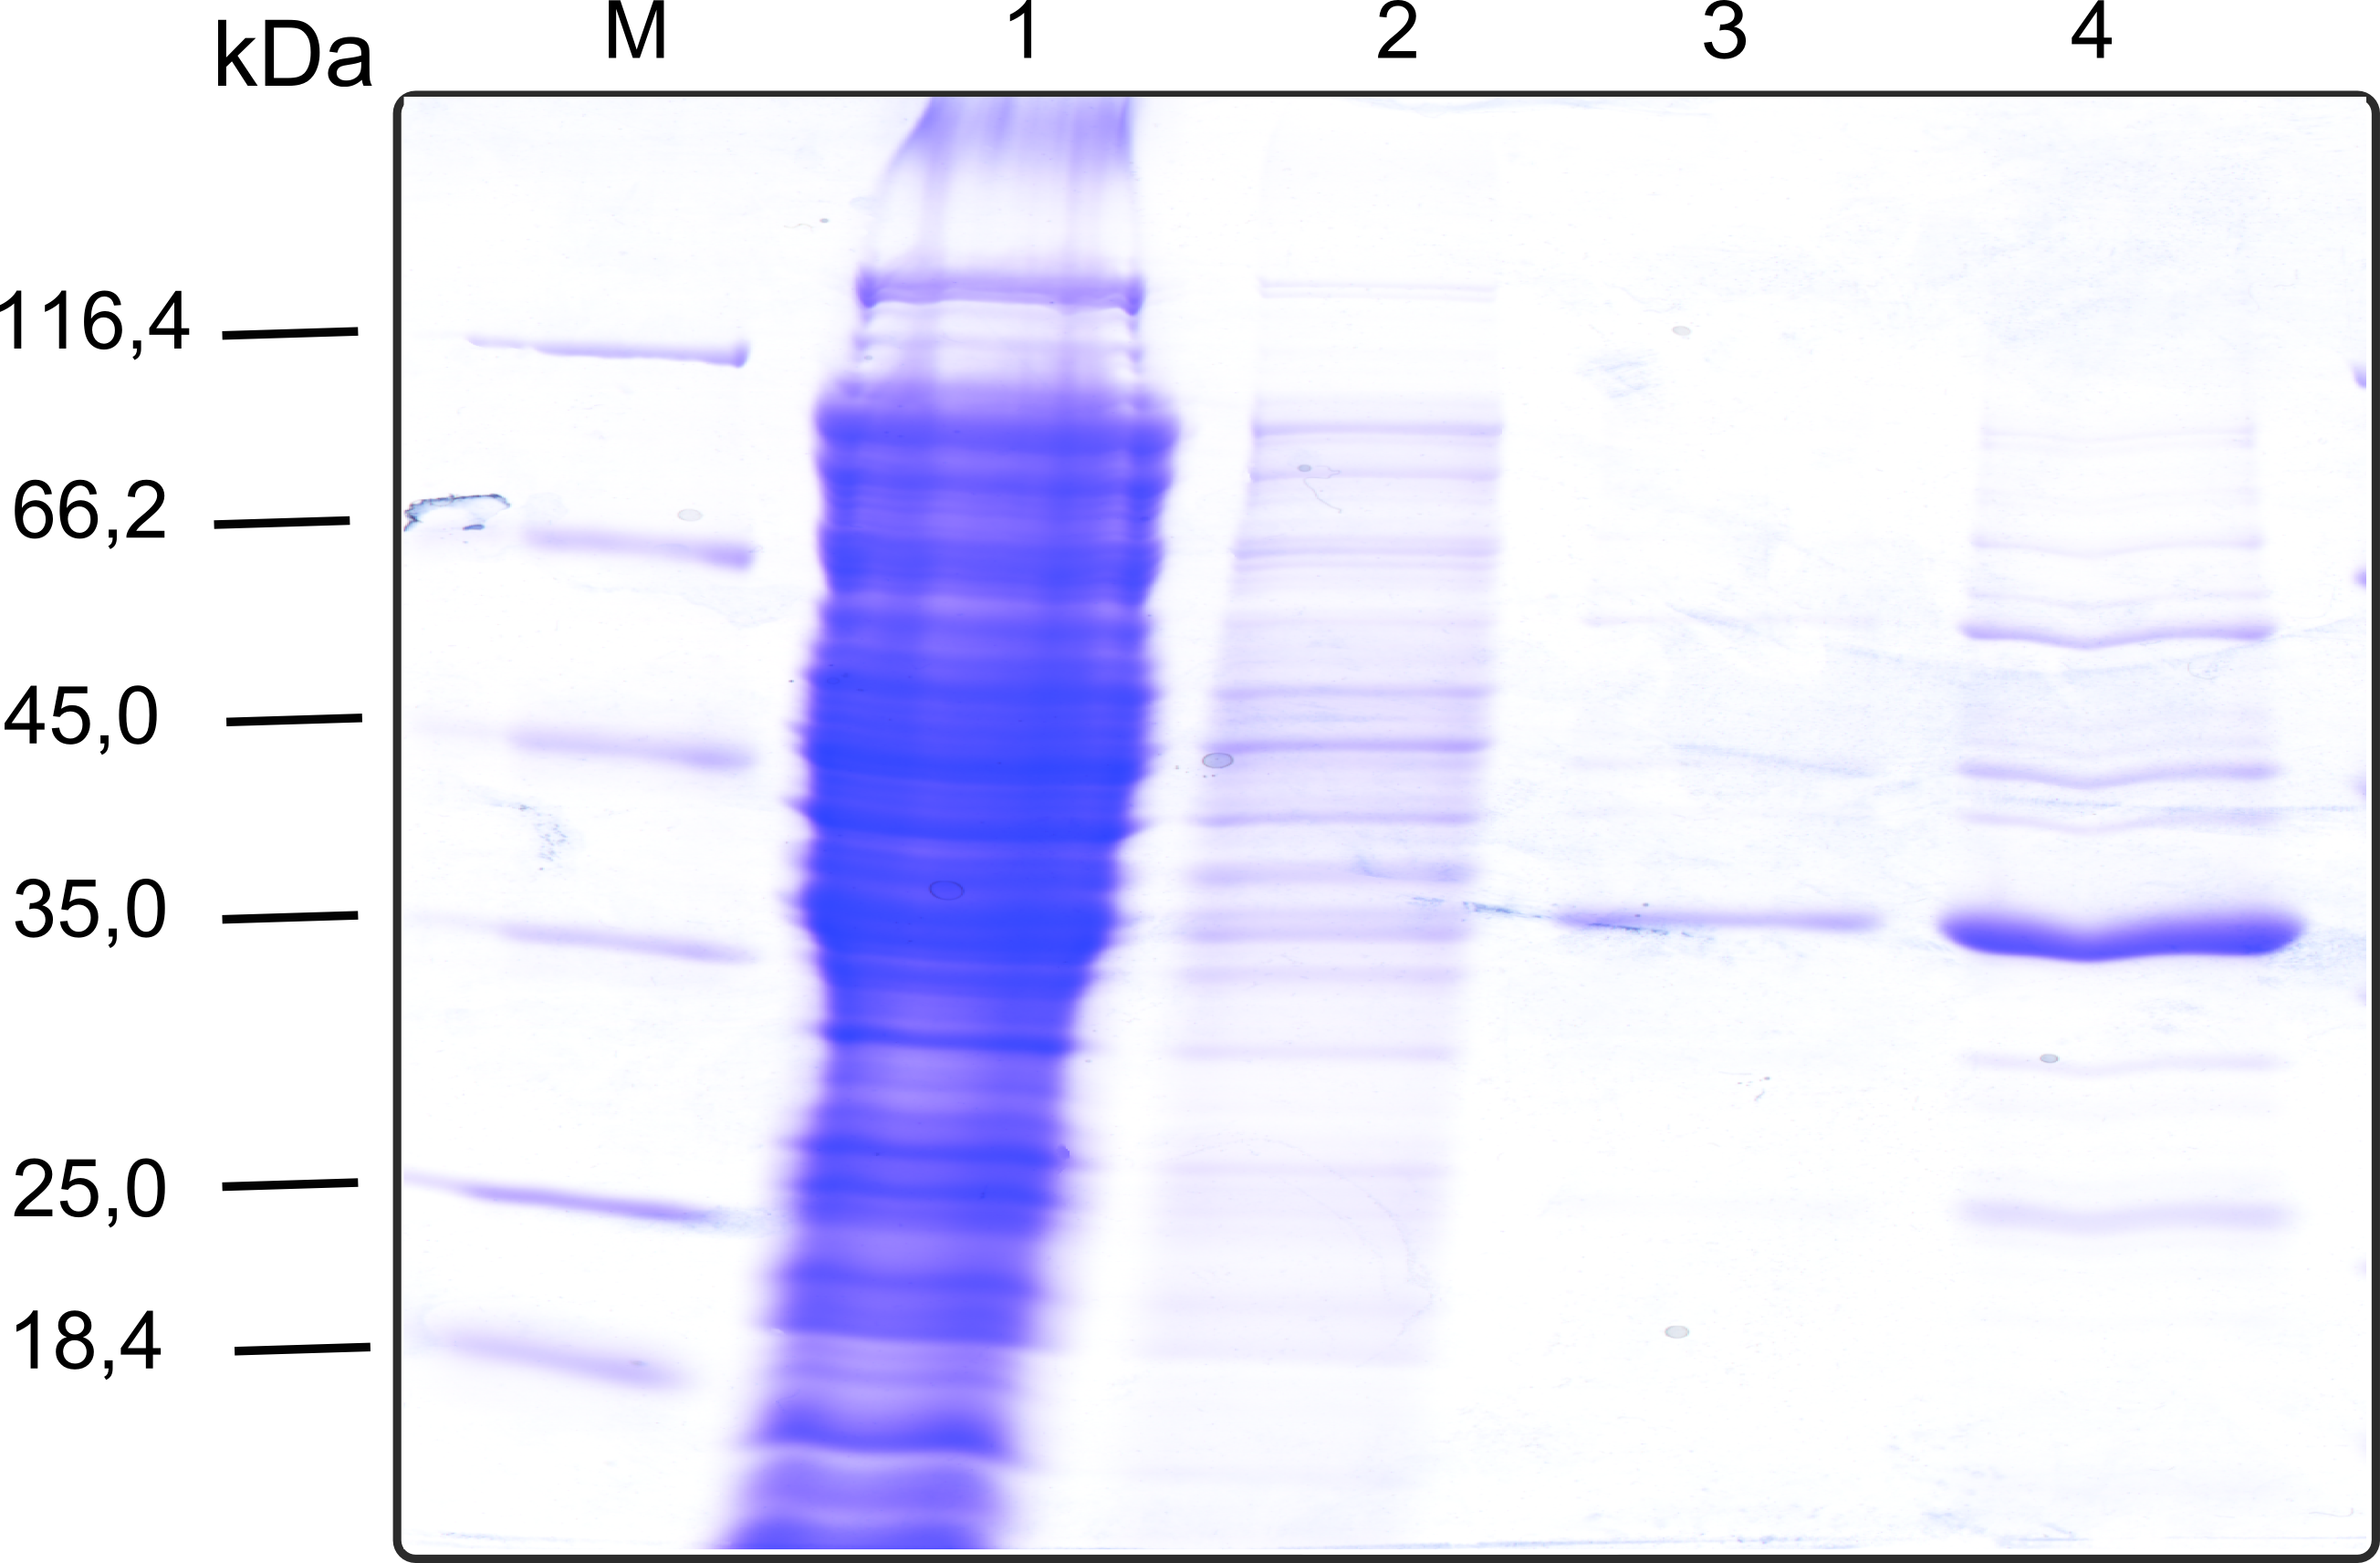
The recombinant production and purification was carried out twice, in a first attempt 2 L of LB-media were used for an analytical purpose whereas in the second attempt we produced enough purified enzyme for all subsequent experiments. This preparation was carried out in 6 x 2L of LB media. Protein production was in both cases induced at OD = 0.8 by adjusting the cell culture to 5 mM of arabinose and was carried out for 4 h for the first and 5 h for the second preparation. Cell disruption was performed by ultrasonic sound in both cases. The cell lysate was then dialyzed against 5 L of SA-buffer and subsequently applied to streptavidin affinity columns. After the application of the protein, the column was washed with SA-buffer until a base line was reached. Afterwards the protein was eluted using 5 mM biotin. During the first preparation 2-mercapto-ethanol was added after the chromatographic steps. In order to avoid oxidation of cysteine residues to disulphid-bridges, which is not desired for the cytosolic EreB protein, the preparative purification was carried out with buffers containing 5 mM of 2-mercapto-ethanol in all buffers. When comparing the size exclusion chromatograms, obtained from the analytical and the preparative purification, it can be stated that there is still a considerable aggregation peak near the void volume (Fig. B) of the column in the first attempt, which was nearly not the case for the preparative preparation (Fig. C). Therefore we would give the advise to use strictly reducing conditions while working with recombinant EreB. The finally resulting yields of the preparative purification have been determined by absorption measurement of the aromatic amino acids at 280. The total yield was determined to 25 mg of pure protein which is 2.1 mg/L of LB culture.
Kirby-Bauer Assay: Measuring remaining erythromycin on a pertri dish
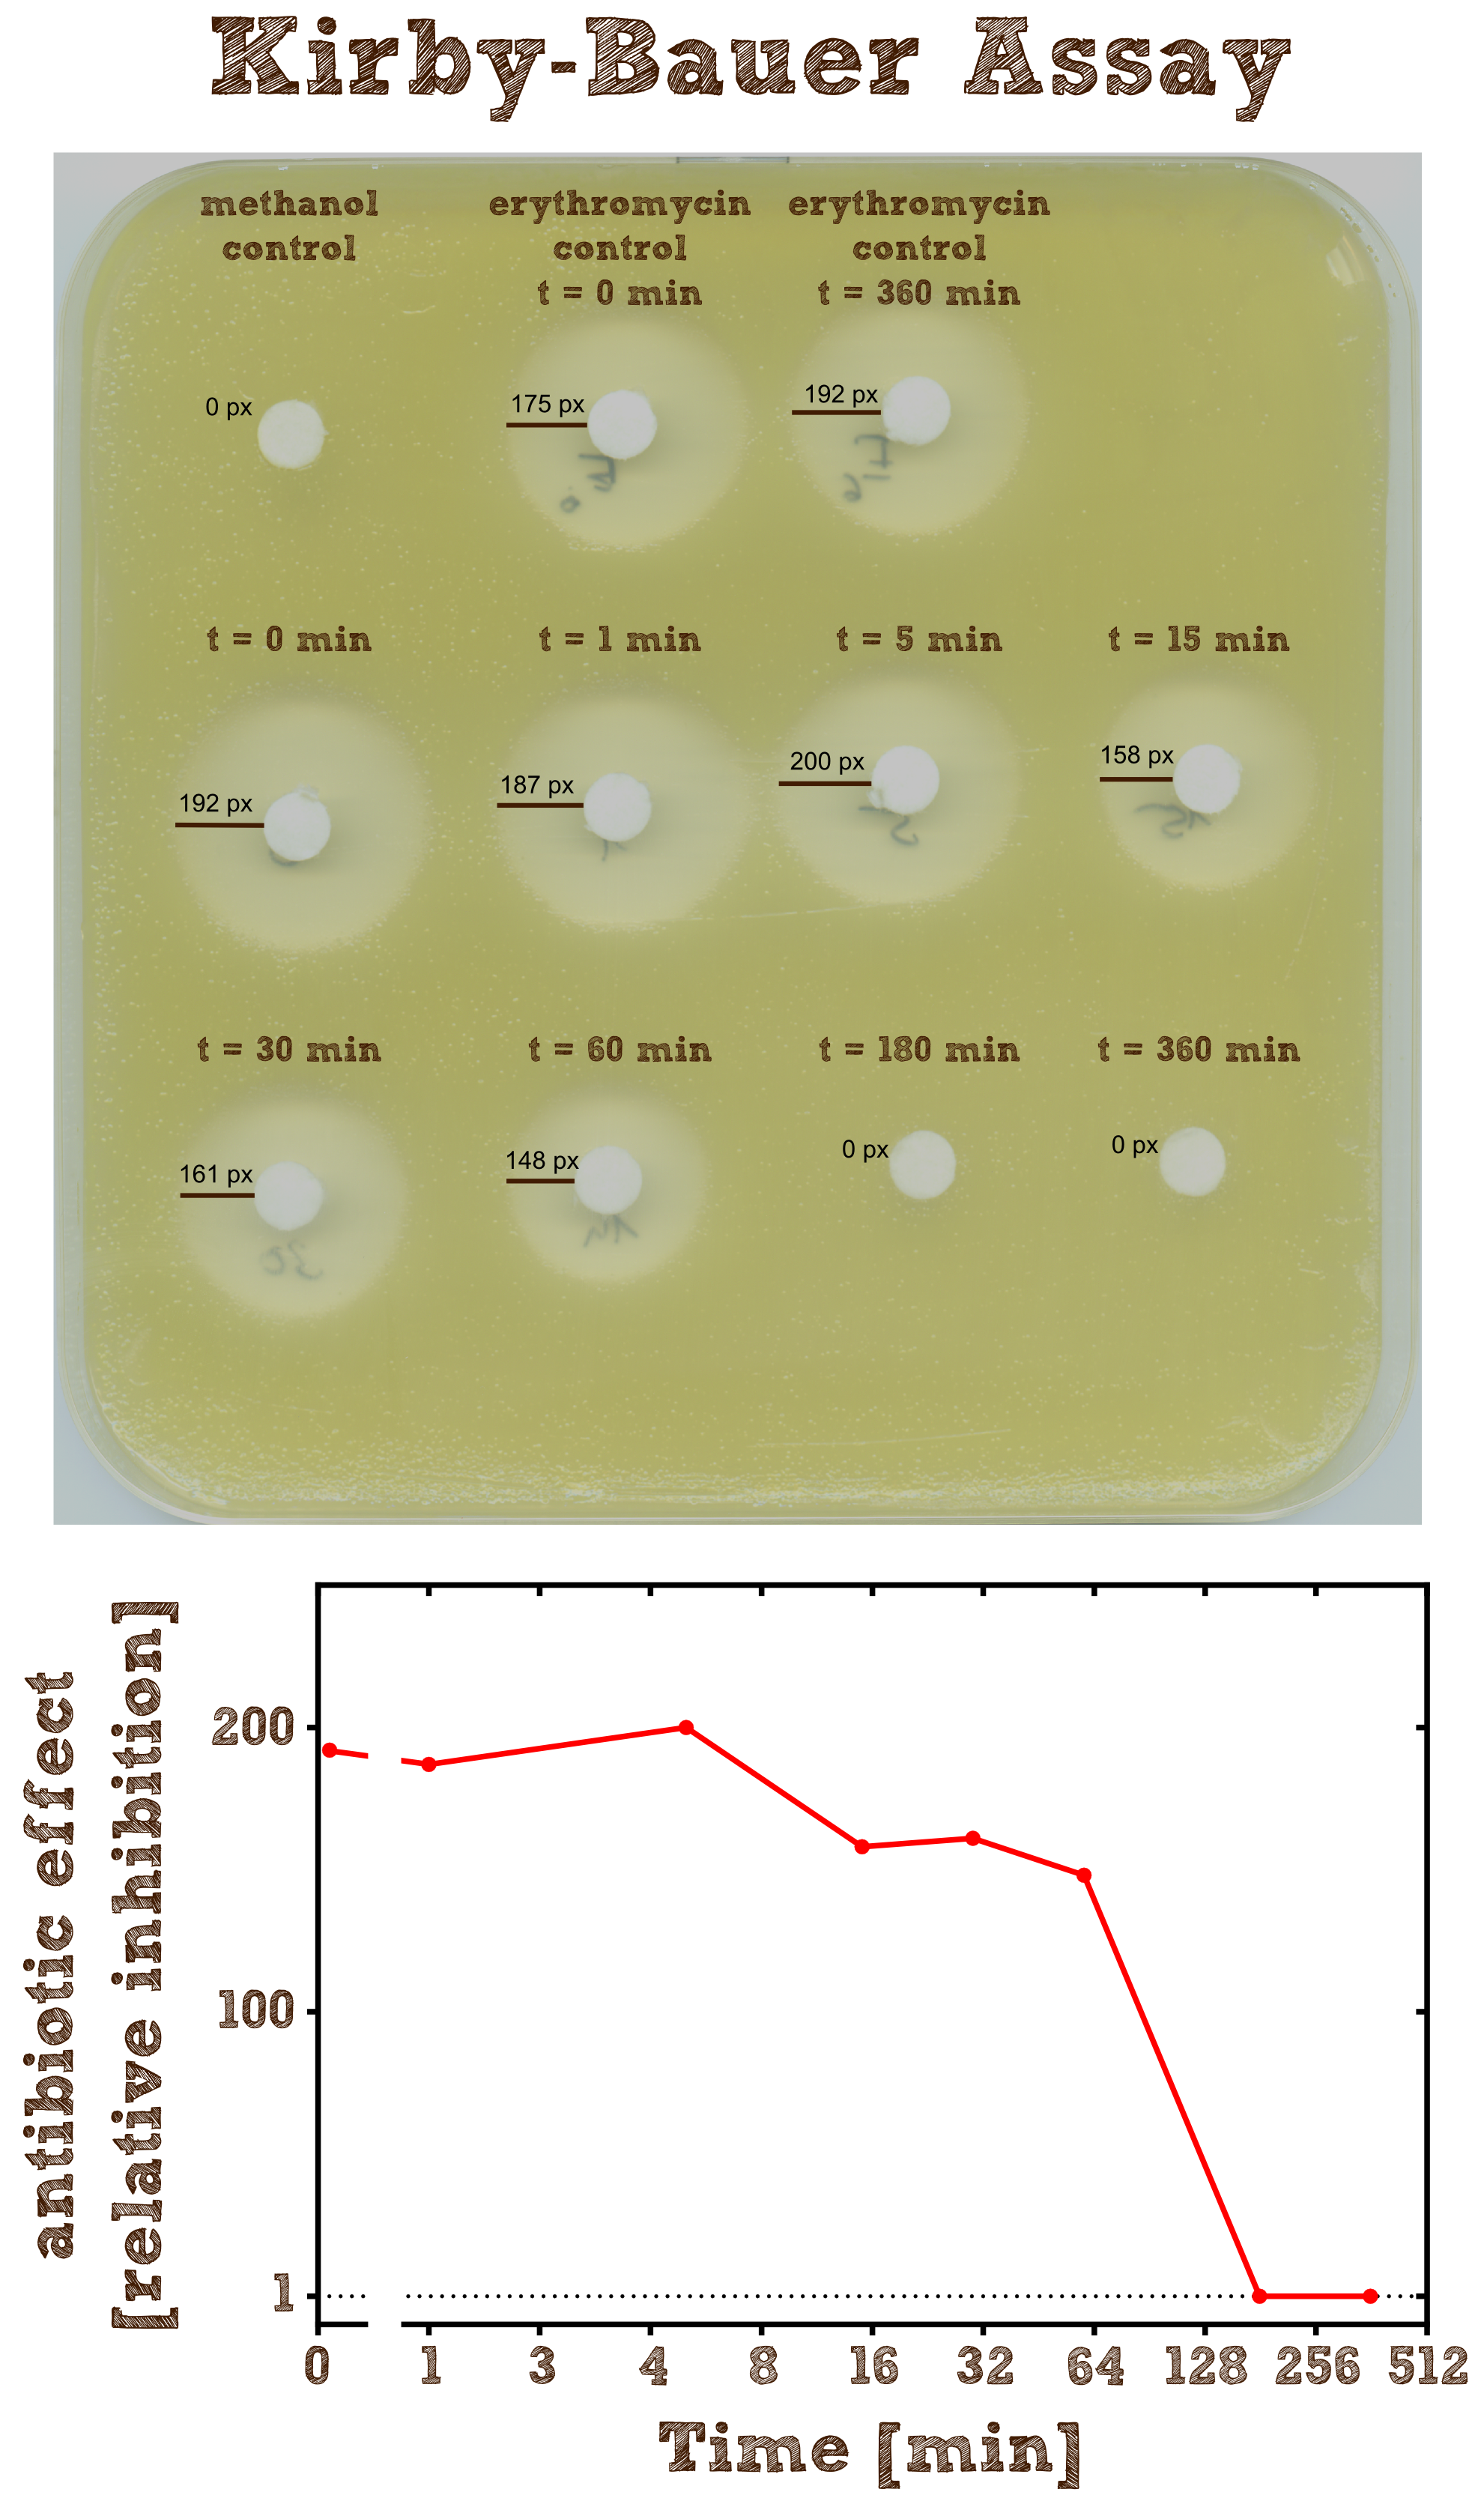
The Kirby-Bauer assay is an agar diffusion test, with which it is very easy to examine the decomposition activity of the enzyme. We also analyzed the decomposition activity of the recombinant EreB by LC-MS. The recombinant protein is incubated with the antibiotic and the reaction is stopped with methanol. To be sure that the enzyme is inhibited and the reaction does not go on, we additionally heated the reaction mixture (see table 2) after stopping for two minutes at 50°C and then shock froze the mixture in liquid nitrogen. The effect of methanol, heating and shock freezing on the bacterial strain and the substrate were checked before and have no influence.
Then bacteria from a quite dense liquid culture are plated on a LB agar plate without antibiotics under sterile conditions and spread with sterile cotton tip applicators. We used the bacterial strain Micrococcus luteus which was generously donated from the [http://www.micbio.wzw.tum.de/cms/docs/scherer-anzeigen.php chair of microbiology by Prof. Scherer`s group] and is mentioned to be specifically sensitive to Erythromycin http://pubs.acs.org/doi/abs/10.1021/bi201790u?mi=0&af=R&pr... Wright et al., 2012. Now several 6 mm filter paper discs are placed on the bacterial lawn in adequate intervals and 8 µl of the spinned down reaction mixture is added onto one disc. The mixture diffuses from the filter paper into the agar. The concentration of the compound will be highest next to the disk, and will decrease with increasing distance. If the compound is effective against bacteria at a certain concentration, no colonies will grow where the concentration in the agar is greater than or equal to the effective concentration. This is called the zone of inhibition.
| substance | amount | stock solution |
|---|---|---|
| EreB recombinant protein 40 nM | 0.18 µl | 11 µM EreB in PBS with 10 mM ß-mercaptoethanol, 2% glycerol (v/v) and 300 mM NaCl |
| Erythromycin 0.36 mM | 3 µl | Erythromycin in ethanol, 6 mM |
| Tris-HCl buffer pH 7.5 100 mM | 10 µl | Tris-HCl buffer pH 7.5, 500 mM |
| NaCl 0.08 M | 4 µl | NaCl in water, 1 M |
| ddH20 | 32.82 µl | ddH20 |
| TOTAL: | 50 µl |
As negative controls there is one mixture containing no substrate or enzyme and two mixtures without the enzyme but with antibiotic, which were incubated for 0 minutes and 6 hours.
As expected the assay shows a gradually decreasing zone of inhibtion with increasing reaction time. In the first half hour the zone is more or less constant although the enzyme is constantly degrading the antibiotic. This can be explained by the fact that the mixture only diffuses a certain range into the agar and in the first few time steps of the reaction the concentration of the antibiotic within this range is above the [http://en.wikipedia.org/wiki/Minimum_inhibitory_concentration minimum inhibitory concentration (MIC)], so the bacteria is inhibited independently of the exact concentration. After 3 hours all Erythromycin was degraded so there is no zone of inhibition anymore. Also we can see that the antibiotic does not degrade by itself significantly over 6 hours since the zones of inhibition in both negative controls are pretty much the same.
Characterisation of the enzyme
To characterize the enzyme we performed a spectrophotometric assay using the model ester p-nitrophenyl-butyrate (p-NPB) as a substrate for EreB. The chromogenic product p-Nitrophenyl shows characteristic absorbance at 405 nm. The reaction takes place even faster than hydrolysis of erythromycin since p-NPB is already highly activated and therefore readily hydrolyzed. This is also the reason why it degrades quite rapidly by itself so reactions have to be measured soon after being set up and taking a negative control is especially important.
Kinetics
To determine the kinetic parameters of EreB we prepared a 100 µl serial dilution of the substrate, starting with 1.2 mM p-NPB (in 0.4% Triton, 50 mM buffer Tris-HCl pH 7.5, 0.2 M NaCl) to which 100 µl of the enzyme (11 µM) were added. The experiment was performed in quadruplets and the mean value was then plotted (see figure 5) against substrate concentrations.
Result: The higher the substrate concentration the faster the substrate is hydrolyzed, which can be seen in an increasing gradient and is self-evident as the enzyme encounters the substrate more often and faster the higher its concentration is in the solution. This data was also used for an exact determination of the kinetic parameters in our modelling section. At these reaction conditions (pH 7.5) almost no decomposition of p-NPB takes place which is confirmed in the following experiment.
PH optimum
We prepared a buffer series from pH 4.5 to pH 10 using Sodium acetate + acetic acid (pH 4, 4.5, 5), MES (pH 5.5, 6), HEPES (6.5, 7), Tris-HCl (7.5, 8, 8.5) and Ches (9, 9.5, 10), each 100 µl in a 96-well plate. To the buffer we added 50 µl Substrate p-NPB (2 mM in 0.8% Triton and 400 mM NaCl) and finally 100 µl of the enzyme (11 µM) to start the reaction. The reaction was followed with a spectrophotometer at 405 nm for 1 hour every 15 seconds with the reaction mixture being shaken before every read. The experiment was performed threefold and the mean value was then plotted (see figure 6) against the pH-value of the buffer.
Result: From pH 4.5 to 6.5 there was no enzyme activity because the enzyme degraded, which was clearly visible as a dreary solution. The small absorption can be traced back to the degraded enzyme, so the conclusion is that EreB is unstable in alcaline surroundings. This is also the reason why cytoplasmatic localized enzyme works in our transformed moss, because the Knop medium in which P. patens is grown has a pH of 5.8. Since natural aquatic environment is generally on the alcalic side the degradation of antibiotics with EreB can only be realized intracellular. P-NPB in contrast seems to be very stable at low pH as there is no absorption measured in the negative control. With increasing pH the substrate increasingly degrades by itself while the enzyme's activity is also increasing. These two factors lead to a rapidly growing conversion of p-NPB. In a nutshell EreB works optimally in an acidic environment.
Ionic strength optimum
A serial dilution of NaCl starting with 1.5 M was prepared (50 µl) and another 100 µl of p-NPB (2 mM in 0.8 % Triton) were added before the reaction was started with 50 µl of the enzyme (11 µM). The reaction was followed with a spectrophotometer at 405 nm for 1 hour every 20 seconds with the reaction mixture being shaken before every read. The experiment was performed threefold and the mean value was then plotted (see figure 7) against the varying salt concentrations.
Result: The lower the salt concentration the higher is the enzymatic activity while simultaneously the decomposition of p-NPB increases. However, the reaction does not reach saturation as in the reaction with different pH (see figure 6). This is intuitive since the double amount of substrate and half of the enzyme's amount were incubated.
Laccase
Laccases are an important group of effector proteins that can be utilized in bioremediation to degrade xenobiotics. They are copper-containing enzymes which catalyze the oxidation of a wide range of substances. It was interesting for us as the two important xenobiotics ethinylestradiol and diclofenac can be degraded using laccases and the general function of the enzyme can easily be investigated using the commonly used substrate ABTS which results in a chromogenic product.
During the planing phase of our project we decided not to add a new laccase to the Parts Registry but instead to continue the work on the best availible laccase. The iGEM team Bielefeld Germany 2012 has created BioBricks for five different laccases during the last summer. So we contacted this iGEM team and got the advise that the laccase derived from Bacillus pumilus <partinfo>BBa_K863000</partinfo> seems to be the best choice for our effector collection. As we wanted to try this effector protein in different localisations such as cytoplasmatic, secreted, or receptor bound we converted this enzyme to RFC[25] in order to make it compatible for protein fusions.
Bioinformatics: Laccase - a secreted enzyme
For the production of effector proteins it is always essential to know whether they are naturally cytoplasmatic or whether they are secreted. Cytoplasmatic proteins usually do contain a higher portion of cysteine residues as no disulfide bridges can be formed under the reducing conditions of the cytoplasm. In contrast secreted proteins often do contain disulfide briges which make them more stable to environmental stress. The disulfide formation is possible for the secreted proteins as the oxidizing extracellular conditions facilitate the bridge formation. On the other hand there is a selection pressure for secreted proteins not to contain exposed cysteine residues that are not involved in the formation of disulfide bridges. Such free cysteine residues would leed to aggregation of proteins which would probably hamper their activity. Therefore secreted enzymes generally only contain a smaller amount of cysteine residues.
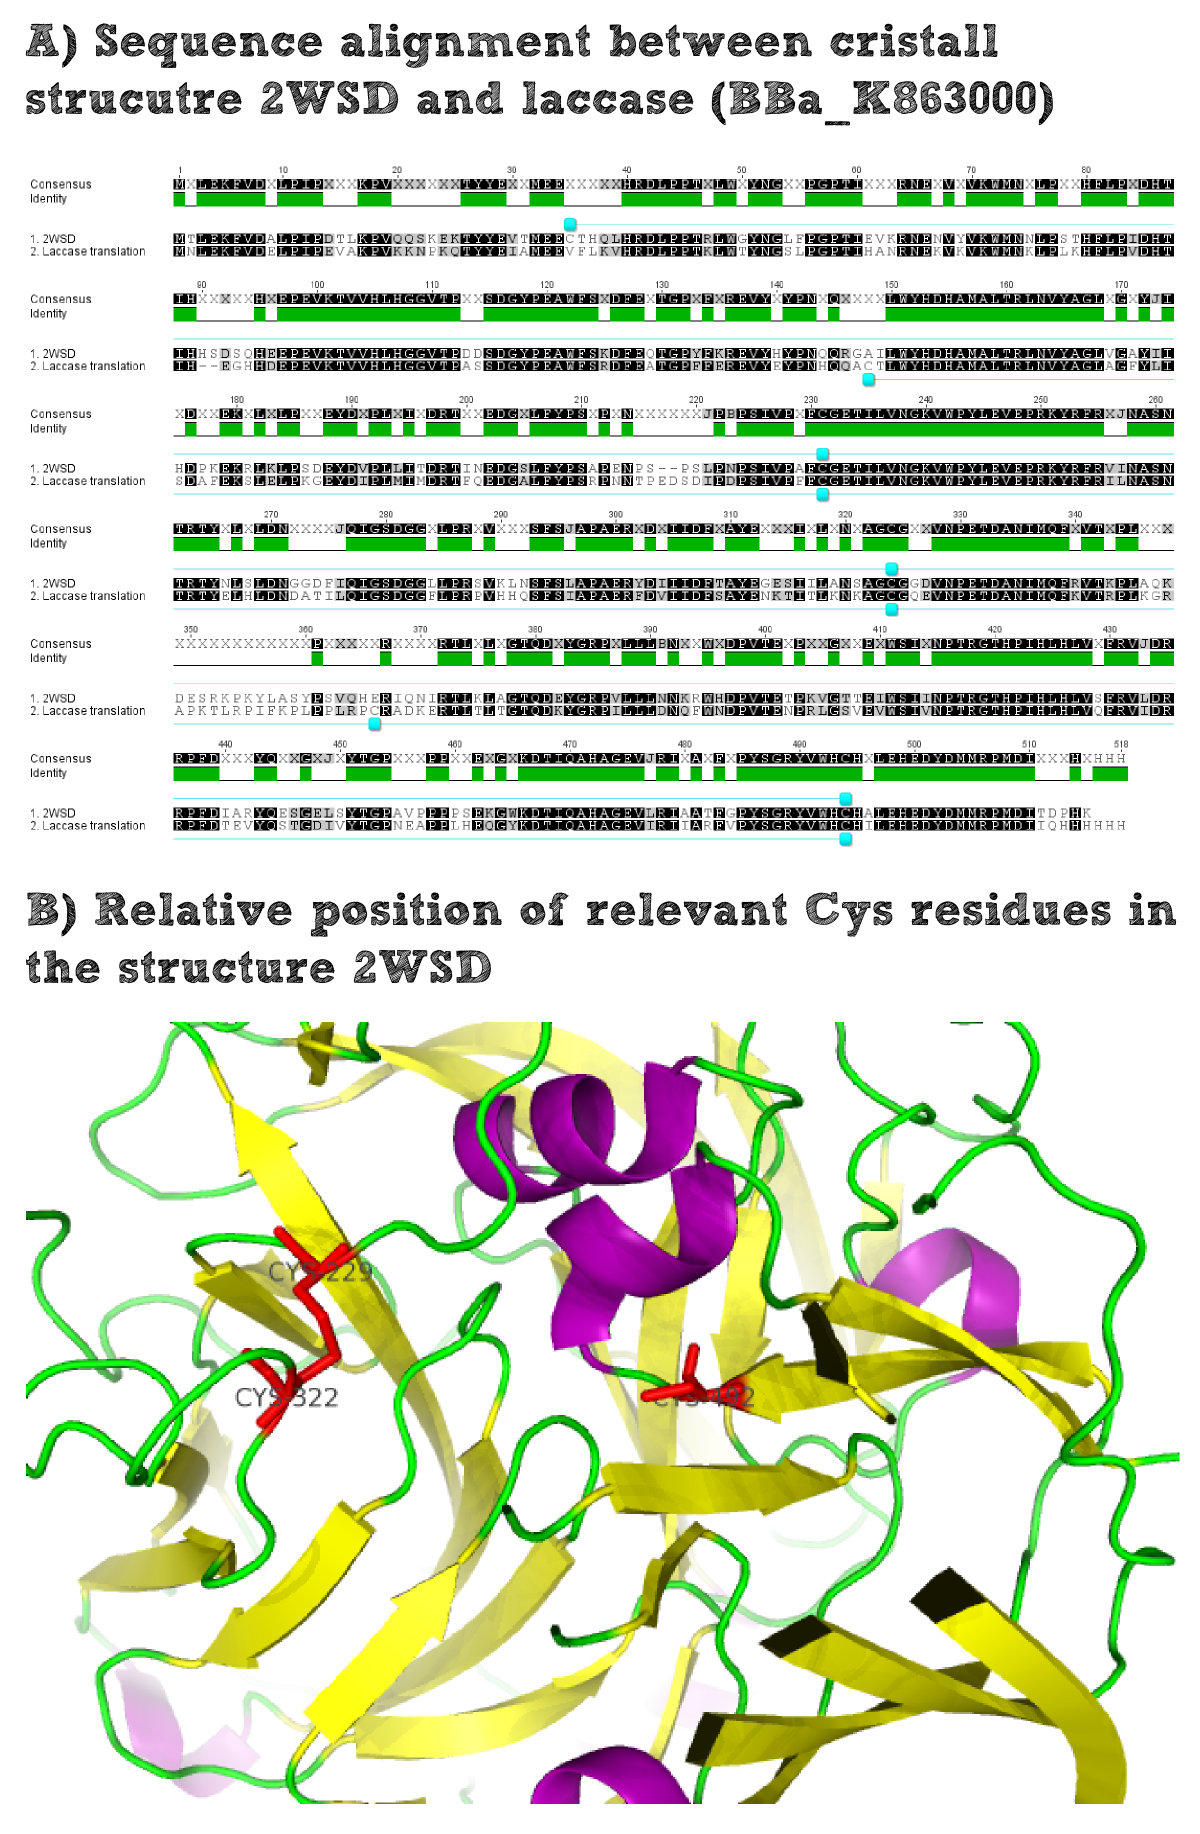
Thus it is important to find out whether the used laccase BPUL is a secreted enzyme as this would increase the chance to express it in a functional form on the extracellular part of our moss. To solve this question we did an alignment of the laccase BioBrick and the closest related solved structure. The structure contains disulfide bridges for example Cys229-Cys322. The comparison of the position of these residues within the amino acid sequence alignment shows that these residues are conserved and it can thus be assumed that the laccase BioBrick we used also contains disulfide bridges that have to be formed under oxidizing conditions and will increase the stability of our effector protein.
We thus used 10 mM of potassium ferrocyanide which is a milde oxidization reagent subsequent to the cell disruption and did not use any 2-mercaptoethanol as a reducing agent during the protein purification.
Analytical preparation
As with all other effector proteins we at first performed an analytical preparation in a 2 L LB-media scale in order to learn about the protein and then up-scaled the production to 6 x 2 L of LB media. The production was carried out cytoplasmatically in E. coli BL21. The culture was grown to OD 0.8 and then induced using 5 mM of arabinose and the protein production was carried out for 5 hours. Cell disruption was performed using ultrasonic sound and subsequently the cell lysate was dialyzed against 1 x SA-Buffer that contained additional 5 mM of the milde oxidation reagent potassium ferrocyanide in order to form the disulfide bridges present in the laccase structure (see previous paragraph).
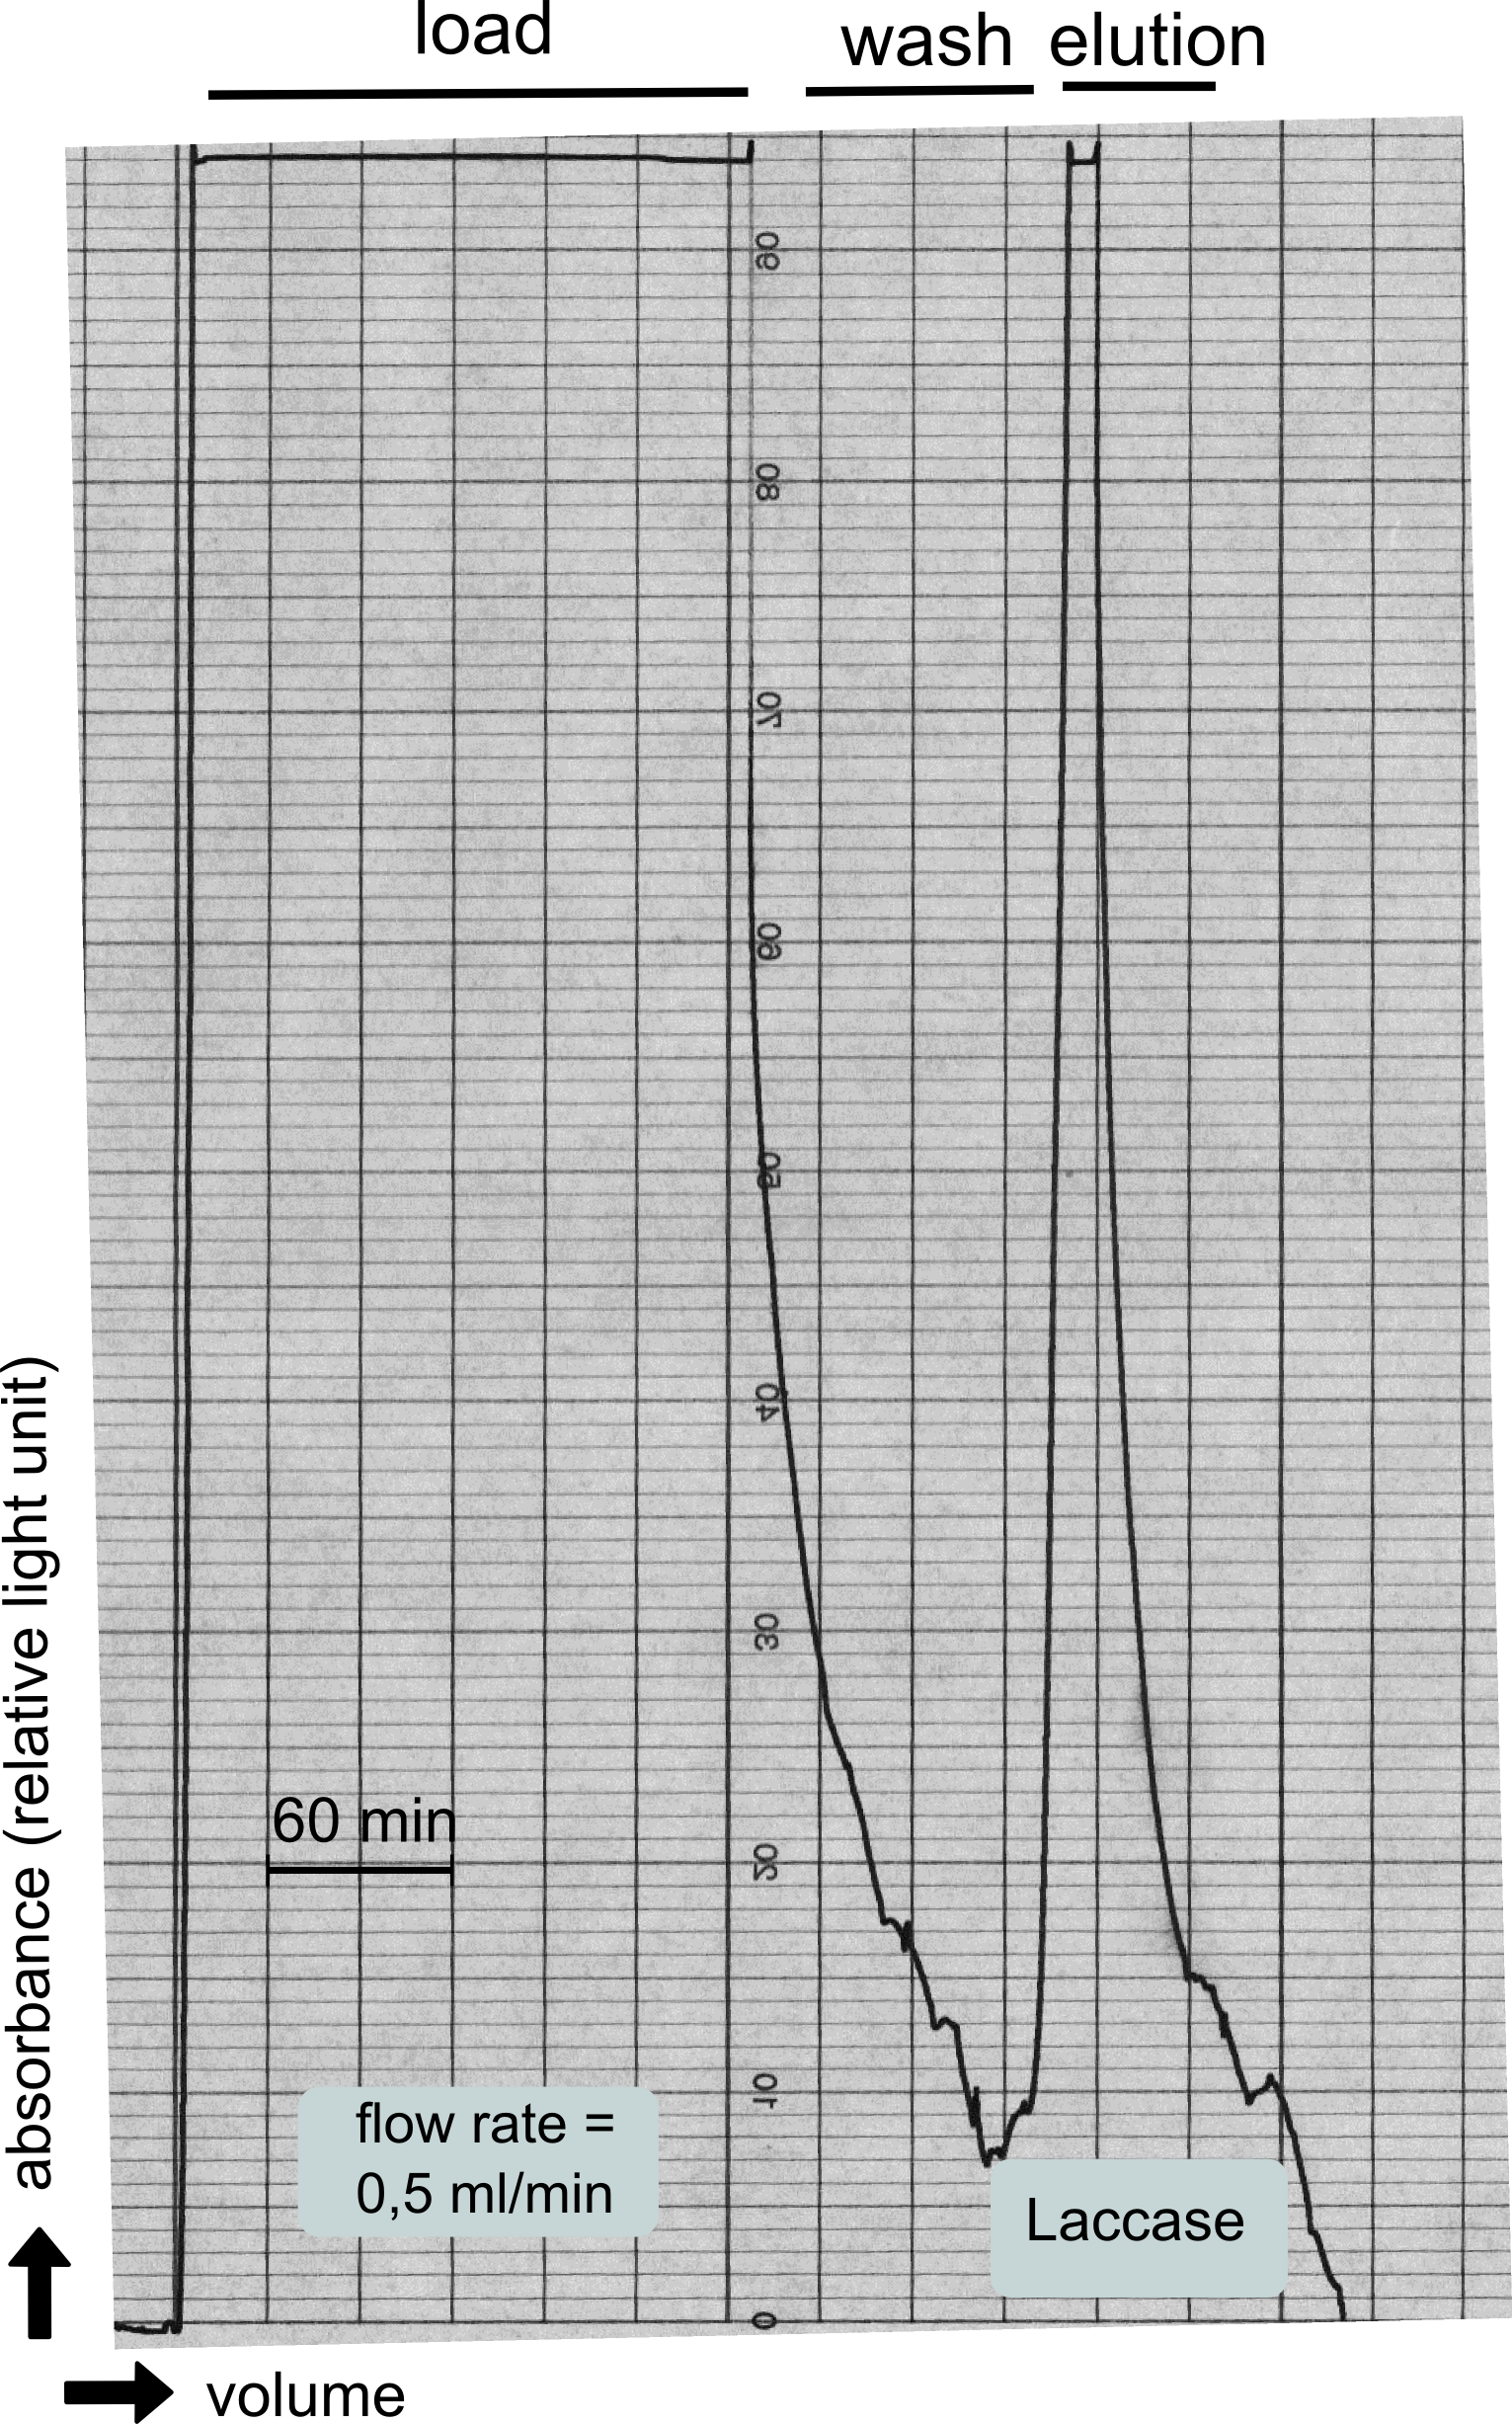
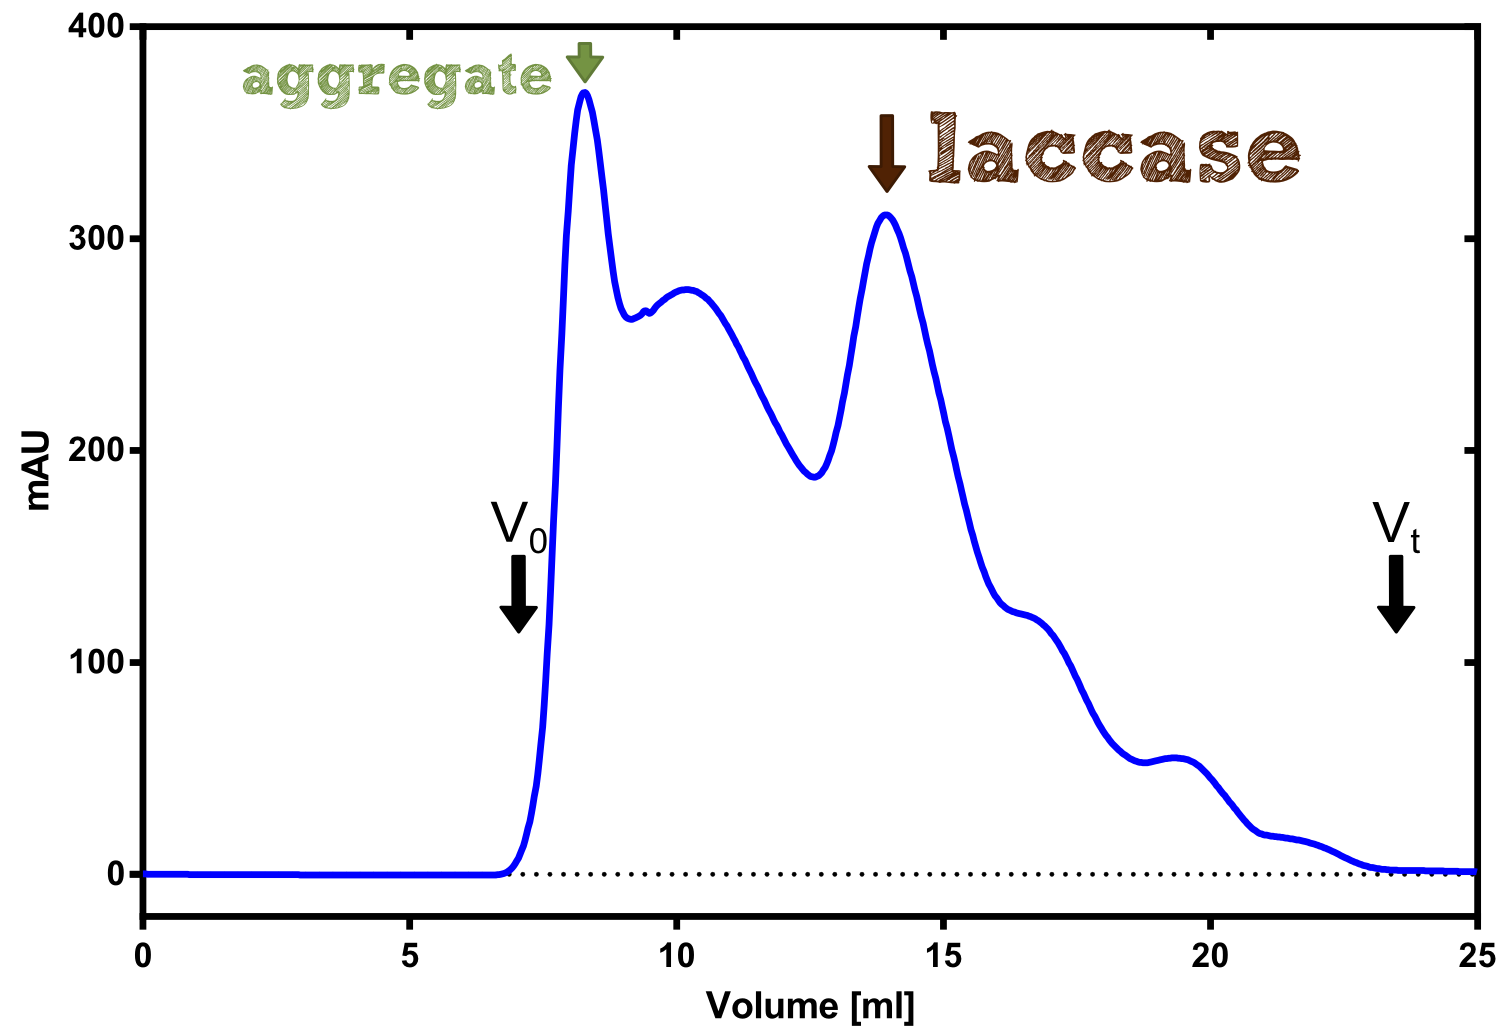
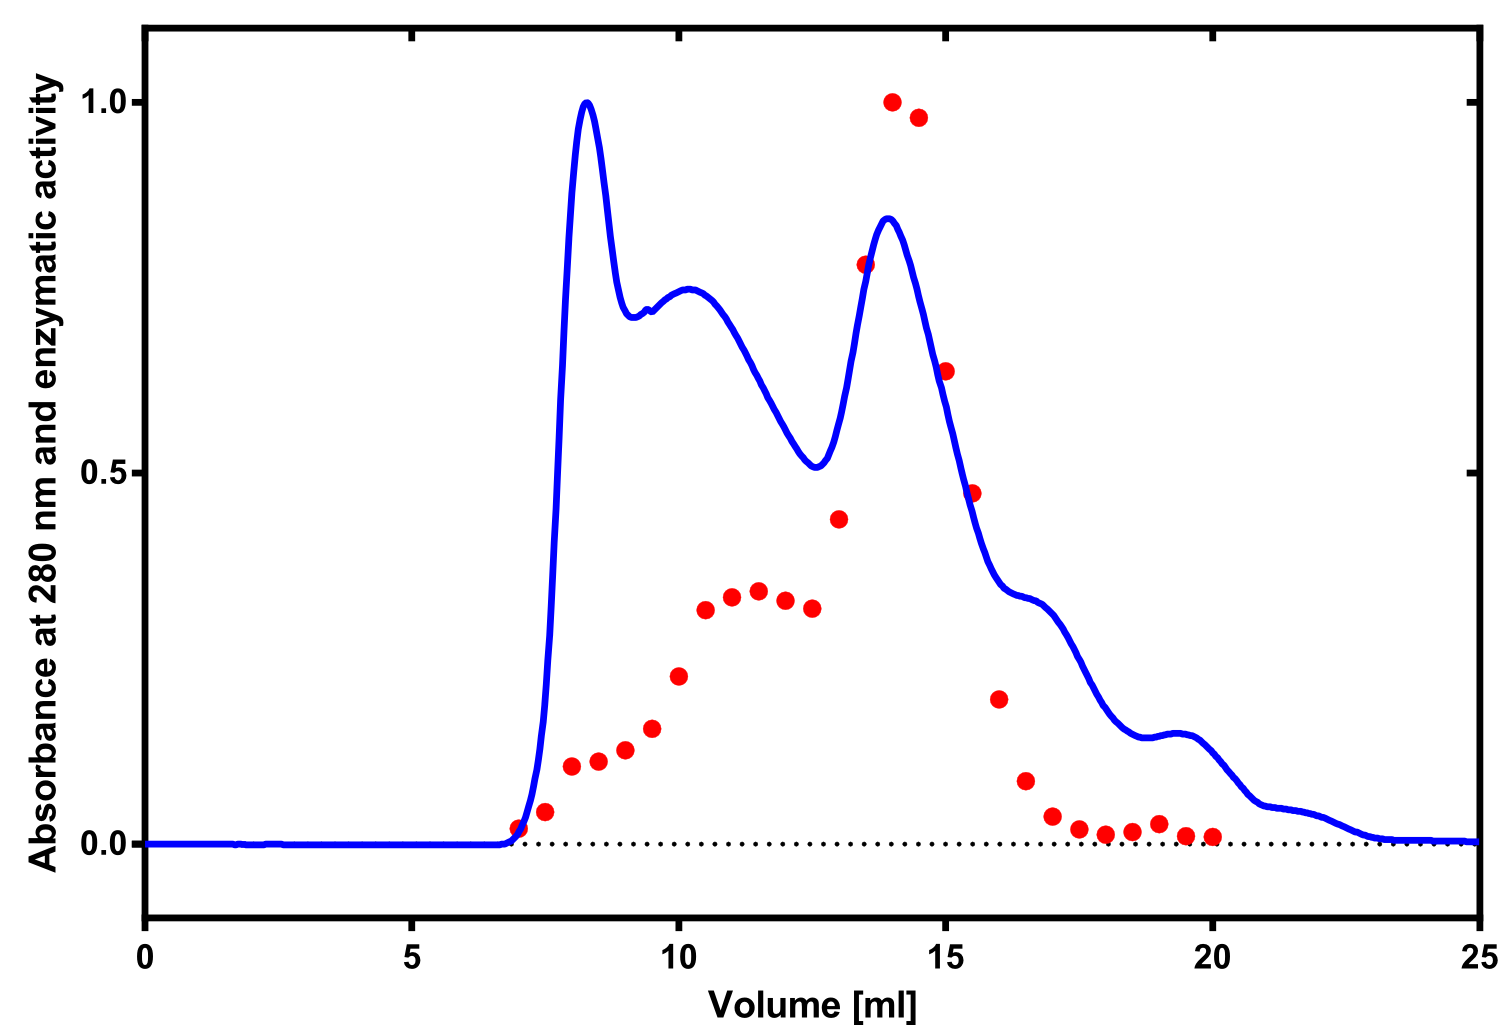
The streptavidin affinity chromatography yielded a satisfying elution peak that was then concentrated using a centrifugal filter unit (MWCO: 30 kDa). The concentrated protein was then applied to an ÄKTA purifier equipped with a Superdex 200 10/30 size exclusion chromatography column. The chromatogram shows three major peaks with a first peak near the void volume that corresponds to aggregated protein >600 kDa, a second elution peak of high molecular protein and a third elution peak corresponding to the desired laccase protein. This assumption was made on the knowledge that on this column proteins of arround 50 kDa elute at an elution volume of 14 to 15 ml. This assumption was subsequently confirmed by ABTS activity assays with all elution fractions (see next section).
Activity determination using ABTS
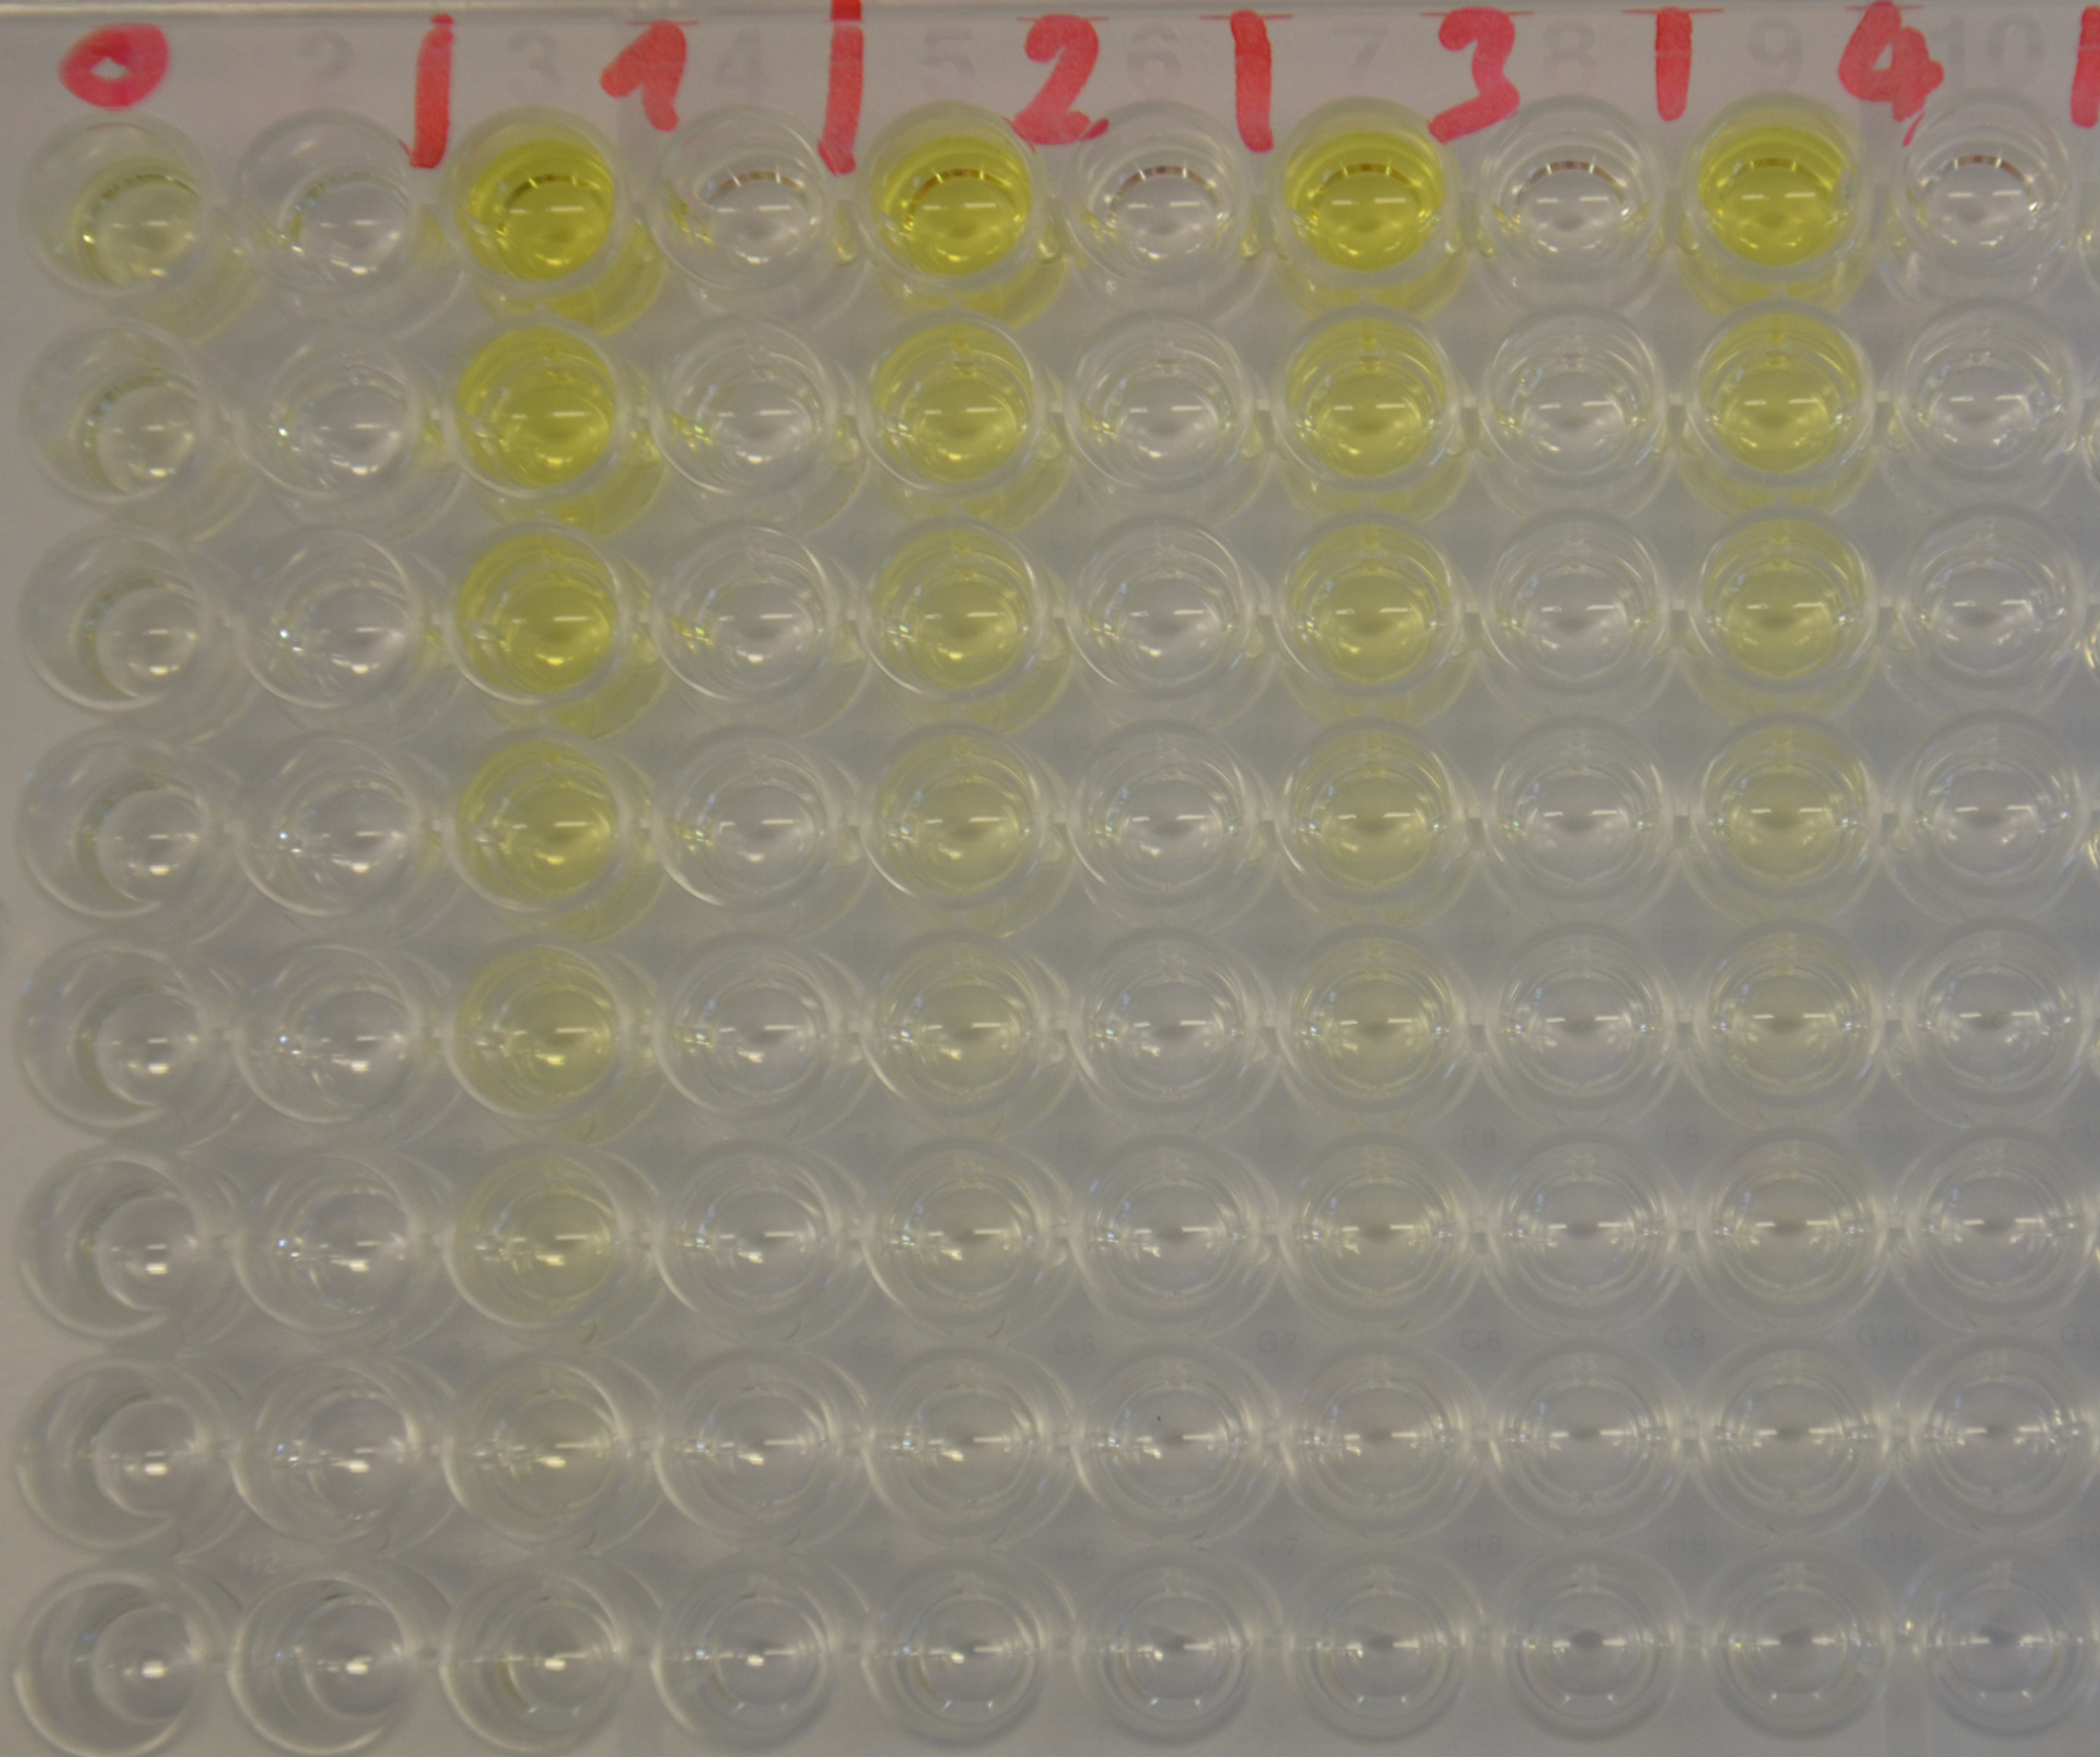
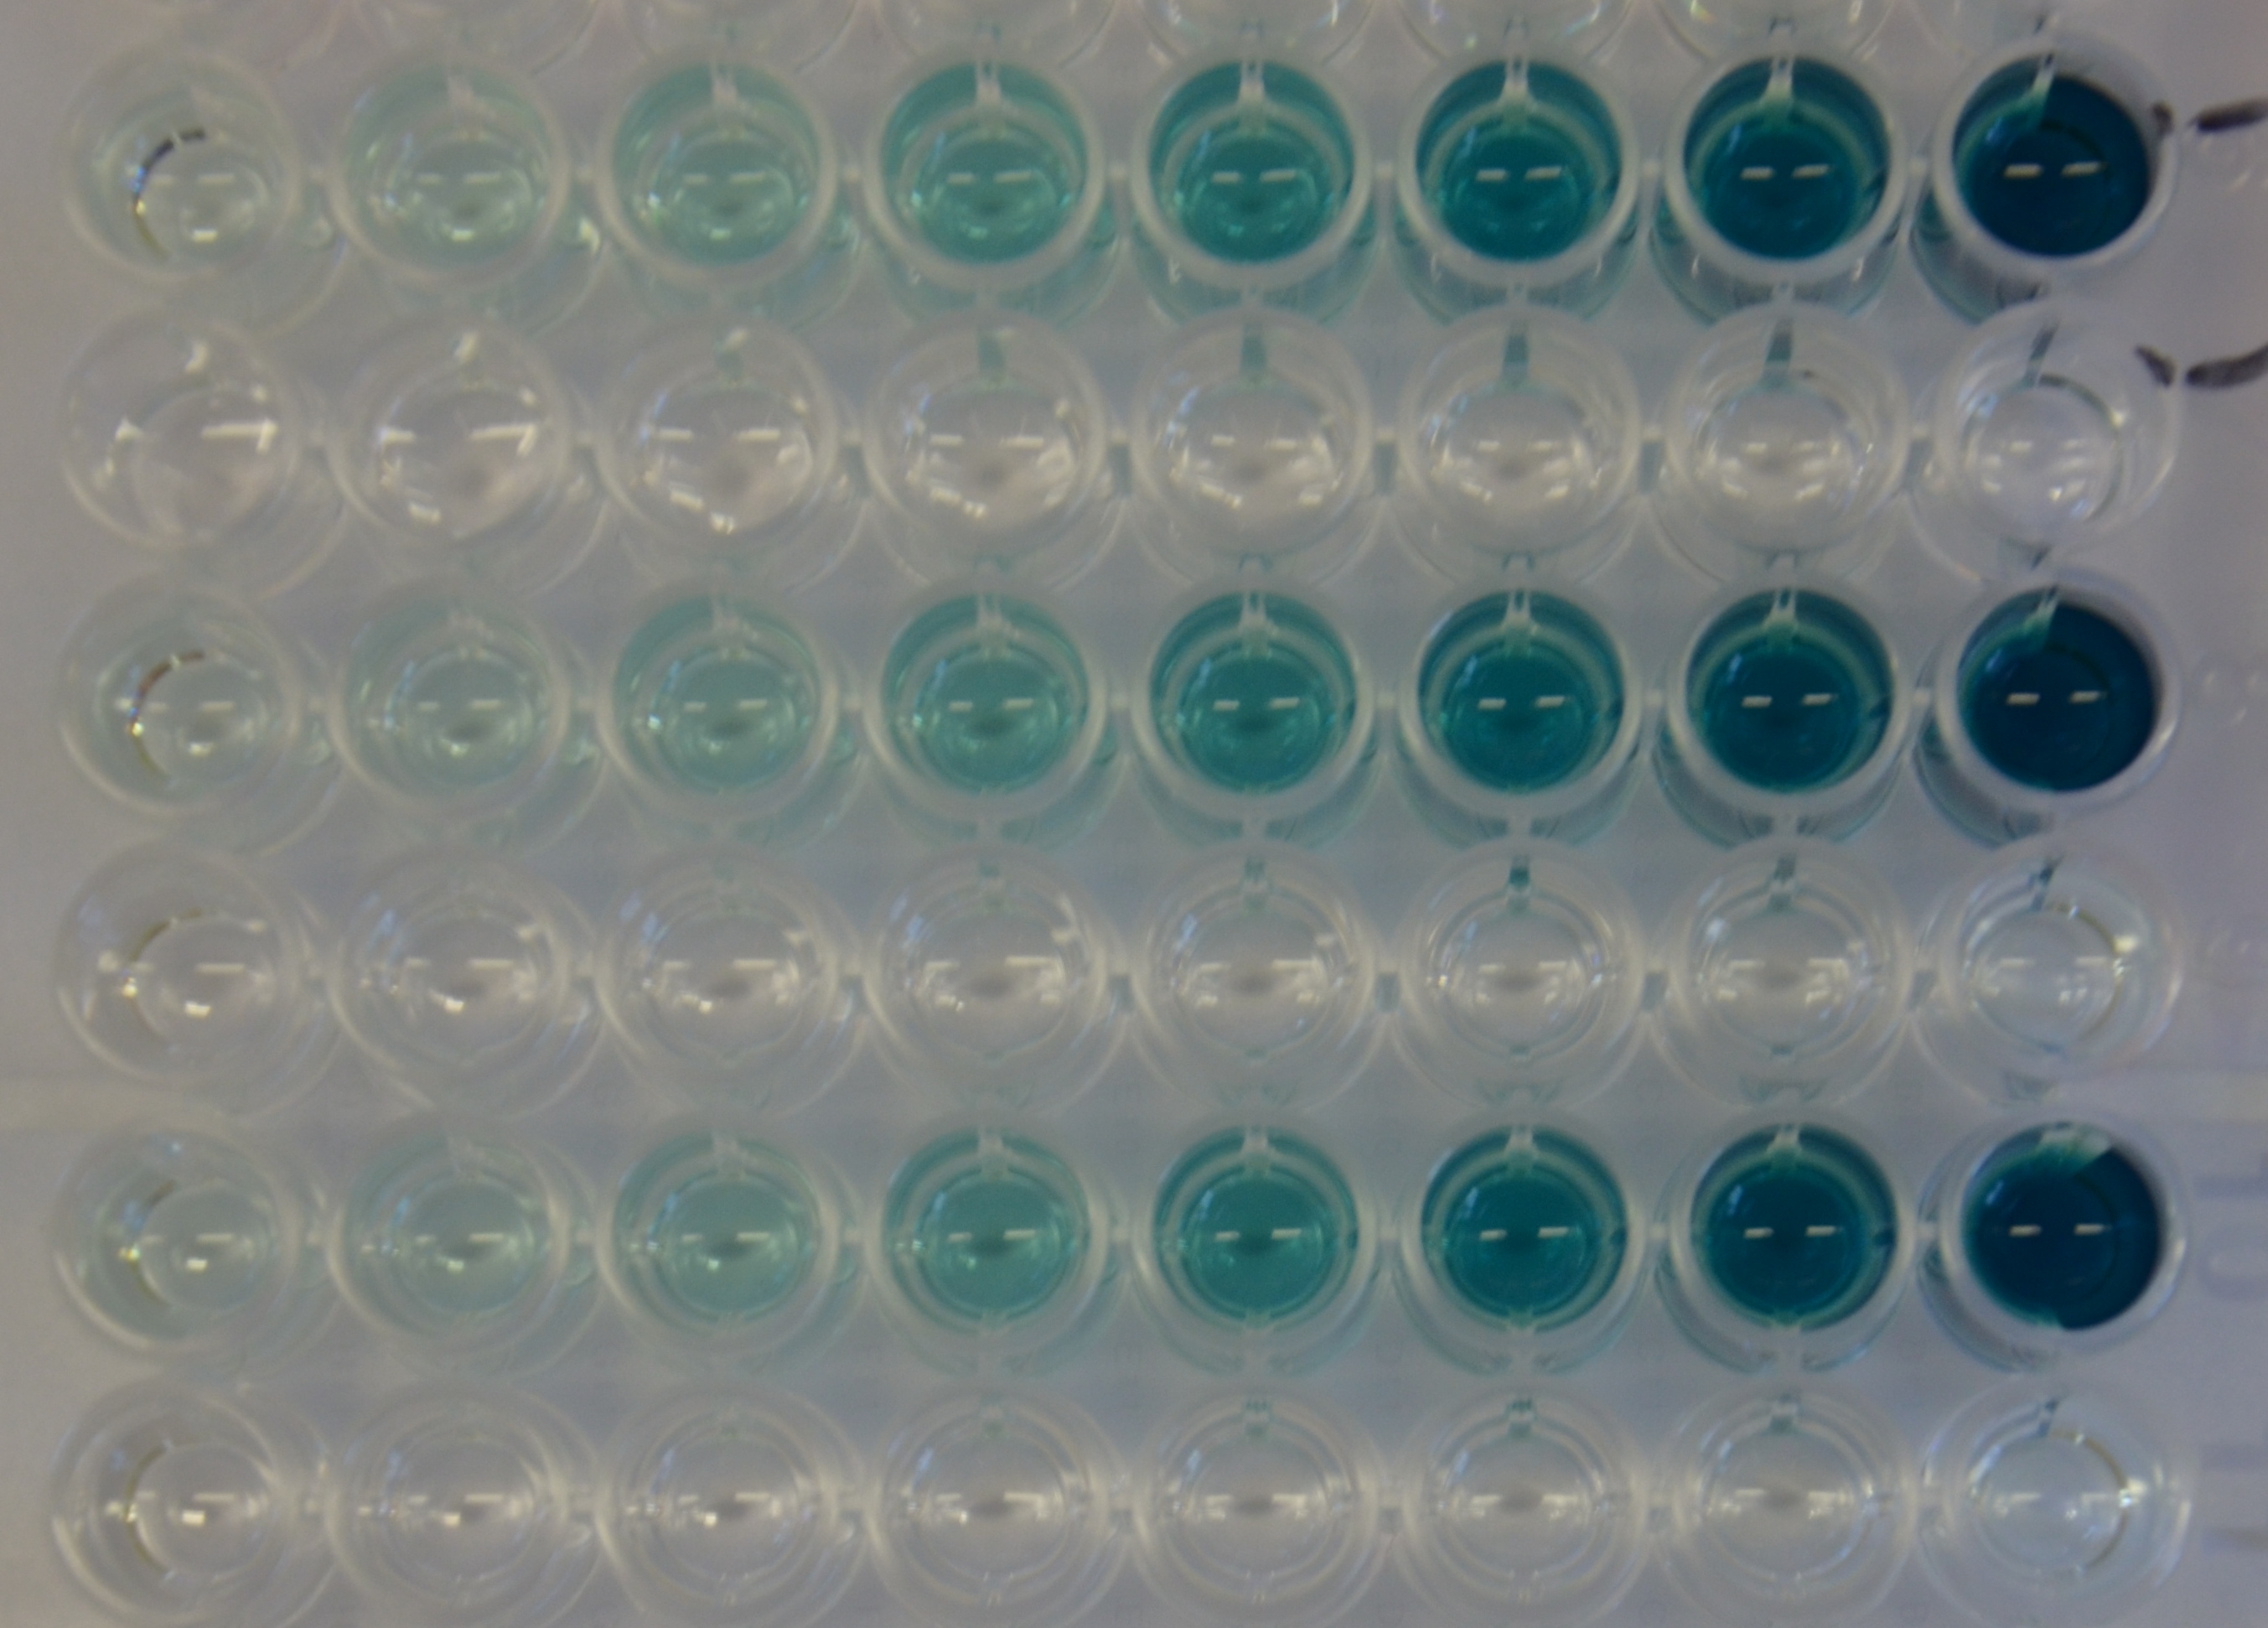
The enzymatic activity of the purified laccase was determined by the ABTS-assay. In a first pre experiment the appropriate dilution factor was determined to be 100-fold. The elution fractions obtained from size exclusion chromatography were diluted 1:100 in PBS and in an ELISA plate. 100 µl of the enzyme and 100 µl of ABTS substrate were mixed and a kinetic measurement at 405 nm was performed. The absorption at 280 nm in the SEC chromatogramm (blue) identifies three main protein peaks, with a first peak corresponding to aggregated protein, a shoulder which also corresponds to higher molecular protein and a single peak which was proposed to be the monomeric laccase. The relative activity obtained for the different elution fractions was plotted in the same diagramm and shows a clear peak which matches the laccase peak in the SEC. Beside this major peak a second smaller peak of active fraction was visible which appeared in earlier elution fractions and might correspond to dimerized laccase. As the laccase is a secreted enzyme which also bears dislufide bridges it was produced in the cytoplasm and subsequently it was oxidized to form the proper disulfide bonds. As this process might be only partial there is a possiblity for the formation of disulfide dimers. Nevertheless the fractions 14 to 17 were pooled for further experiments as they showed the highest enzymatic activity. The protein concentration of the pooled fraction was determined to be 0.48 mg/ml after SEC.
Characterization of the enzyme
The enzymatic activity of the laccase BioBrick was investigated under different conditions as this was important for our filter model in which we try to simulate the application of the laccase in our remediation raft to clean highly contaminated rivers. The first activity assays were dilution series experiments in which we wanted to determine the appropriate amount of protein which we had to apply in the assays. We found that a 1:100 dilution of the prepared protein (0.49 mg/ml) to be ideal and thus performed all experiments with this concentration.
Kinetic assay (Substrate dependency)
For the kinetic assay a 1:1 dilution series of the substrate was set up. The oxidation of the ABTS substrate was then monitored over time observing the absorbance at 405 nm. The experiment was performed in triplicates (see Figure 14) and as a control the dilution series of the substrate was incubated with PBS instead of the diluted protein. It can be seen that there is no autolytic oxidation of the substrate. The resulting kinetic parameters are summarized in table x.| Parameter | Best fit |
|---|---|
| kf | 1.606 E+05 1/s |
| kr | 3.450 E-08 1/s |
| kcat | 63.522 1/s |
| KM | 0.396 mM |
For a detailed evaluation of the results please see our enzyme kinetics modeling.
Activity dependency on pH values
Secondly we did a series of experiments in which we determined the effect of the pH on the enzymatic activity (see Figure 16). For these experiments 100 µl of various 500 mM buffer (various pH), 50 µl of ABTS substrate (0.5 mg/ ml in ABTS-bufer from Roche) and 50 µl of laccase, diluted 1:100, were incubated. The absorbance at 405 nm was then recorded over the time in a 96-well plate. The change in absorbance over time is shown for every condition as the average of three measurements with standard deviation. The resulting plot shows that there is an optimum for the pH which is around 5. This matches the acidic conditions present in the apoplast of the plant, which is mainly between pH 5 and pH 6.5, so localizing the enzyme in the interspace between cell wall and membrane is theoretically possible.
Influence of ionic strength
Beside the substrate dependence and the influence of the pH value, the dependence of the Laccase on the ionic strength of the media was of interest for our project as well as is is for further users of this BioBrick. We thus incubated the recombinant laccase (1:100 dilution) with ABTS substrate and various concentrations of sodium chloride. This was done in triplicates and for a control without the enzyme with PBS instead.
As it can clearly be seen the enzymatic activity is increasing with decreasing salt concentration. For a detailed analysis of the results please look at our enzyme modelling page.
Influence of the temperature
To analyze the temperature dependency of the laccase we determined the katalytic activity with a 1:100 enzyme dilution and 0.12 mM of the substrate ABTS. The enzymatic conversion could be followed by the absorbance of the resulting product at 405 nm. The enzyme and substrate were both incubated at the specific temperatures for half an hour before starting the reaction. As expected the enzymes efficiency is increasing with temperature, but it is also acceptable at lake and river temperatures which are about 10 to 15 °C.
For our filter modelling we determined kcat/KM from these measurements by looking at the initial gradient. We normalized this by equating the enzyme activity at 20° C with the activity determined by our modeling of the substrate dependence of the laccase. This can be assumed, because in the experimental setup the substrate concentration is a lot less than the KM value we determined, which then simplifies the Michaelis-Menten equation to give, that the initial gradient is proportional to the enzyme activity kcat/KM.This gave us the activity dependence shown in Figure XX.
Half-life of the laccase in river water
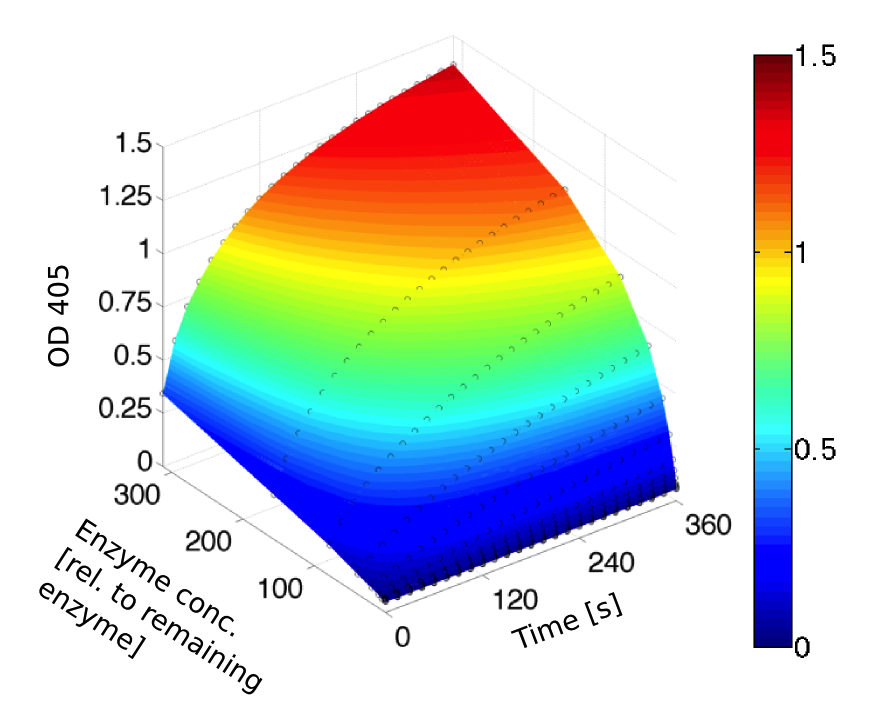
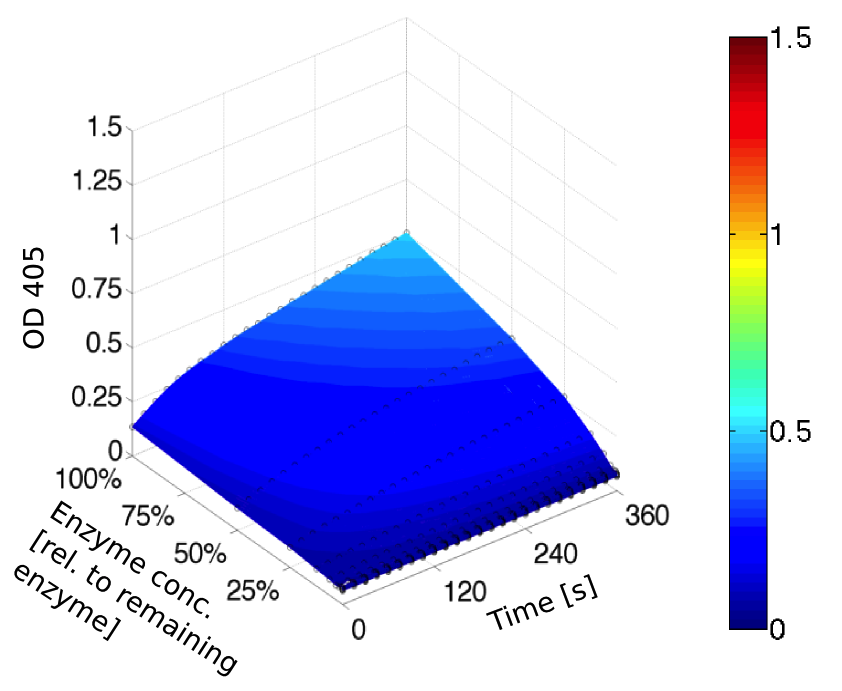
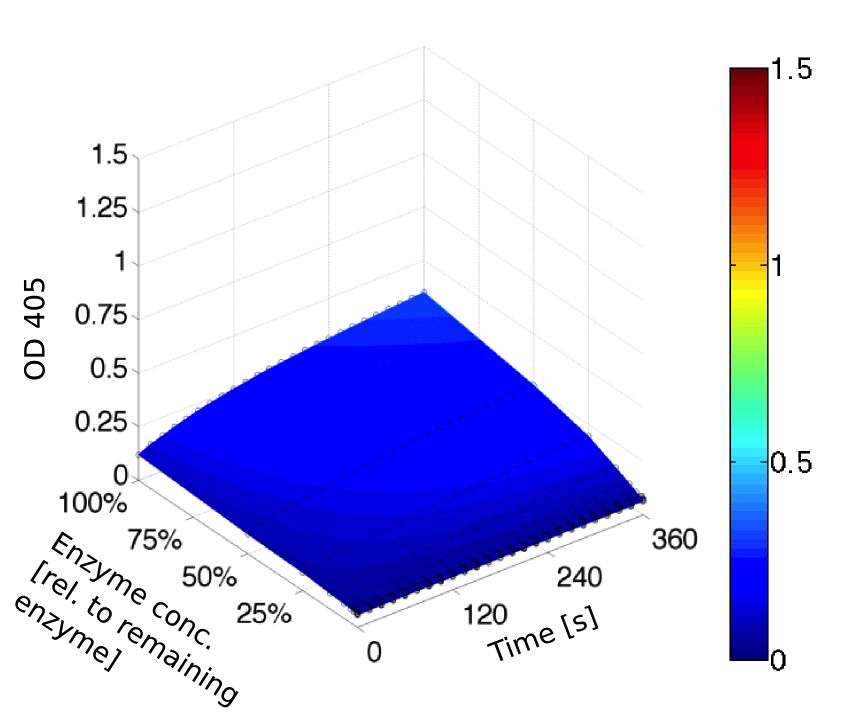
Laccase with an initial concentration of 0,3125 µM was diluted with 1:1 steps at the initial time, then ABTS at a concentration of 97.2 µM was added to each dilution and the kinetic of the ABTS reaction was recorded using a photometer at 405 nm. Figure z shows the results.
Then the laccase was dialyzed against river water, taken from the local river Isar. After 96 hours and again after 144 hours, the initial dilution experiment was repeated giving figure x any y, respectively. It is apparent that the enzymes activity has been reduced. From these measurements we estimated the half-life to be 36.3 hours, corresponding to an inactivation rate of 5.3 10-6 s-1, which we then used in our filter model.
Nano Luciferase
The Nano Luciferase (NanoLuc) which was introduced in 2013 by Promega is a new member of the luciferase reporter gene/protein familiy and shows some advantages compared to the other family members. The NanoLuc is very small (19 kDa) compared to the firefly luciferase (61 kDa) and the Renilla luciferase (36 kDa). On the other hand it is also said that the specific activity of the NanoLuc is about 150-fold stronger compared to conventional luciferases and the background caused by autoluminescense of the substrate is said to be remarkably smaller.
Production in E. coli and purification
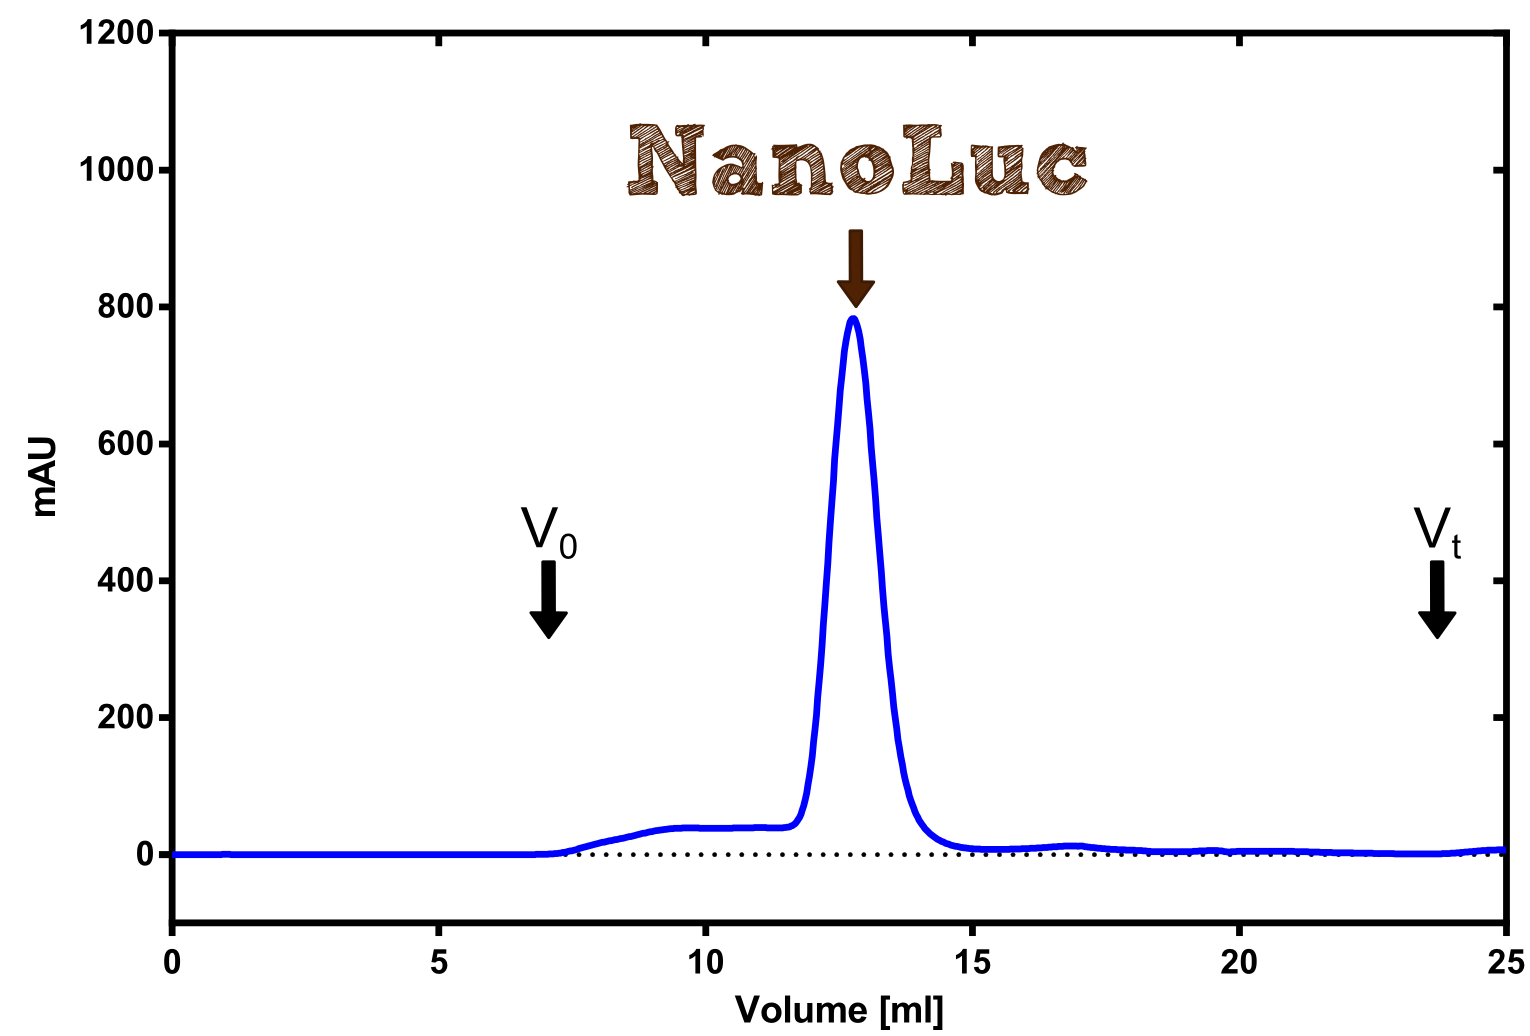
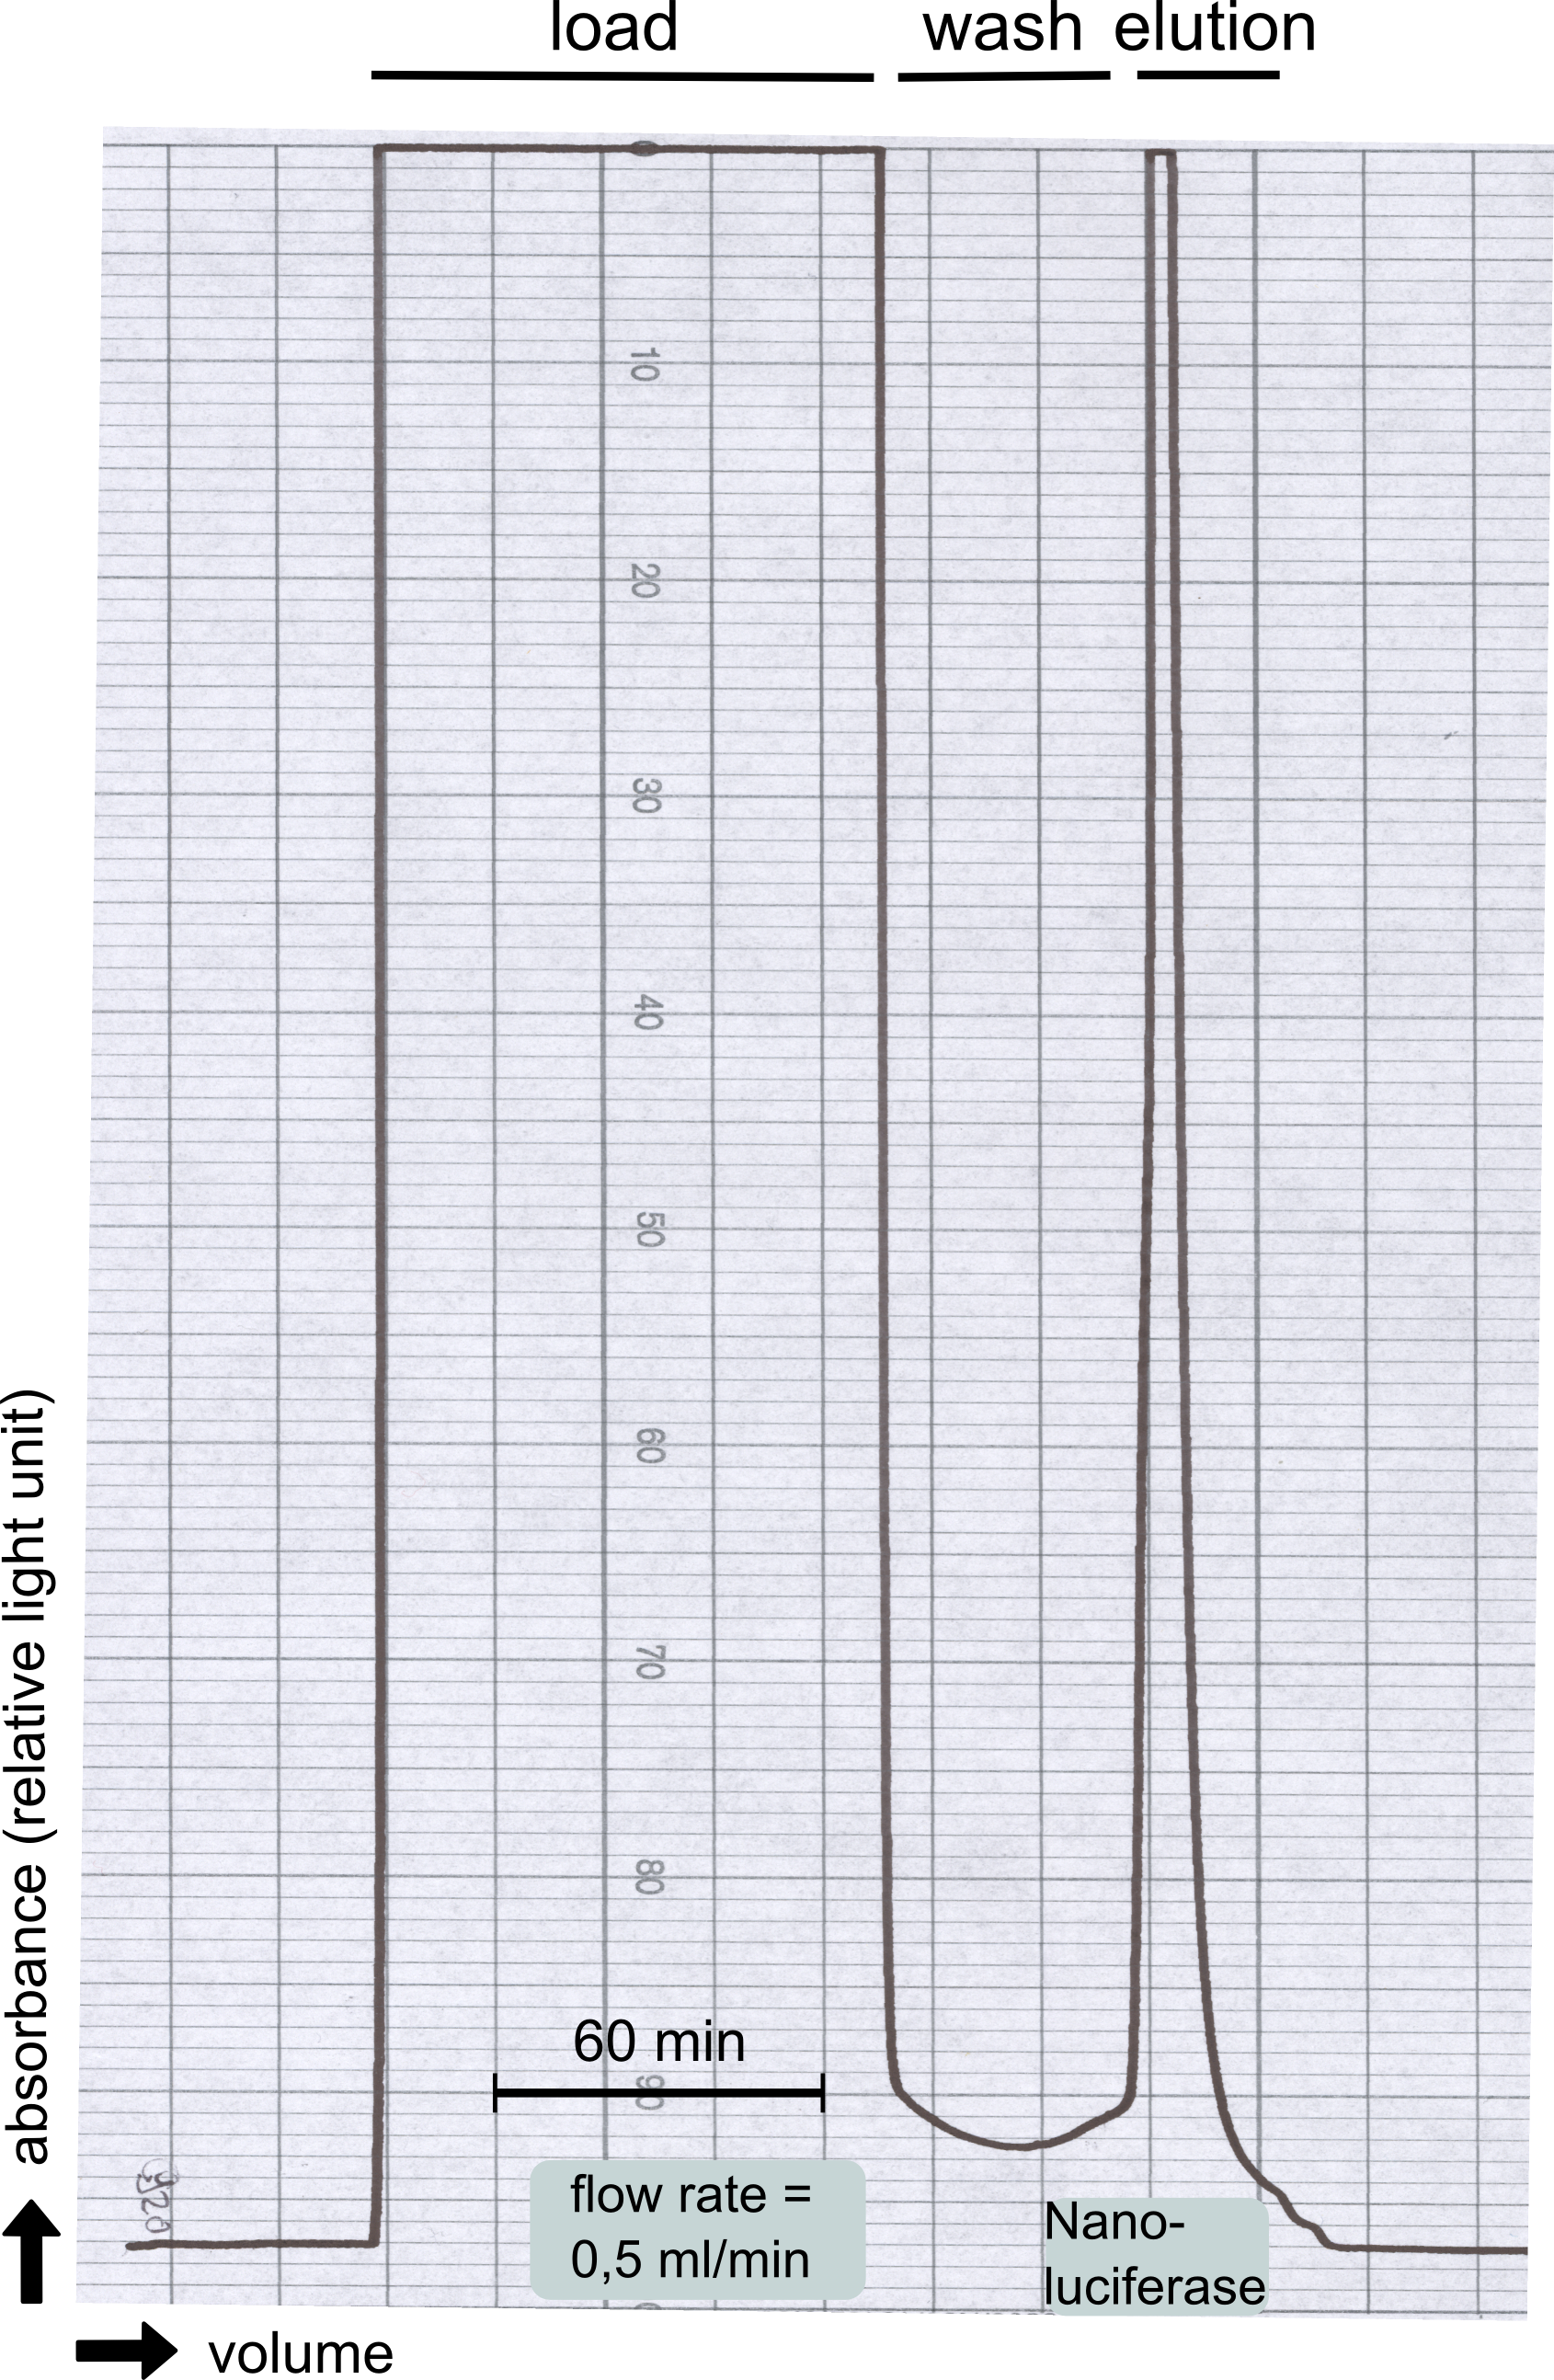
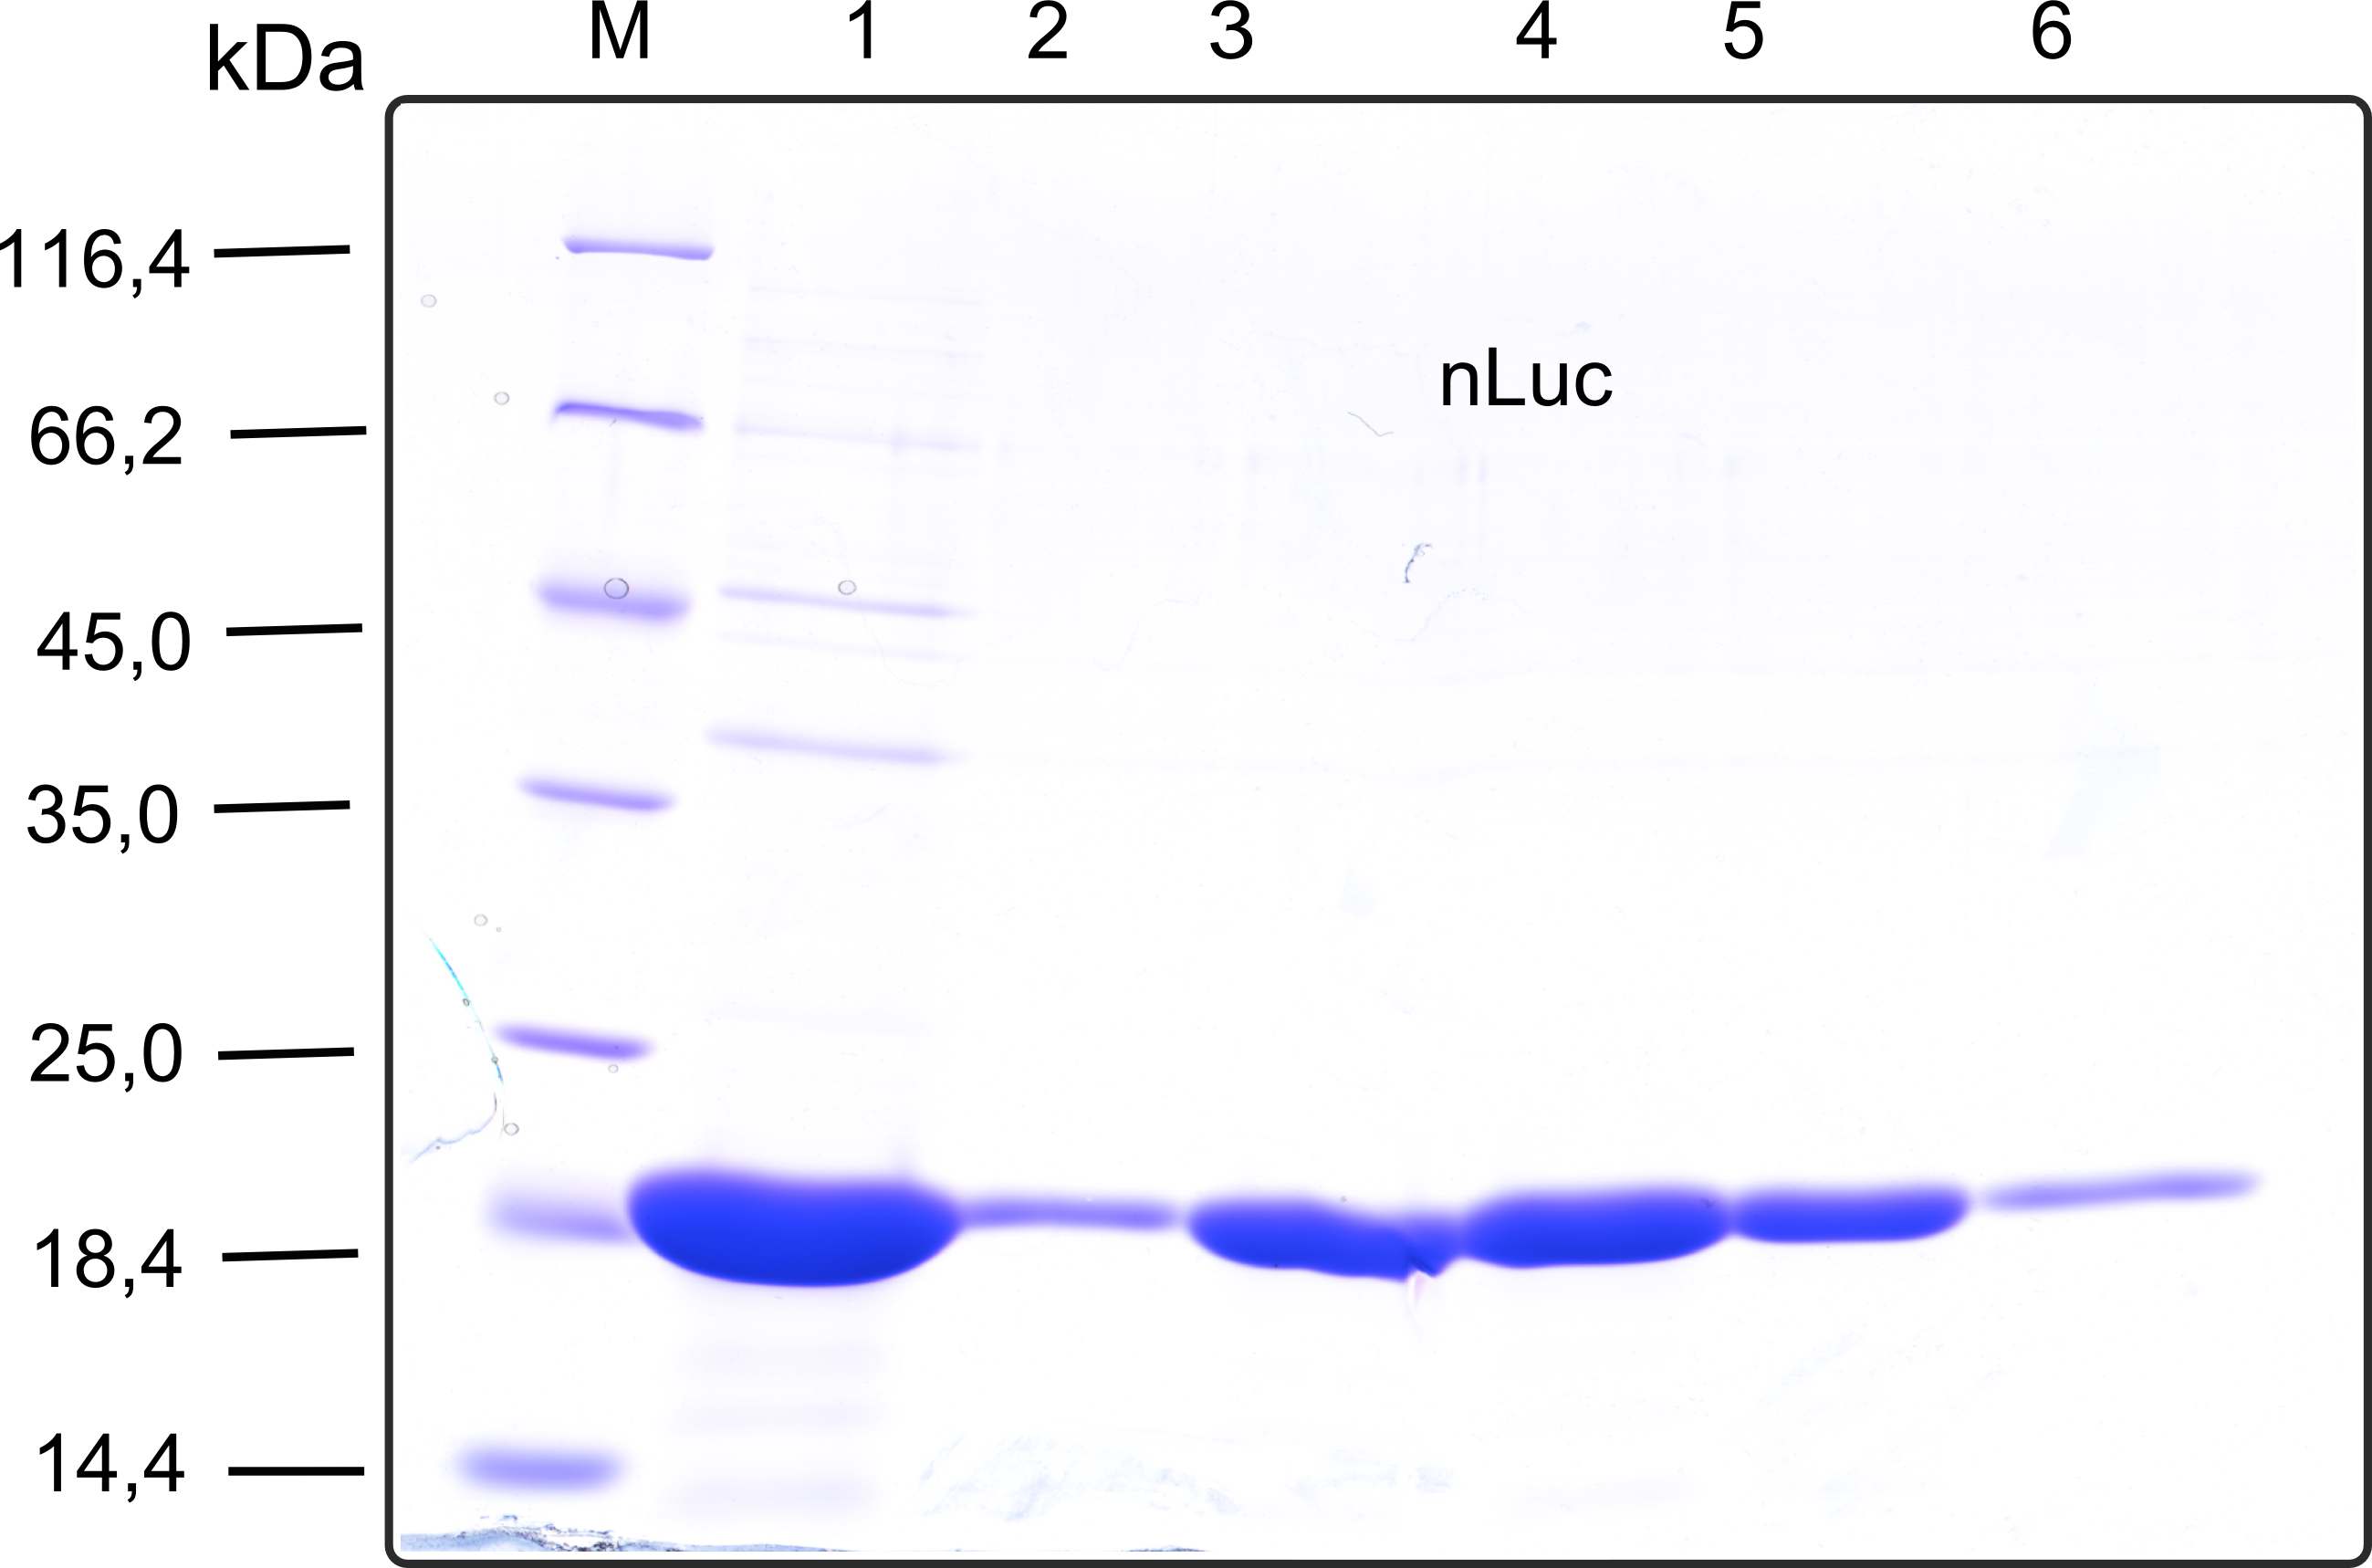
Therefore the NanoLuc was synthesized as a BioBrick in RFC[25] and was produced in E. coli using the pBad expression system with a C-terminal Strep-tag. After the production (2 l of LB-media for analytical and 12 l for preparative preparations) the cells were disrupted using sonification and the lysate was dialysed against 5 l of 1x SA-buffer. Afterwards the lysate was applied to a Streptavidin-Affinity (SA) column and was subsequently washed using SA-Buffer until a baseline was reached and the protein was then eluted using 5 mM of biotin (Attention: These are special columns which are not availible commercially. If you are using commercial colum material you have to use d-Desthiobiotin because usual biotin will elute your protein but you will not be able to regenerate the column after your chromatography). After the SA-chromatography the protein was concentrated using centrifugal concentration units (MWCO: 10 kDa). The concentrated protein was then applied onto a Superdex S200/75 size exclusion chromatography. The chromatogram of both preparations show a single peak in the chromatogram which elutes at an expected elution volume of 15 ml. The absence of any notable aggregation peak shows the high stability of this protein and the ease of production.
Structure of the Nano Luciferase
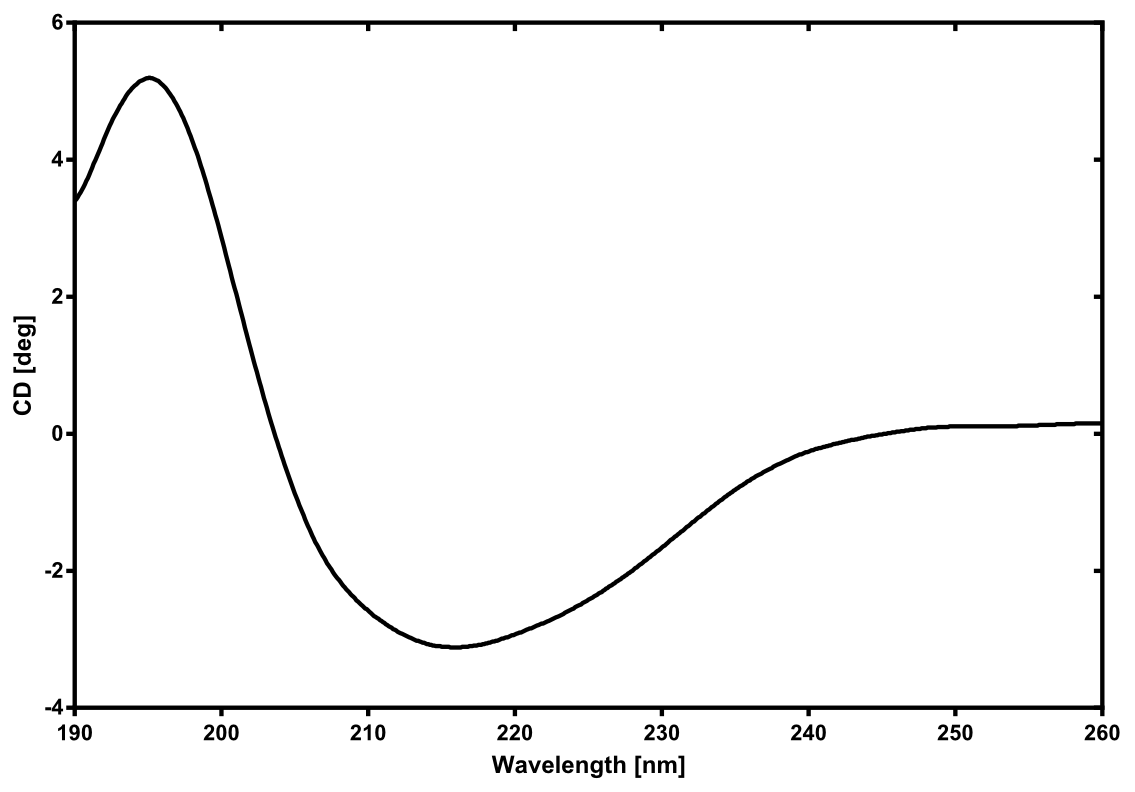
There is no structure available for the [http://parts.igem.org/Part:BBa_K1159001 NanoLuc Luciferase] in the [http://www.rcsb.org/pdb/home/home.do Protein Data Bank]. In our protein modelling we used homolgy search and identified the structure [http://www.rcsb.org/pdb/explore/explore.do?structureId=3PPT 3ppt_A] as the solved structure with the highest homology to the NanoLuc which has only 21% identity with a similarity of only 0.359. The result of the homology search is shown as annimated gif in Figure 21 (please see our How To for an introduction). The protein was dialysed against 1x CD-buffer and subsequently a circular dichroism spectroscopy was taken (learn about CD spectroscopy). The CD spectrum was used to predict the secondary structure content of the NanoLuc which could be determined to 35.1% helix, 27.6% b-strand, 18.5% turn and 18.8% random. As there is only a poor homology present, a detailed comparison of the determined and the predicted secondary structure is not possible. But it can be stated that both show a balanced content of different secondary structures and that the produced protein is present in a folded conformation. The mixed secondary structure content is also in consistance with the predicted secondary structure shown in the AutoAnnotator sequence window ([http://parts.igem.org/Part:BBa_K1159001 click here]).
Activity determination of Luminescense
The activity of the produced NanoLuc was investigated by its luminescense. The assay was performed in white 96-well plates (Nund) and the bioluminescense was determined at 460 nm in a BioTeK II plate reader for 1 sec per well. For every reaction 50 µl of the NanoGlow substrate (sponsored by Promega) was mixed with 50 µl of the NanoLuc preparation. In a first experiment a dilution series of the NanoLuc was performed in order to find the apropriate dilution of the enzyme (data not shown). Finally the 1:100 000 dilution was used for all experiments as it resulted in intermediate luminescense values within the dynamic range of the plate reader.
The dependency of the luminescense reaction on the pH value of the buffer was assayed by an experiment in which the NanoGlow substrate was diluted in water instead of the provided buffer and the pH was adapted by 100 µl of 500 mM buffers. The resulting luminescense is shown in Figure 23 and shows a clear optimum around pH 8.0 to 8.5. A luminescense value of more than 50% can be expected for pH values between 6 and 9 which is sufficient for most assays.
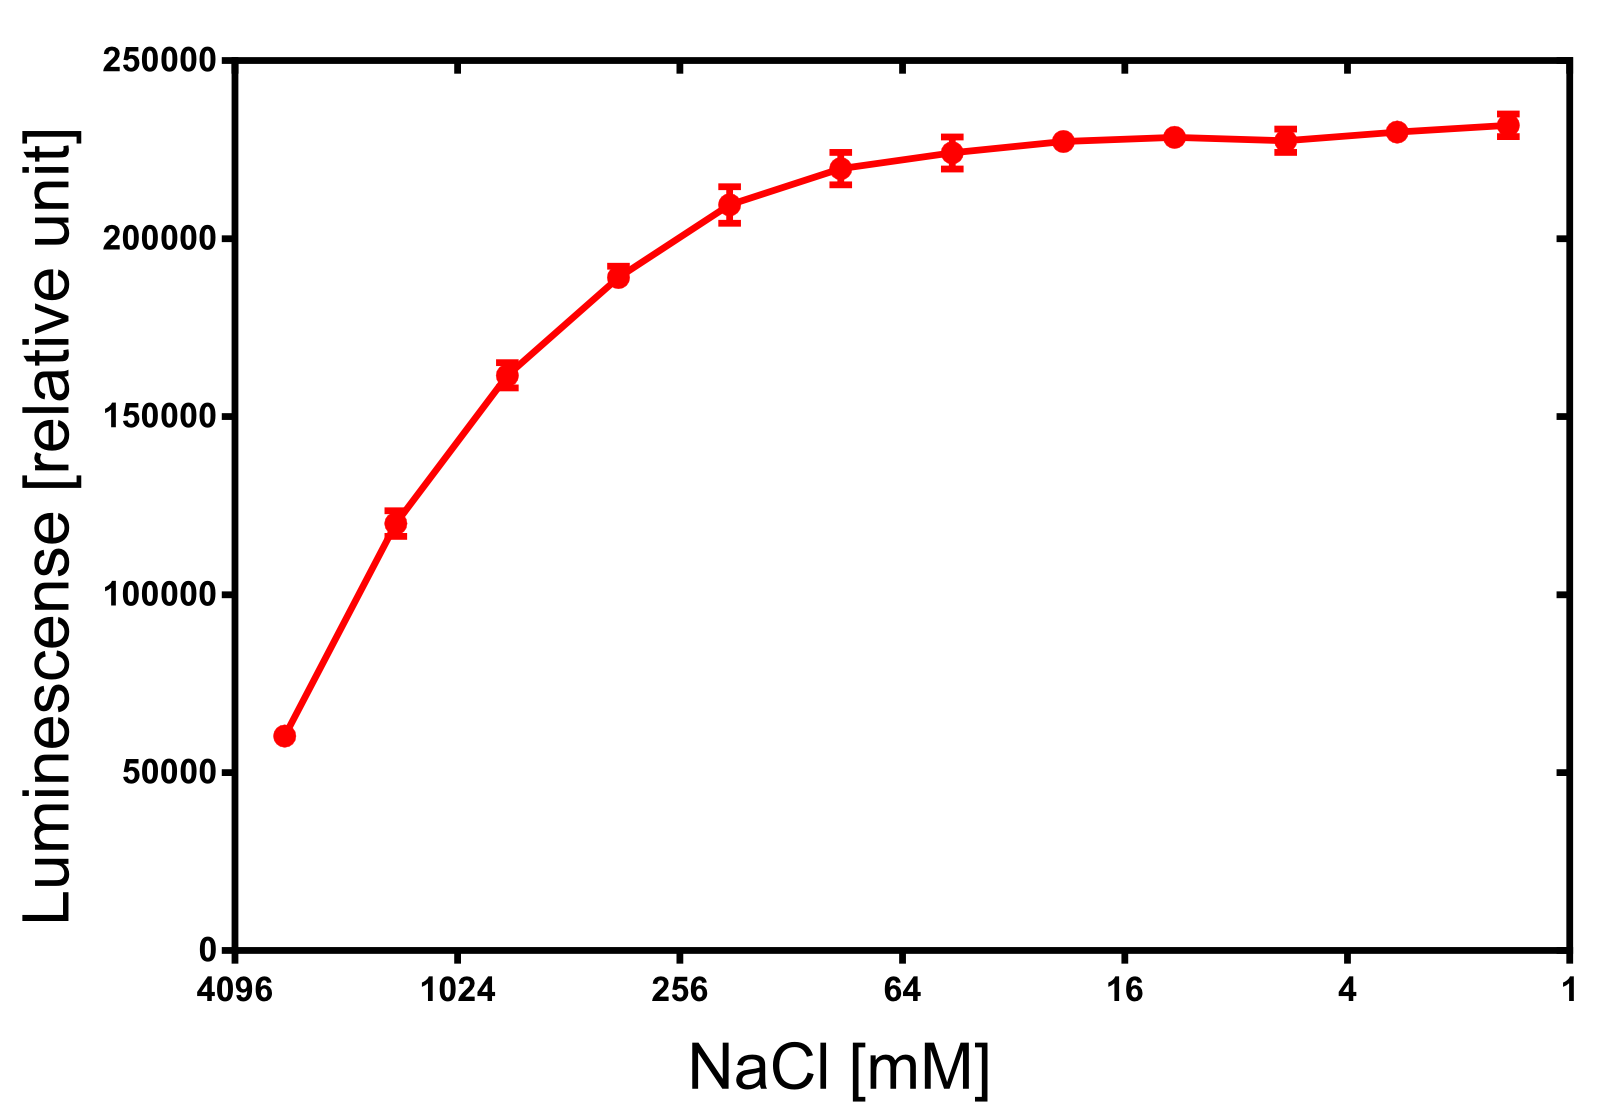
For the dependency of the luminescence on the ionic strength 50 µl of diluted NanoLuc, 50 µl of NanoGlow substrate and 100 µl of sodium chloride dilution series were incubated and afterwards the luminescense was quantified in triplicates. The result is impressing and again speaks for the NanoLuc luciferase as an innovative reporter protein. The obtained luminescense is constant from 0 to 250 mM of NaCl and upon 1 M of NaCl at least 50% of the maximal luminescense can be expected.
Catechol Dioxigenase (XylE)
The catechol dioxigenase (<partinfo>BBa_K648011</partinfo>) is a BioBrick which was characterized by the Imperial College 2010 iGEM team. As we also want to use this BioBrick we produced it as a recombinant protein. Given the fact that previous teams did a great job in characterizing this proteins kinetic parameters we decided to focus on other aspects. Catecholdioxygenases are a wide variety of enzymes degrading catechol and various of its derivatives. The xylE gene we use is from Pseudomonas putida and has a ferrous ion ligand in each subunit. The enzyme has the structure of a homotetramer
Analytical preparation
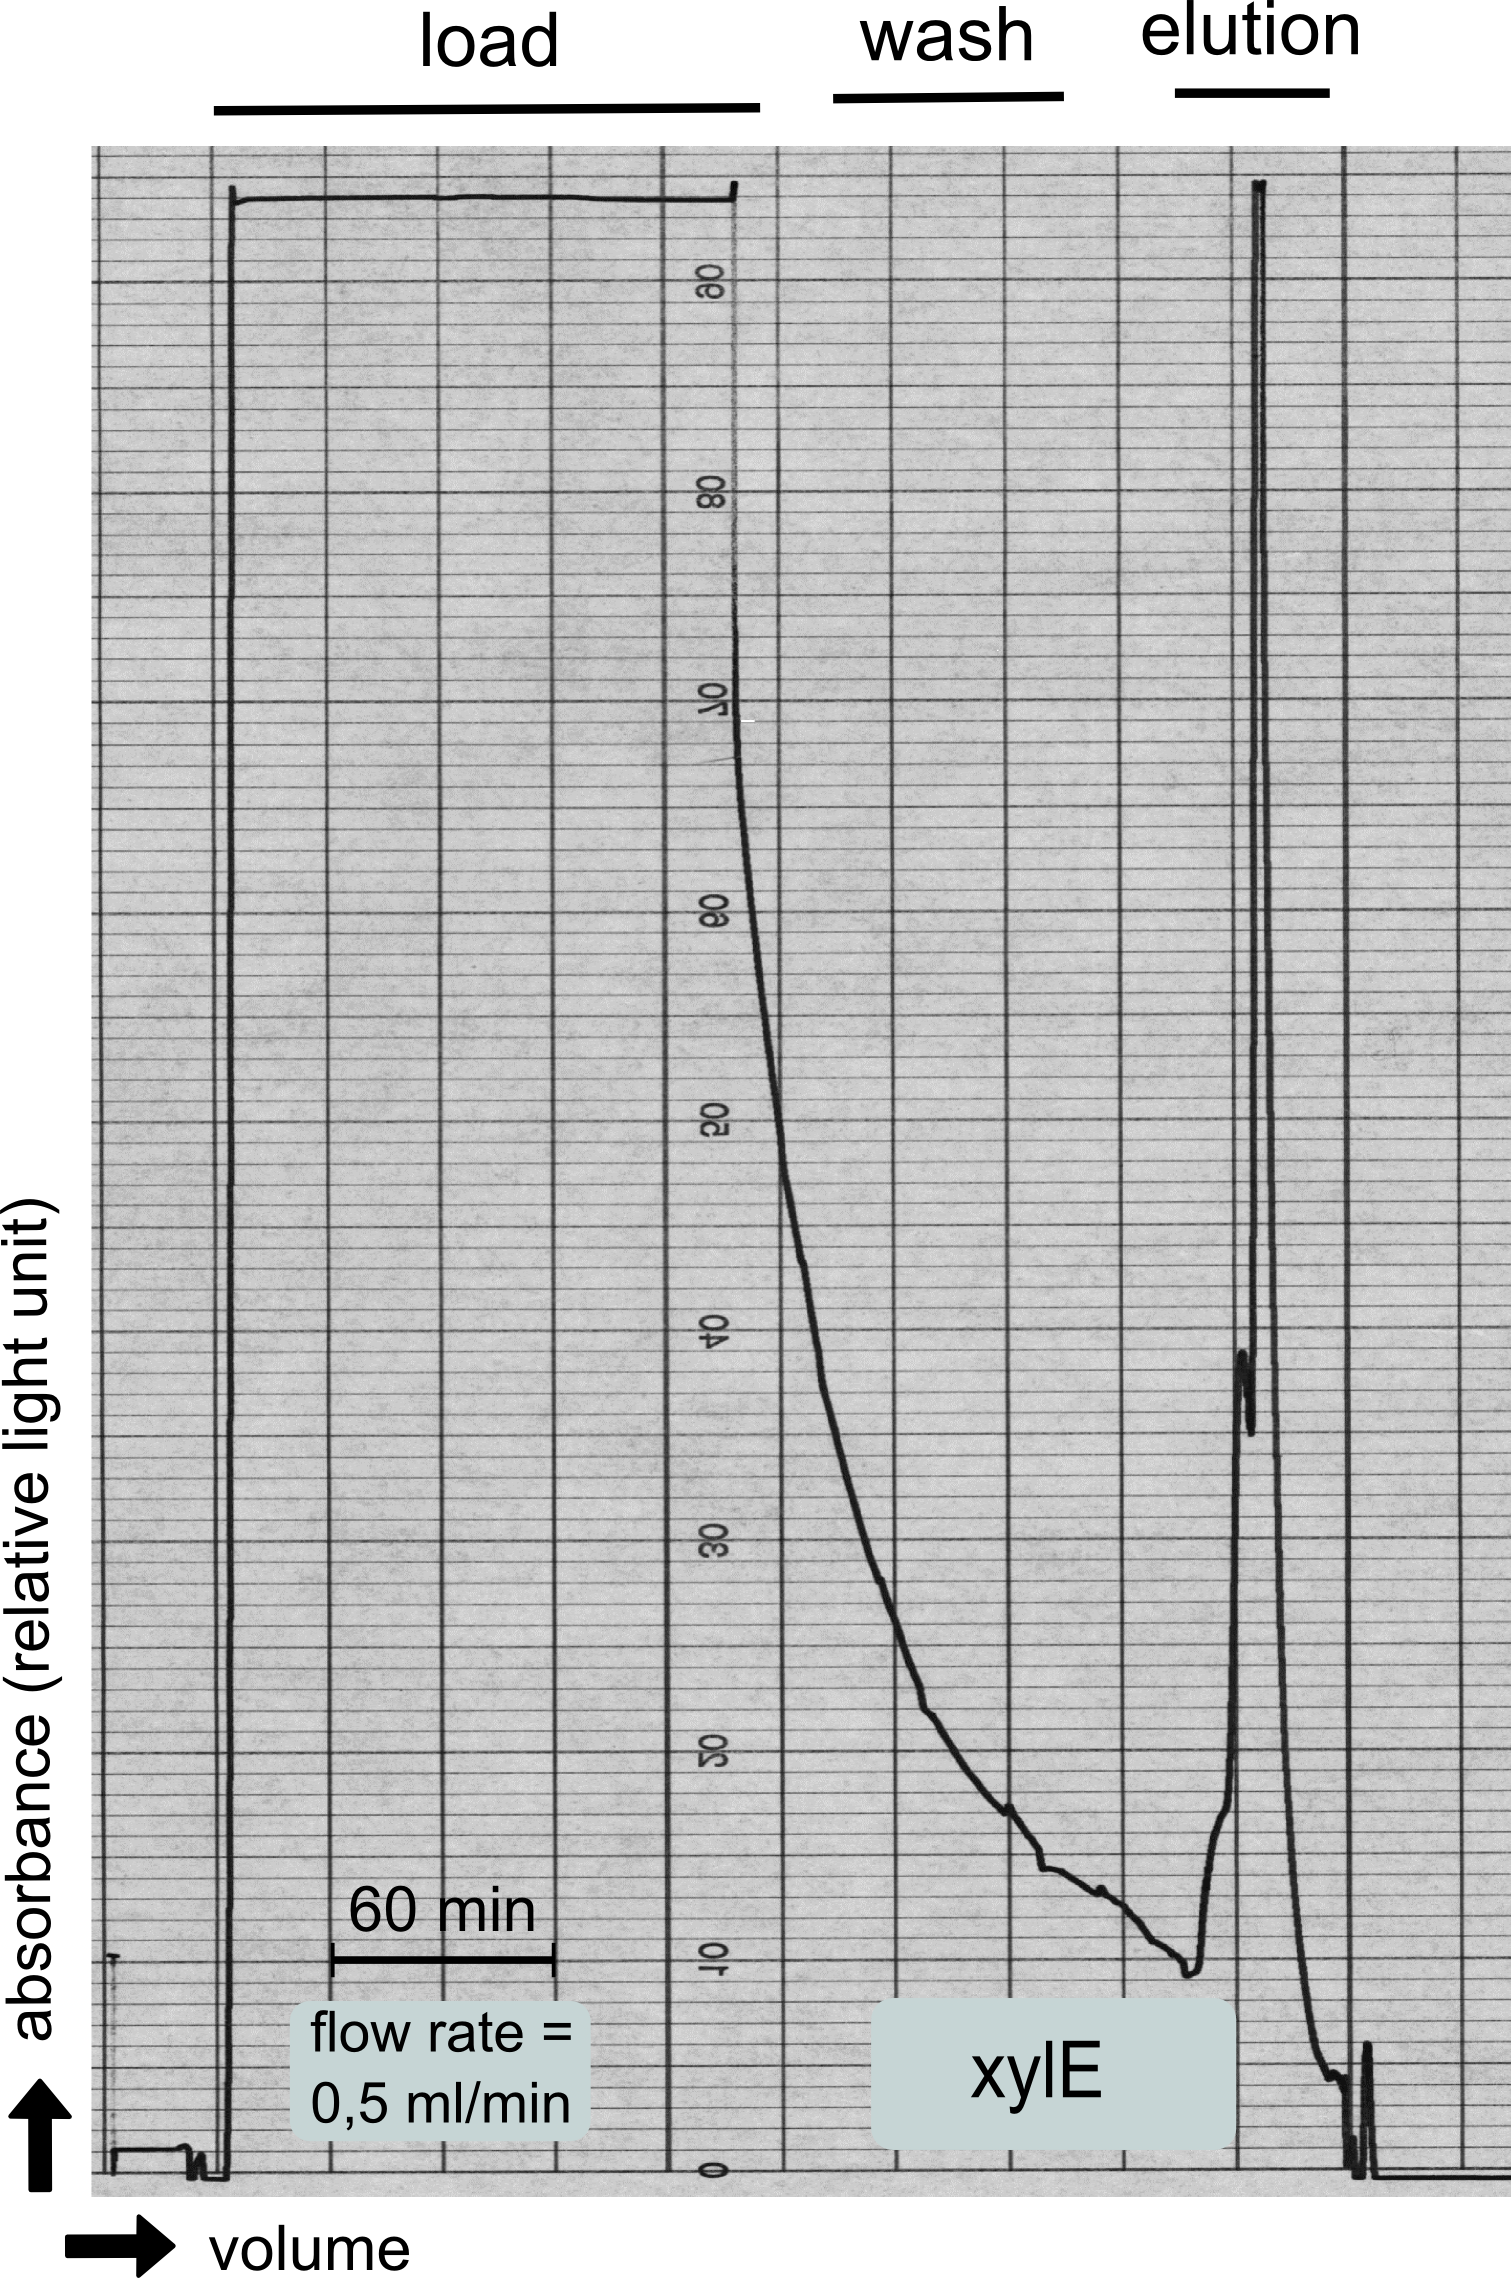
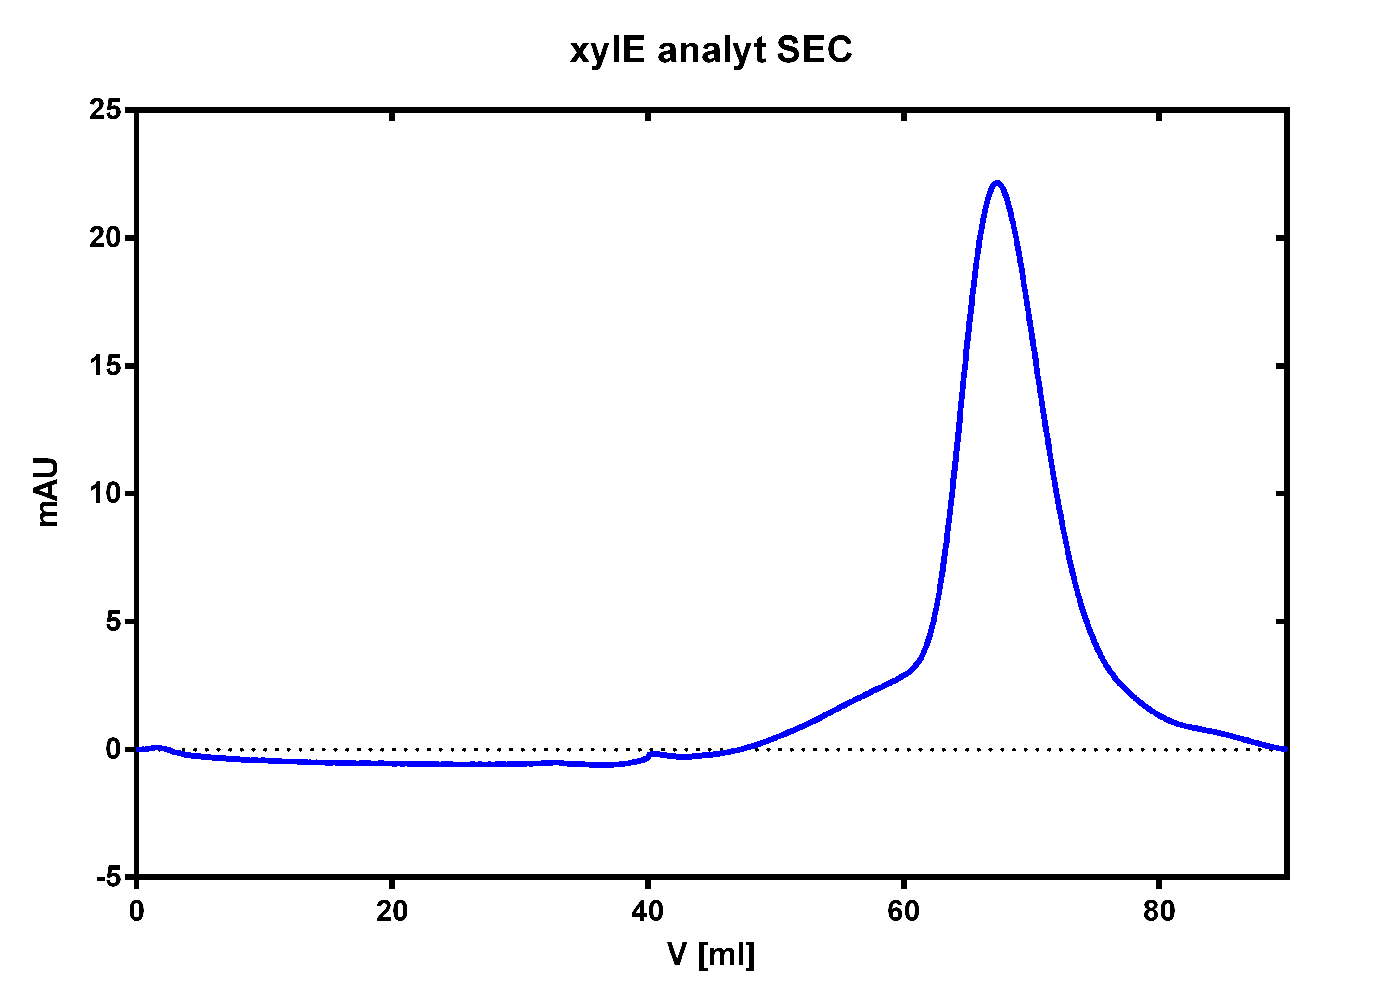
To investigate if our recombinant BL21 E.coli cells were producing the catecholdioxygenase we started with an analytical preparation in 2 l LB-medium. After we confirmed the succesful transformation of our cells we produced another 2 x 2 l flasks full of recombinant cells in order to have enough enzyme to work with. To induce protein production we used 5 mM of arabinose when we measured an OD of 0.8. We disrupted the cells by sonification and after dialysis in 1 x SA-buffer we performed streptavidin affinity chromatography. After elution of the desired protein in 1 x SA-buffer with 5 mM 2-mercaptoethanol and 10% glycerol we concentrated it using a centrifugal filter unit (MWCO: 30 kDa). The concentrated protein was then applied to a ÄKTA purifier equipped with a Superdex 75 16/60 size exclusion chromatography column. As seen in the figure below the protein was eluted without any aggregation products and was ready to use.
Protein phosphatase 1 (from Homo sapiens)
The production of recombinant protein phosphatase 1 was part of our collaboration with Dundee iGEM team 2013. They developed this BioBrick which naturally binds [http://de.wikipedia.org/wiki/Microcystine microcystine], an important environmental toxin.
Production and purification of recombinant PP1 protein
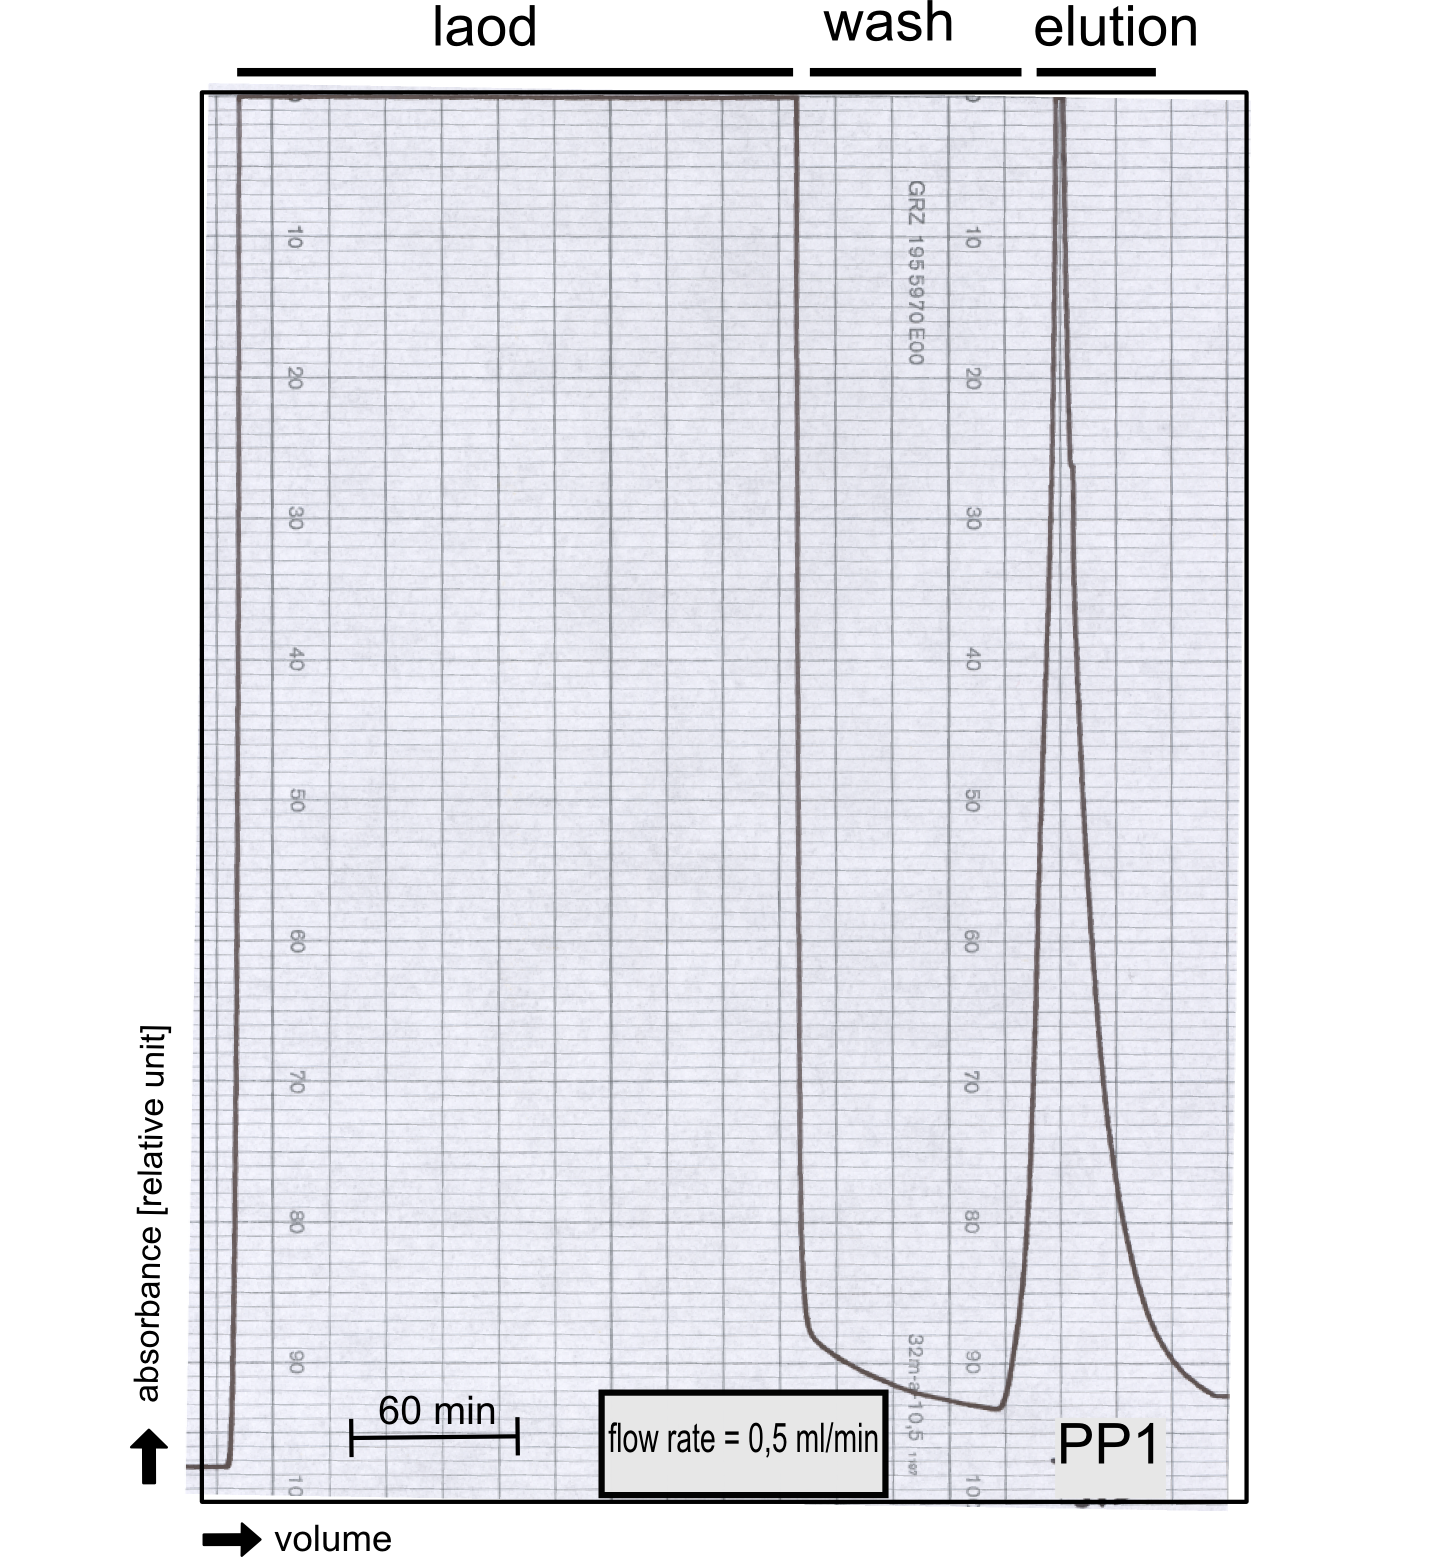
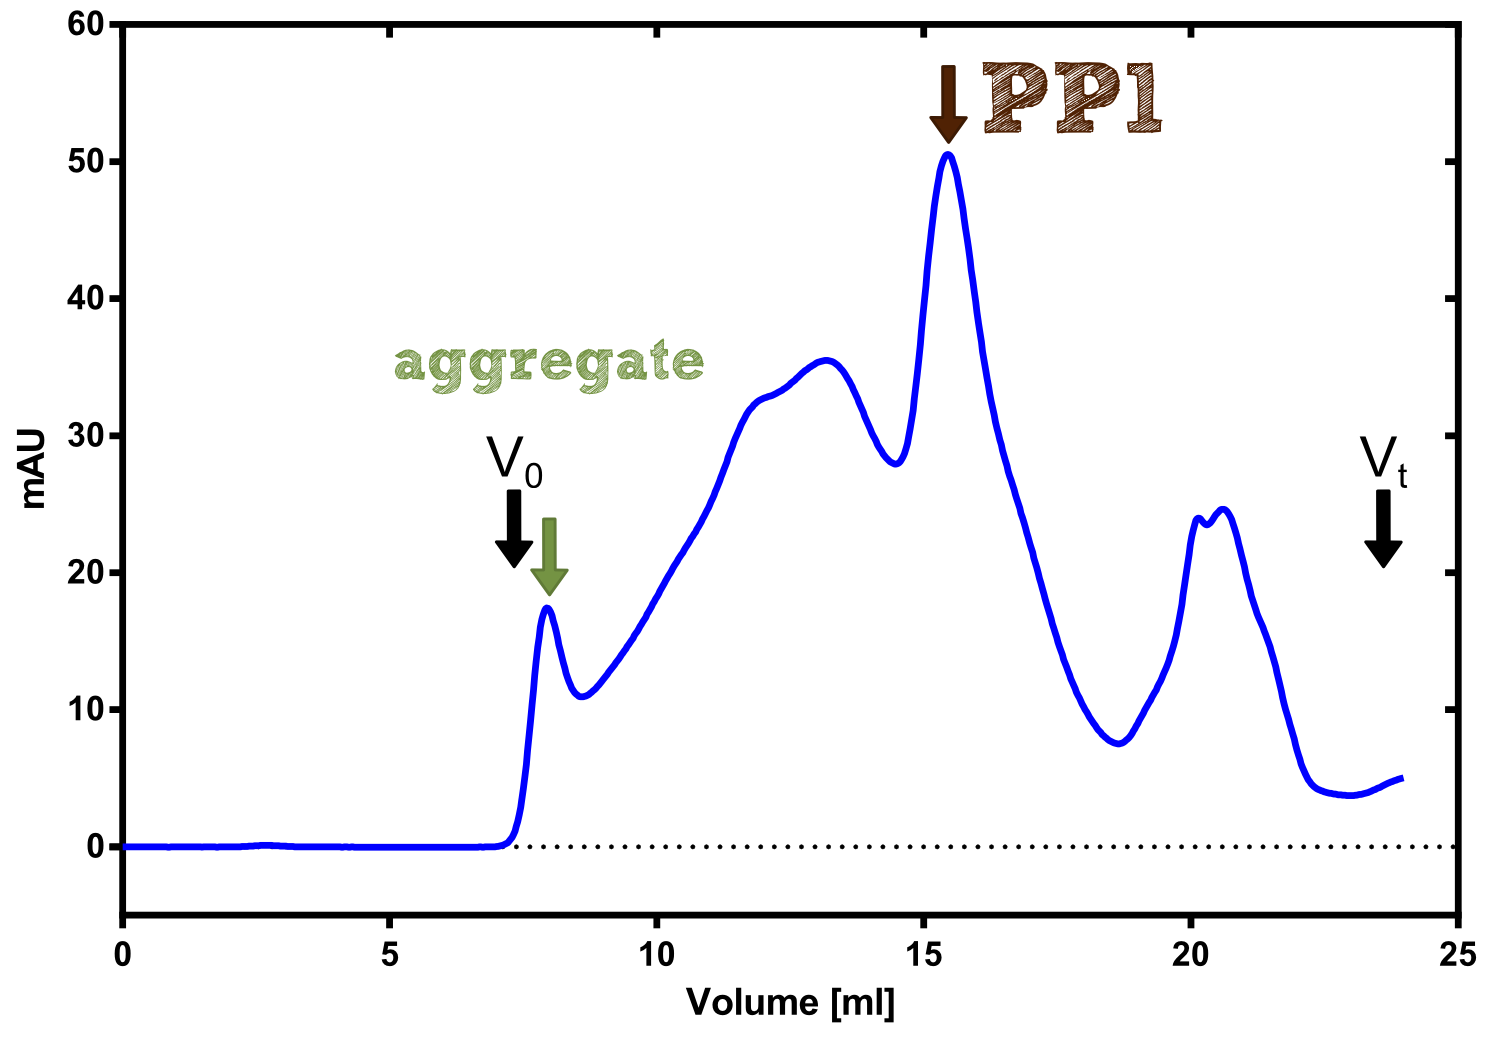
We converted this BioBrick to RFC[25] and subsequently cloned it into the expression vector pBad_C-terminal_Strep. Beside the recombinant characterisation we also created a transgenic moss transformed with a receptor containing PP1 in its extracellular domain. The recombinant protein production was carried out in E. coli BL-21 which was grown in 2 L of LB-media. The protein production was induced at OD = 0.8 by addition of arabinose to a concentration of 5 mM. The cells were harvested after 4 h and subsequently resuspended in 20 mL SA-buffer with 5 mM 2-mercapto ethanol. Cell disruption was performed using ultrasonic sound. The dialysed cell extracte was applied to a streptavidin affinity column which was washed until a base line was reached and was subsequently eluted using SA-buffer containing 5 mM of biotin and 5 mM of 2-mercapto ethanol. The elution peak recorded by the continuous measurement of the absorbance at 280 nm indicated a good yield of recombinant protein (Fig. A). As a second purification step after the streptavidin affinity chromatography we concentrated the protein in centrifugal filter units in order to apply it to a size exclusion chromatography. During the concentration process there were clear signal for precipitated protein which appeared as white flakes in the concentration filter unit. This effect was by far the most drastic precipitation of recombinant that was detected during this iGEM project. Anyhow the concentrated protein was centrifuged for 5 min at 13 200 RPM to remove particles of precipitated protein and was then applied to an ÄKTA purified with a Superdex 200 10/30 column (Fig. B). There were four different peaks present in the chromatogramm which most probably correspond to (1) a peak created by aggregated protein which runs in the voit volume of the size exclusion colum, (2) a diffuse peak which might correspond to multimeric PP1, (3) a sharp peak at the elution volume where the recombinant PP1 was expected and (4) a peak which is most probably caused by low molecular buffer substances. The general signal intensity obtained in the size exclusion was very low indicating low protein concentrations. The maximal peak obtained for PP1 had an absorbance of 50 milli Absorption Units whereas this was for example for the NanoLuc in the range of 1000 for a comparable experiment. The fact that this protein does not tolerate the concentration procedure gibes an indication that it is fragile and tends to aggregation when stress is applied. Finally recombinant PP1 protein was prepared although the yield was very low compared with other effector proteins.
Possible reasons for the instability of PP1 in vitro
The high aggregation and denaturation tendency of the protein phosphatase 1 which was observed in the analytical preparation motivated this search for a possible explanation. As a first hint the amino acid composition calculated by the AutoAnnotator was examined and it can be seen that 13 cysteine residues are present in the sequence of the protein phosphatase. This corresponds to 4% of the total number of amino acid residues comapred to 2.8% cystein residues in average protein. This information taken together with the molecular function of the protein phosphatase 1 clearly shows that this BioBrick is a cytoplasmatic protein which fulfills its function in the reducing milieu of the cytoplasm and tends to aggregation when exposed to an oxidizing milieu such a the periplasm of E. coli for example.
Secondly the amino acid sequence produced by the AutoAnnotator was fed into the bioinformatic tool [http://web.expasy.org/cgi-bin/protparam/protparam ProtParam which has a stability prediction for proteins. The result was: "The instability index (II) is computed to be 42.99 - This classifies the protein as unstable."
Taken both these indications into account it still seems a good idea to express the protein phosphatase 1 cytoplasmatically to bind microcystine but it is not advisable to think about a secreted version of PP1 as the protein seems to unstable for this application.
DDT-Dehydrochlorinase
The DDT dehydrochlorinase (<partinfo>BBa_K620000</partinfo>) BioBrick is designed in RFC[10] by Caltech 2011 iGEM team and as a localisation of this effector outside the cytoplasm is not advisable we did not improve this BioBrick to RFC[25]. The DDT dehydrochlorinase is dependent on the continuous supply of glutathione which is conjugates to xenobiotics in order to inactivate them. The disadvantage of an RFC[10] BioBrick is that it can not be fused to an affinity tag which can subsequently be used to purify the protein after its recombinant production.
Beside the experiments already performed in iGEM we found monochlorobimane to be an interesting assay for experiments in bioremeditation. This commercially availible substrate can be conjugated to glutathione. The conjugation of monochlorobimane can be followed by the fluorescense of the conjugation product (excitation: 380 nm / emission: 461 nm). We tryed this assay assay with transgenic plants but could not see results as the autofluorescense of the photosystem in Physcomitrell was too strong in order to see the emergence of the fluorescense caused by the conjugation product.
SpyCatcher & SpyTag
The SpyTag and SpyCatcher System allows the production of seperate proteins which become linked over their side chains. This kind of post translational protein fusion enables the iGEM community to design pretty complex systems. For our project the SpyTag system was integrated to secrete effector proteins coupled to the SpyTag that become automatically fused to a membrane receptor having a SpyCatcher domain at its extracellular domain. With this system it would be possible to create plants which have several different effector proteins immobilized on their membrane. For more information on this exciting new tool please see our
We also want to show the posttranslational protein fusion in vitro. For this reason we started to produce these Protein recombinantly in E. coli. As one of the proteins is linked to the NanoLuc which we characterized in a previous section we will be able to determine the kinetics of this coupling reaction. Until the regional Jamboree we finished cloning of all required plasmids but did not yet produce and purify the required proteins.
CFP_TEV-site_YFP
Protein Data Table for CFP_TEV-site_YFP [http://parts.igem.org/Part:BBa_K1159112 BBa_K1159112]
To prove that our light-switchable TEV Protease is actually working, we designed a FRET reporter ([http://parts.igem.org/Part:BBa_K1159112 BBa_K1159112]). The FRET reporter is composed of two chromoproteins, namely eCFP ([http://parts.igem.org/Part:BBa_K1159302 BBa_K1159302]) and SYFP2 ([http://parts.igem.org/Part:BBa_K1159301 BBa_K1159301]), which are linked together through a short linker with an internal TEV cleavage site ([http://parts.igem.org/Part:BBa_K1159318 BBa_K1159318]). For further information see the kill-switch section.
References:
http://udel.edu/~gshriver/pdf/Pimenteletal1997.pdf Pmentel et al., 1997 Pimentel, D., Wilson, C., McCullum, C., Huang, R., Dwen, P., Flack, J. Tran, Q., Saltman, T., Cliff, T. (1997). Economic and environmental benefits of biodiversity. BioScience, Vol. 47, No. 11., pp. 747-757.
 "
"












AutoAnnotator:
Follow us:
Address:
iGEM Team TU-Munich
Emil-Erlenmeyer-Forum 5
85354 Freising, Germany
Email: igem@wzw.tum.de
Phone: +49 8161 71-4351