Team:NYMU-Taipei/Modeling/Ethanol
From 2013.igem.org


Contents |
Ethanol model
Background
TrxC promoter is an oxyR-activated promoter. Behind trxC promoter are several terminals to inhibit T7 polymerase-producing gene from being opened easily ; namely, it will not open until the concentration of oxyR is high enough, which means the bees are facing disastrous infection. Once oxyR concentration overcomes the threshold and conquers the terminal obstacles, T7 polymerase is produced and will bind to T7 promoter, which is a specific promoter binding only to T7 polymerase. Behind the T7promoter are enzyme PDC and ADH-producing genes, which will convert pyruvate to ethanol, and thus kill spores of Nosema Ceranae.
Pathway of ethanol

PDC= pyruvate decarboxylase; ADH= Acetaldehyde
Objectives
- To simulate how many terminal do we need as a threshold to have the T7 polymerase-producing gene open at a proper time.
- To simulate the threshold concentration of oxyR to conquer the terminal.
- To determine the time of opening to see if the circuit could open in time (useful).
System
It is assumed that the dose of pyruvate is sufficient in bees’ body through enough proliferation/copy number of Beecoli; the possibility of RNApolymerase skipping terminators is assumed to be proportional to time span; equilibrium between pyruvate and acetaldehyde is dominantly rightward, while equilibrium between acetaldehyde and ethanol is bidirectional; concentration of ethanol will not easily decrease and will sustain for a period of time.
As for how we measure promoter strengths, we choose PoPS, which is the rate of RNA polymerase binding to the DNA and trigger the transcription of the certain gene.
Equation1
- KdROSoxyR = dissociation constant of ROSoxyR
- n ROSoxyR = Hill coefficient of ROSoxyR
- PoPStrxC = promoter strength of trxC
- KdT7 = dissociation constant of T7
- NT7 = Hill coefficient of T7
- PoPST7 = promoter strength of T7 promoter
- KdegmRNA = degrading constant of sensor promoter mRNA
- N = number of plasmid in a single cell
- V = volume of a cell
Equation2
- PoPStrxC = promotor strength of trxC promoter
- PoPST7 = promoter strength of T7 promoter
- RBS = binding site strength
- kdegT7 = degrading constant of T7 polymerase
- a = posibility of conquering the threshold concentration
- n1 = Hill coefficient of ROSoxyR (complex of ROS+oxyR)
- N = number of plasmid in a single cell
- V = volume of a cell
The aim of the equation is to know the threshold concentration of oxyR to conquer the terminal and when T7 polymerase can reach the required concentration to activate T7 promoter.
Equation3
- KdT7 = dissociation constant of T7
- NT7 = Hill coefficient of T7
- PoPST7 = promoter strength of T7 promoter
- KdegmRNA = degrading constant of sensor promoter mRNA
- N = number of plasmid in a single cell
- V = volume of a cell
The aim of the equation is to know mRNA of enzyme PDC production rate and when it can reach the level to translate enough PDC.
Equation4
- RBS = binding site strength
- PoPST7 = promoter strength of T7 promoter
- N = number of plasmid in a single cell
- V = volume of a cell
- KdegPDC = degrading constant of PDC (pyruvate decarboxylase)
The aim of the equation is to know PDC production rate and when it can reach the concentration of ethanol pathway equilibrium.
Equation5
- KdT7 = dissociation constant of T7
- NT7 = Hill coefficient of T7
- PoPST7 = promoter strength of T7 promoter
- KdegmRNA = degrading constant of sensor promoter mRNA
- N = number of plasmid in a single cell
- V = volume of a cell
Equation6
- RBS = binding site strength
- PoPST7 = promoter strength of T7 promoter
- N = number of plasmid in a single cell
- V = volume of a cell
- KdegADH = degrading constant of ADH (Acetaldehyde)
The aim of the equation is to know ADH production rate and when it can reach the concentration of ethanol pathway equilibrium.
Equation7
- Kpyruvateacetaldehyde = pyruvate→acetaldehyde reaction rate constant
- Kacetaldehydeethanol = acetaldehyde→ethanol reaction rate constant
- Km = ethanol→acetaldehyde reaction rate constant
- KdADH = dissociation constant of ADH
The aim of the equation is to know ethanol production rate and when it can reach the concentration to kill the spores of Nosema Ceranae.
Results
Figure1:this figure shows that after adding several terminators and T7 polymerase mechanism, we successfully build a time delay as well as a boom of PDC and ADH enzymes to attain our goal-ethanol production can reach its effective concentration(0.0005M) after 80 hours of Nosema infection.
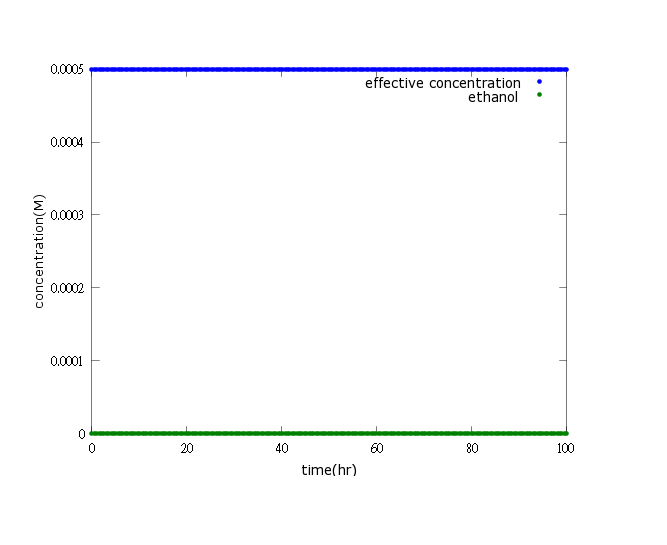
Figure2:This picture is a control group model. It shows that without Nosema infection (ROS concentration=0), ethanol production is low enough to be ignored. As a result, the bee will not be harmed by ethanol.
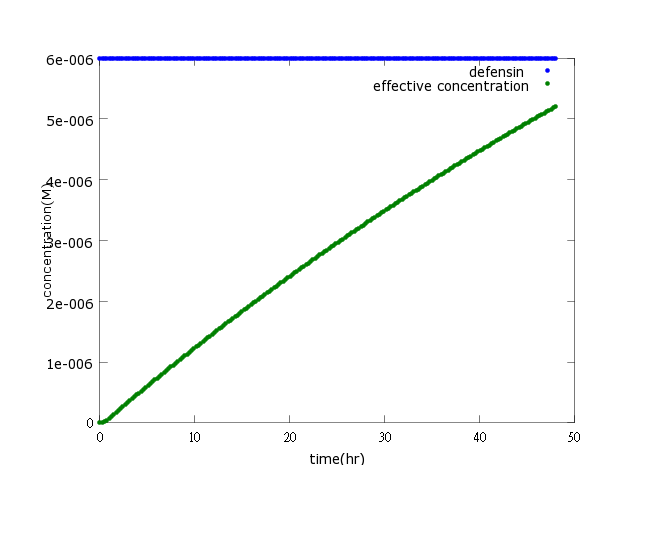
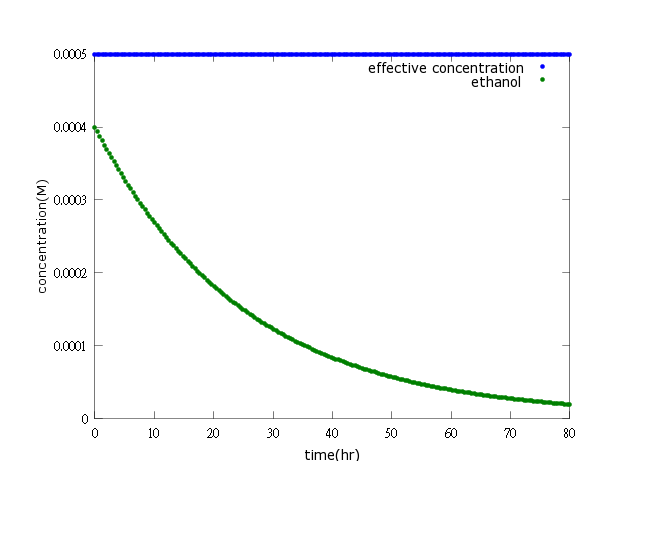
Figure3: ethanol production turning off after Nosema is killed (step 1)
Figure4: ethanol production turning off after Nosema is killed (step 2)
Figure3, Figure4: The two pictures above show that if Nosema is killed by defensin (kill protein) effectively, the ethanol production will soon be turned off (will not reach the effective concentration and decrease to a neglectable low level).
Discussion
Figures show that after sensor AhpCp is activated, ethanol reaches its effective concentration 72-80 hours after the infection, which is the time in Nosema lifecycle when bees carrying Nosema spores become incurable and infectious to other bees), In other words, this means if killing protein targeting at Nosema wasn't produced or functioning properly (click here to see the previous model for killing protein), Beecoli turns against the sick bee to kill it within 3-4days.
To make ethanol production on time, we adjusted the expression level of OxyR (click here for more information), the terminators in front of the desired gene, and the promoter strength for independent production of PDC and ADH(click here for detailed information about circuit design).
Circuit Design and Improvements
To postpone ethanol production until it is needed, we adjusted the terminators’ effect in terms of possibility (click here to see the ODE). Results show that there’s a short lag (8-10 hours) between invasion sensing and ethanol production rather than a long one expected. This means that possibility isn’t a sensitive parameter and therefore adding terminator is not an efficient way to manipulate timing when ethanol is produced. Nevertheless, these terminators still has the function of preventing leakage of T7 polymerase production (click here for detailed information about circuit design). By adjusting the parameters in the ODEs given, we found that the nature of T7 transcription is key to adjusting ethanol production time. If postponing ethanol production is needed, a T7 promoter with lower promoter strength and T7 polymerase with higher degrading rate should be chosen
Parameters
| Model | Parameter | Description | Value | Unit | Reference |
|---|---|---|---|---|---|
| Ethanol
| pyruvate | Initial concentration of pyruvate in MG1655 | 1.18 x 2 | g/L | Expression of pyruvate carboxylase enhances succinate production in Escherichia coli without affecting glucose uptake |
| nPDC | Hill coefficient of PDC | 2.1 | - | Purification, characterization and cDNA sequencing of pyruvate decarboxylase Zygosaccharomyces biporus | |
| nADH | Hill coefficient of ADH | at high pH values, 30◦C, n=1; at low temperature, n=3 | - | Evidence for co-operativity in coenzyme binding to tetrameric Sulfolobus
solfataricus alcohol dehydrogenase and its structural basis: fluorescence, kinetic and structural studies of the wild-type enzyme and non-co-operative N249Y mutant |
 "
"


