Team:Imperial College/Modelling PURdeg
From 2013.igem.org
Contents[hide] |
Polyurethane (PUR) Degradation Module
Introduction
Both efficiencies of Polyurethane (PUR) degradation and ethylene glycol production are important for the performance of MAPLE system. We built a mathematical and deterministic model based on MATLAB extension Simbiology for Polyurethane degradation. The model contains the kinetic property of degradation enzymes that is helpful for the design of assays. As we scaled up the initial concentrations of all substrates to meet the conditions for a bio-reactor, the model can provide preliminary simulations and predictions for the MAPLE system.
Design
Objective
Here are some specific objectives for the model to achieve:
1. The model should contain the gene expression model of the degradation enzymes because the enzyme concentration determines the rate of plastic degradation. In our case for PUR degradation, we used [http://parts.igem.org/Part:BBa_K206000 pBAD strong promoter K206000] for most enzymes. We built the gene expression model based on inducible pBAD promoter, which gene expression rate can be regulated by inducer concentration.
2. The model should show the efficiency of the enzyme secretion to the culture from the cells. It's also important because the enzyme concentration in the culture depends on it. Here we used pelB secretion tag for most enzymes in order to achieve a high efficiency.
3. The model basically predict how long will take to degrade a known concentration of soluble polyurethane. It is assumed that the enzyme in our assays has the same kinetic properties as the enzyme used in the literature. The model can suggest a suitable concentration of the plastic to use in order to get good results from the assays.
4. It is known that ethylene glycol is toxic to E.coli. However, it has no clear effect on the growth of our MG1655 strain when the concentration of ethylene glycol is below 200mM. Therefore, the model should suggest a safe range of PUR concentration to avoid a high concentration (>200mM) of ethylene glycol produced.
The Model
Polyurethane (PUR) degradation involves 5 different degradation enzymes:
| enzyme | source organism | biobrick | reference |
|---|---|---|---|
| EstCS2 | uncultured unknown bacterium (GU256649.1) | [http://parts.igem.org/Part:BBa_K1149002 BBa_K1149002] | [http://www.microbialcellfactories.com/content/10/1/41 Kang et.al 2011] |
| pueA | Pseudomonas chlororaphis | [http://parts.igem.org/Part:BBa_K1149003 BBa_K1149003] | [http://onlinelibrary.wiley.com/doi/10.1111/j.1574-6968.2000.tb09056.x/pdf Stern et al., 2000] |
| pueB | Pseudomonas chlororaphis | [http://parts.igem.org/Part:BBa_K1149004 BBa_K1149004] | [http://www.sciencedirect.com/science/article/pii/S0964830501000427 Howard et al., 2001] |
| pudA | Comamonas acidovorans | [http://parts.igem.org/Part:BBa_K1149005 BBa_K1149005] | [http://www.sciencedirect.com/science/article/pii/S0964830598000663 Allen et al. 1999] |
| pulA | Pseudomonas fluorescens | [http://parts.igem.org/Part:BBa_K1149006 BBa_K1149006] | [http://www.sciencedirect.com/science/article/pii/S0964830598000687 Vega et al., 1999] |
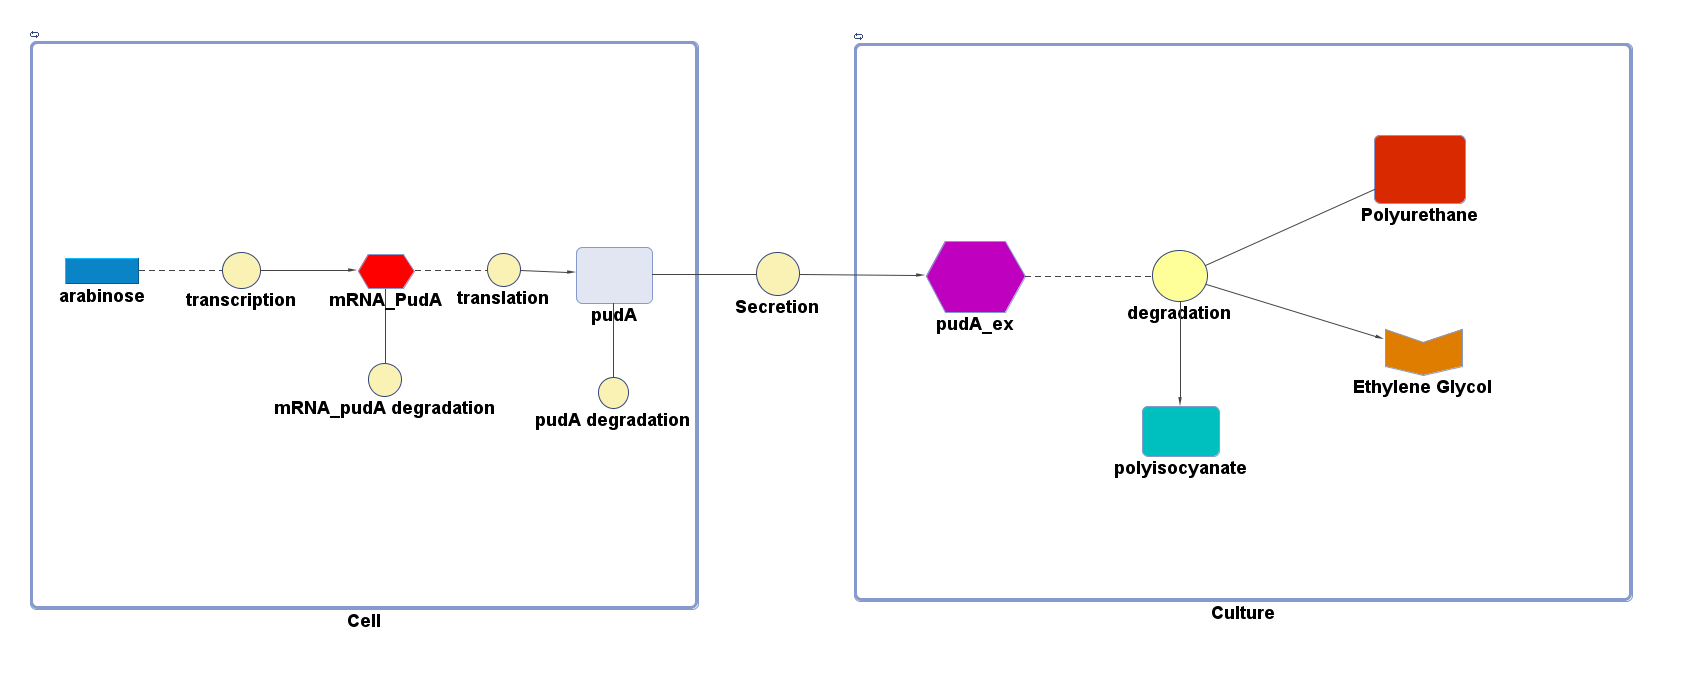
However, 4 of the 5 enzymes are not well characterised before, so we could't find enough kinetic data from the literature. The only well-characterised PUR degradation enzyme PudA is used in the model as an illustration of all PUR degradation enzymes. The model will be more complete when the kinetic data of the other enzymes are defined. The finished PUR degradation model is shown as below:
Key
There are two compartments which represents cells and the culture from left to right. The "cell" compartment contains the gene expression module whereas the "culture" compartment contains the degradation module. The "secretion" block that connects two compartments is the secretion module.
Parameters and assumptions
Gene expression module of PudA
| Parameter | Description | Value | Units | Sources | Assumptions |
|---|---|---|---|---|---|
| β | maximum rate of transcription | 0.032 | mM/min | Please see derivation 1 below. | Please see derivation 1 below. |
| K | Activation coefficient | 0.0031 | mM | [http://parts.igem.org/Part:BBa_K206000:Characterization] | Taking the "switch point" as the activation coefficient |
| dmRNA | mRNA degradation rate | 0.10 | 1/min | [http://www.ncbi.nlm.nih.gov/pmc/articles/PMC420366/pdf/07X.pdf] | Taking the value of mRNA half-life in E.coli strain MG1655 as 6.8min. rate = ln2/half-life = ln2/6.8 = 0.10 |
| dprotein | Protein degradation rate | 0.050 | 1/min | [http://jb.asm.org/content/189/23/8746.full] | There is no active degradation pathway and that dilution is the dominant way by which the protein level decreases in a cell. Rate = 1/doubling time, where doubling time = 20min. Assuming steady-state growth in LB broth as presented in paper. |
| k2 | Protein production rate (PudA) | 4.7 | 1/min | Please see derivation 2 below. | Please see derivation 2 below. |
| [Arabinose] | Concentration of arabinose | Initial: 0.008 | mM | ||
| [mRNA] | Concentration of mRNA | - | mM | - | - |
| [PudA] | Concentration of PudA | - | mM | - | - |
1.Derivation of the maximal expression rate,β
- Average molecular weight (Mw) of a base pair = 660g/mol[http://www.geneinfinity.org/sp/sp_dnaprop.html][http://www.lifetechnologies.com/uk/en/home/references/ambion-tech-support/rna-tools-and-calculators/dna-and-rna-molecular-weights-and-conversions.html]
- Average mass of a base pair = 660g/mol x 1.66x10-24 = 1.1x10⁻²¹g
- Volume of an E.coli cell = 1µm3[http://kirschner.med.harvard.edu/files/bionumbers/fundamentalBioNumbersHandout.pdf] = 1x10-15L
- BioBrick assembly plasmid pSB1C3 is a high copy number plasmid (100-300 copies per cell)[http://parts.igem.org/Part:pSB1C3?title=Part:pSB1C3]
- assume 200 copies per cell
- ∴ concentration of the gene per cell = N x 200 x 1.66x10-6mM, where N = number of base pairs
- ∴ concentration of the gene BDH2 (N = 768) in the volume of an E.coli cell is = 0.25mM
- Transcription rate in E.coli = 80bp/s[http://kirschner.med.harvard.edu/files/bionumbers/fundamentalBioNumbersHandout.pdf] = 80 x 1.66x10-6mM/s = 80 x 1.66x10-6 x 60mM/min = 7.97x10⁻³mM/min
- ∴ Rate of mRNA_BDH2 production under the control of pBAD = 7.97x10⁻³ ÷ 0.25 = 0.032/min
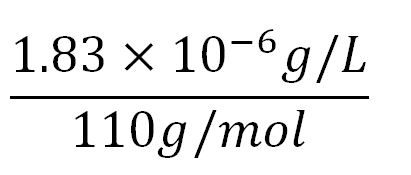
- Average molecular weight(Mw) of an amino acid(aa)= 110g/mol[http://www.genscript.com/conversion.html][http://www.promega.com/~/media/Files/Resources/Technical%20References/Amino%20Acid%20Abbreviations%20and%20Molecular%20Weights.pdf]
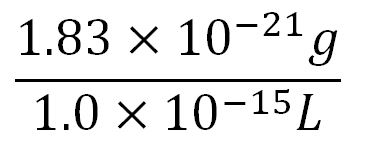
- Average mass of an amino acid = 110g/mol x 1.66x10-24=1.83x10⁻²²g/L
- Translation rate = 20aa/s = (20 x 1.66x10-5 x 60)mM/min = 0.020mM/min
- BDH2 comprises of 256aa[http://www.uniprot.org/uniprot/Q2PEN2&format=html]
- ∴concentration of BDH2's aa in the volume of an E.coli = 1.66x10-5mM x 256 = 4.25x10⁻³mM
- ∴ Rate of protein production = 0.020 ÷ 4.25x10-3 = 4.7/min
PUR degradation module
The reaction equation of the PUR degradation is:
[Polyurethane]+[PudA]= 5 [ethylene glycol] + 5 [polyisocyanate] + [PudA]
Assumptions:
We assumed 1 mole of polyurethane dispersion can produce 5 moles of ethylene glycol.
The molecular weight of a single Polyurethane monomer is 470 g/mol [http://www.polyurethanes.basf.de/pu/solutions/en/content/group/Arbeitsgebiete_und_Produkte/Grundprodukte/Lupraphen-Produktuebersicht_Gewicht]
Simulations and Results
 "
"


