Team:BYU Provo/Notebook/Cholera - Enzyme/September/Period2/Dailylog
From 2013.igem.org
| Cholera - Enzymes Notebook: September 15 - September 27 Daily Log
| |||||||||||||||||||||||||||||||||||||||||||||||||||||||||||||||||||||||||||||||
|
|
9/18/13 We transformed the DspB in the pet15b plasmid into the BL21 strain of competent E. Coli cells. We then set up overnights of Colony 1 of DspB/pIG91 and Colony 1 of AmyA/pIG91. We also set up overnights of V. cholerae in preparation for setting up and running our Enzyme Assay on Friday in order to test the enzymatic action of AmyA in breaking down V. cholerae biofilms. We will use various amounts of or purified AmyA protein with urea as a positive control and untreated biofilm as a negative control.
9/19/13 We ran plasmid preps for our DspB/pIG91 and AmyA/pIG91 overnights from yesterday using the plasmid prep protocol on the protocol page. The purified plasmids were labeled and placed in the freezer.
9/20/13 We revised our Enzyme Assay protocol today (see Enzyme Assay Revised on protocols page). Rather than growing our biofilms in the 96-well plate, we are going to grow them and run all the treatments in test tubes. In the 96-well plate we were seeing too much variation in growth conditions from the interior of the plate to the exterior as the wells have different air flows and evaporation rates. We will set up our assay to test AmyA enzymatic degradation of V. cholerae biofilms tomorrow.
9/21/13 We set up our large-scale AmyA Enzyme Assay using the following setup. We will test AmyA at different concentrations and over different time periods to find the best enzymatic response. A 4M Urea solution was used for all Urea treatments.
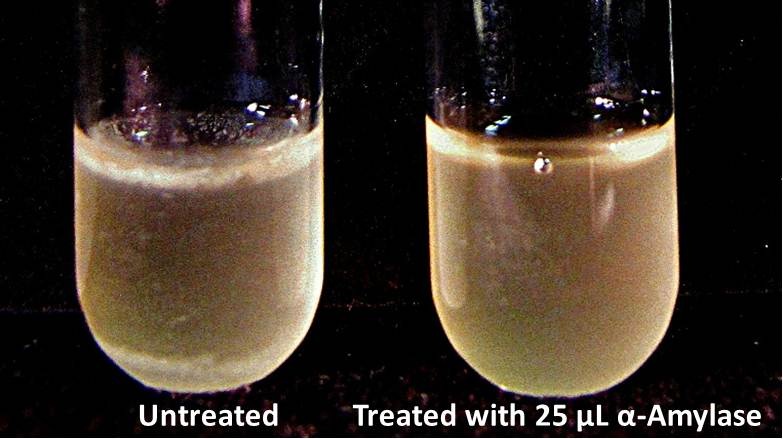
9/23/13 We checked the biofilm growths on the overnights for the biofilm assay and there is a visible difference in the amount of biofilm between the untreated samples and those treated with 25 µL α-Amylase. We added the treatments for samples with treatment time T = 48 hrs and let them incubate for 30 minutes. All samples were then centrifuged at 16,000 × g for two minutes, the supernatant was discarded to remove the growth media, and the samples were stored in the freezer overnight.
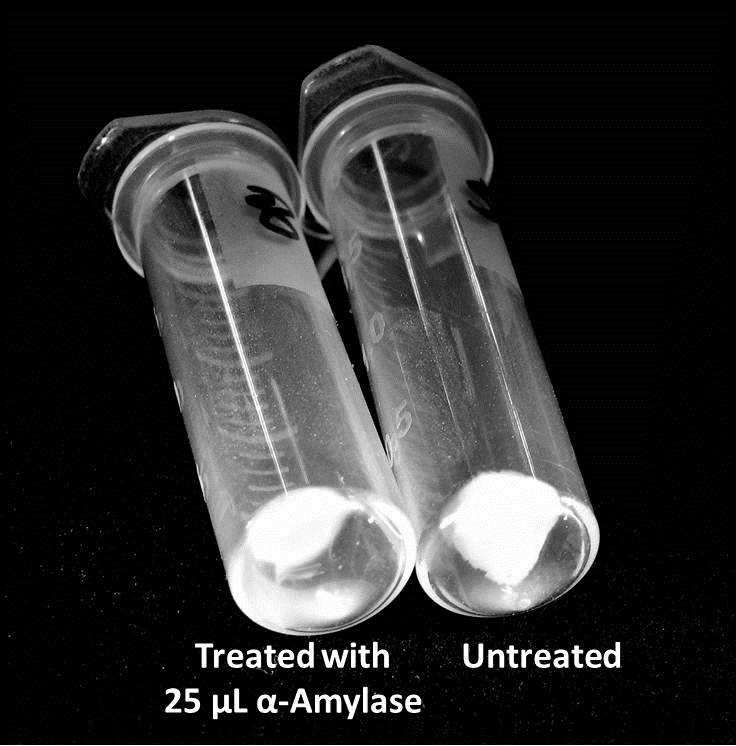
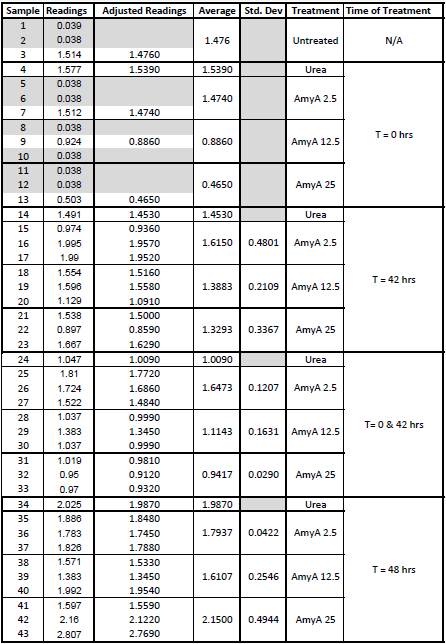
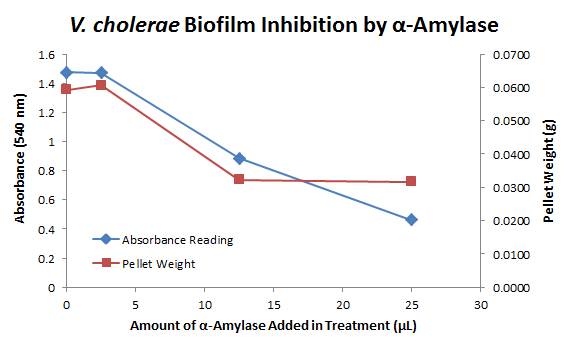
9/25/13 The pelleted samples from 9/23 were analyzed for differences in biofilm growth. There is again a visible difference in the amount of biofilm growth between the untreated samples and those treated with 25 µL α-Amylase. The samples were then resuspended in 200 µL ddH2O and stained with 50 µL of a 0.03% CV solution and allowed to incubate for five minutes. The samples were again centrifuged at 16,000 × g for two minutes and the supernatant containing excess CV was discarded. The pelleted biofilm was then washed with 800 µL of 95% EtOH without resuspension, centrifuged for 30 seconds, and the EtOH was discarded. The EtOH wash was repeated twice more for a total of three washes. The samples were then resuspended in 200 µL EtOH, transferred to a 96-well plate, and incubated for five minutes. The plate was then shaken for ten seconds and absorbance readings were taken for each sample at 540 nm. In visually inspecting the samples before transferring them to the plate for the reading, several of the samples showed significant differences from the rest of the samples. The pelleted biofilm in samples 1,2,5,6,8,10,11, and 12 were not retaining any of the stain. Each of these samples was treated in a different style eppendorf than the rest, and it is believed that the different eppendorf style was enough to cause the washes to affect the biofilms differently. After discussion, it was decided that these samples would not be read as there was an obvious difference in the way that they reacted to the treatment. The data from the plate reading is shown below: This data from the plate reading was then transferred to a spreadsheet and analyzed to correct for the baseline, determine the average reading for each treatment, and determine standard deviations. Data is shown below: From this data we graphed the averge absorbance readings for samples treated with 0, 2.5, 12.5, and 25 µL of α-Amylase treated at time T = 0, as this treatment time had the most significant impact on the biofilm growth: There is a distinct reduction in the amount of biofilm growth between untreated and treated samples, with samples treated with 25 µL α-Amylase showing a 65.8% decrease in biofilm formation after 48 hours. We are currently rerunning the assay to confirm these results in triplicate. While this clearly shows the ability of α-Amylase to inhibit biofilm formation by V. cholerae, further characterization is needed to determine the capacity of α-Amylase to degrade preexisting biofilms.
| ||||||||||||||||||||||||||||||||||||||||||||||||||||||||||||||||||||||||||||||
 "
"


