Team:ZJU-China/Project/GhostSensor/Results
From 2013.igem.org
Bacterial Ghost: Results
Contents |
Characterize the function of protein E
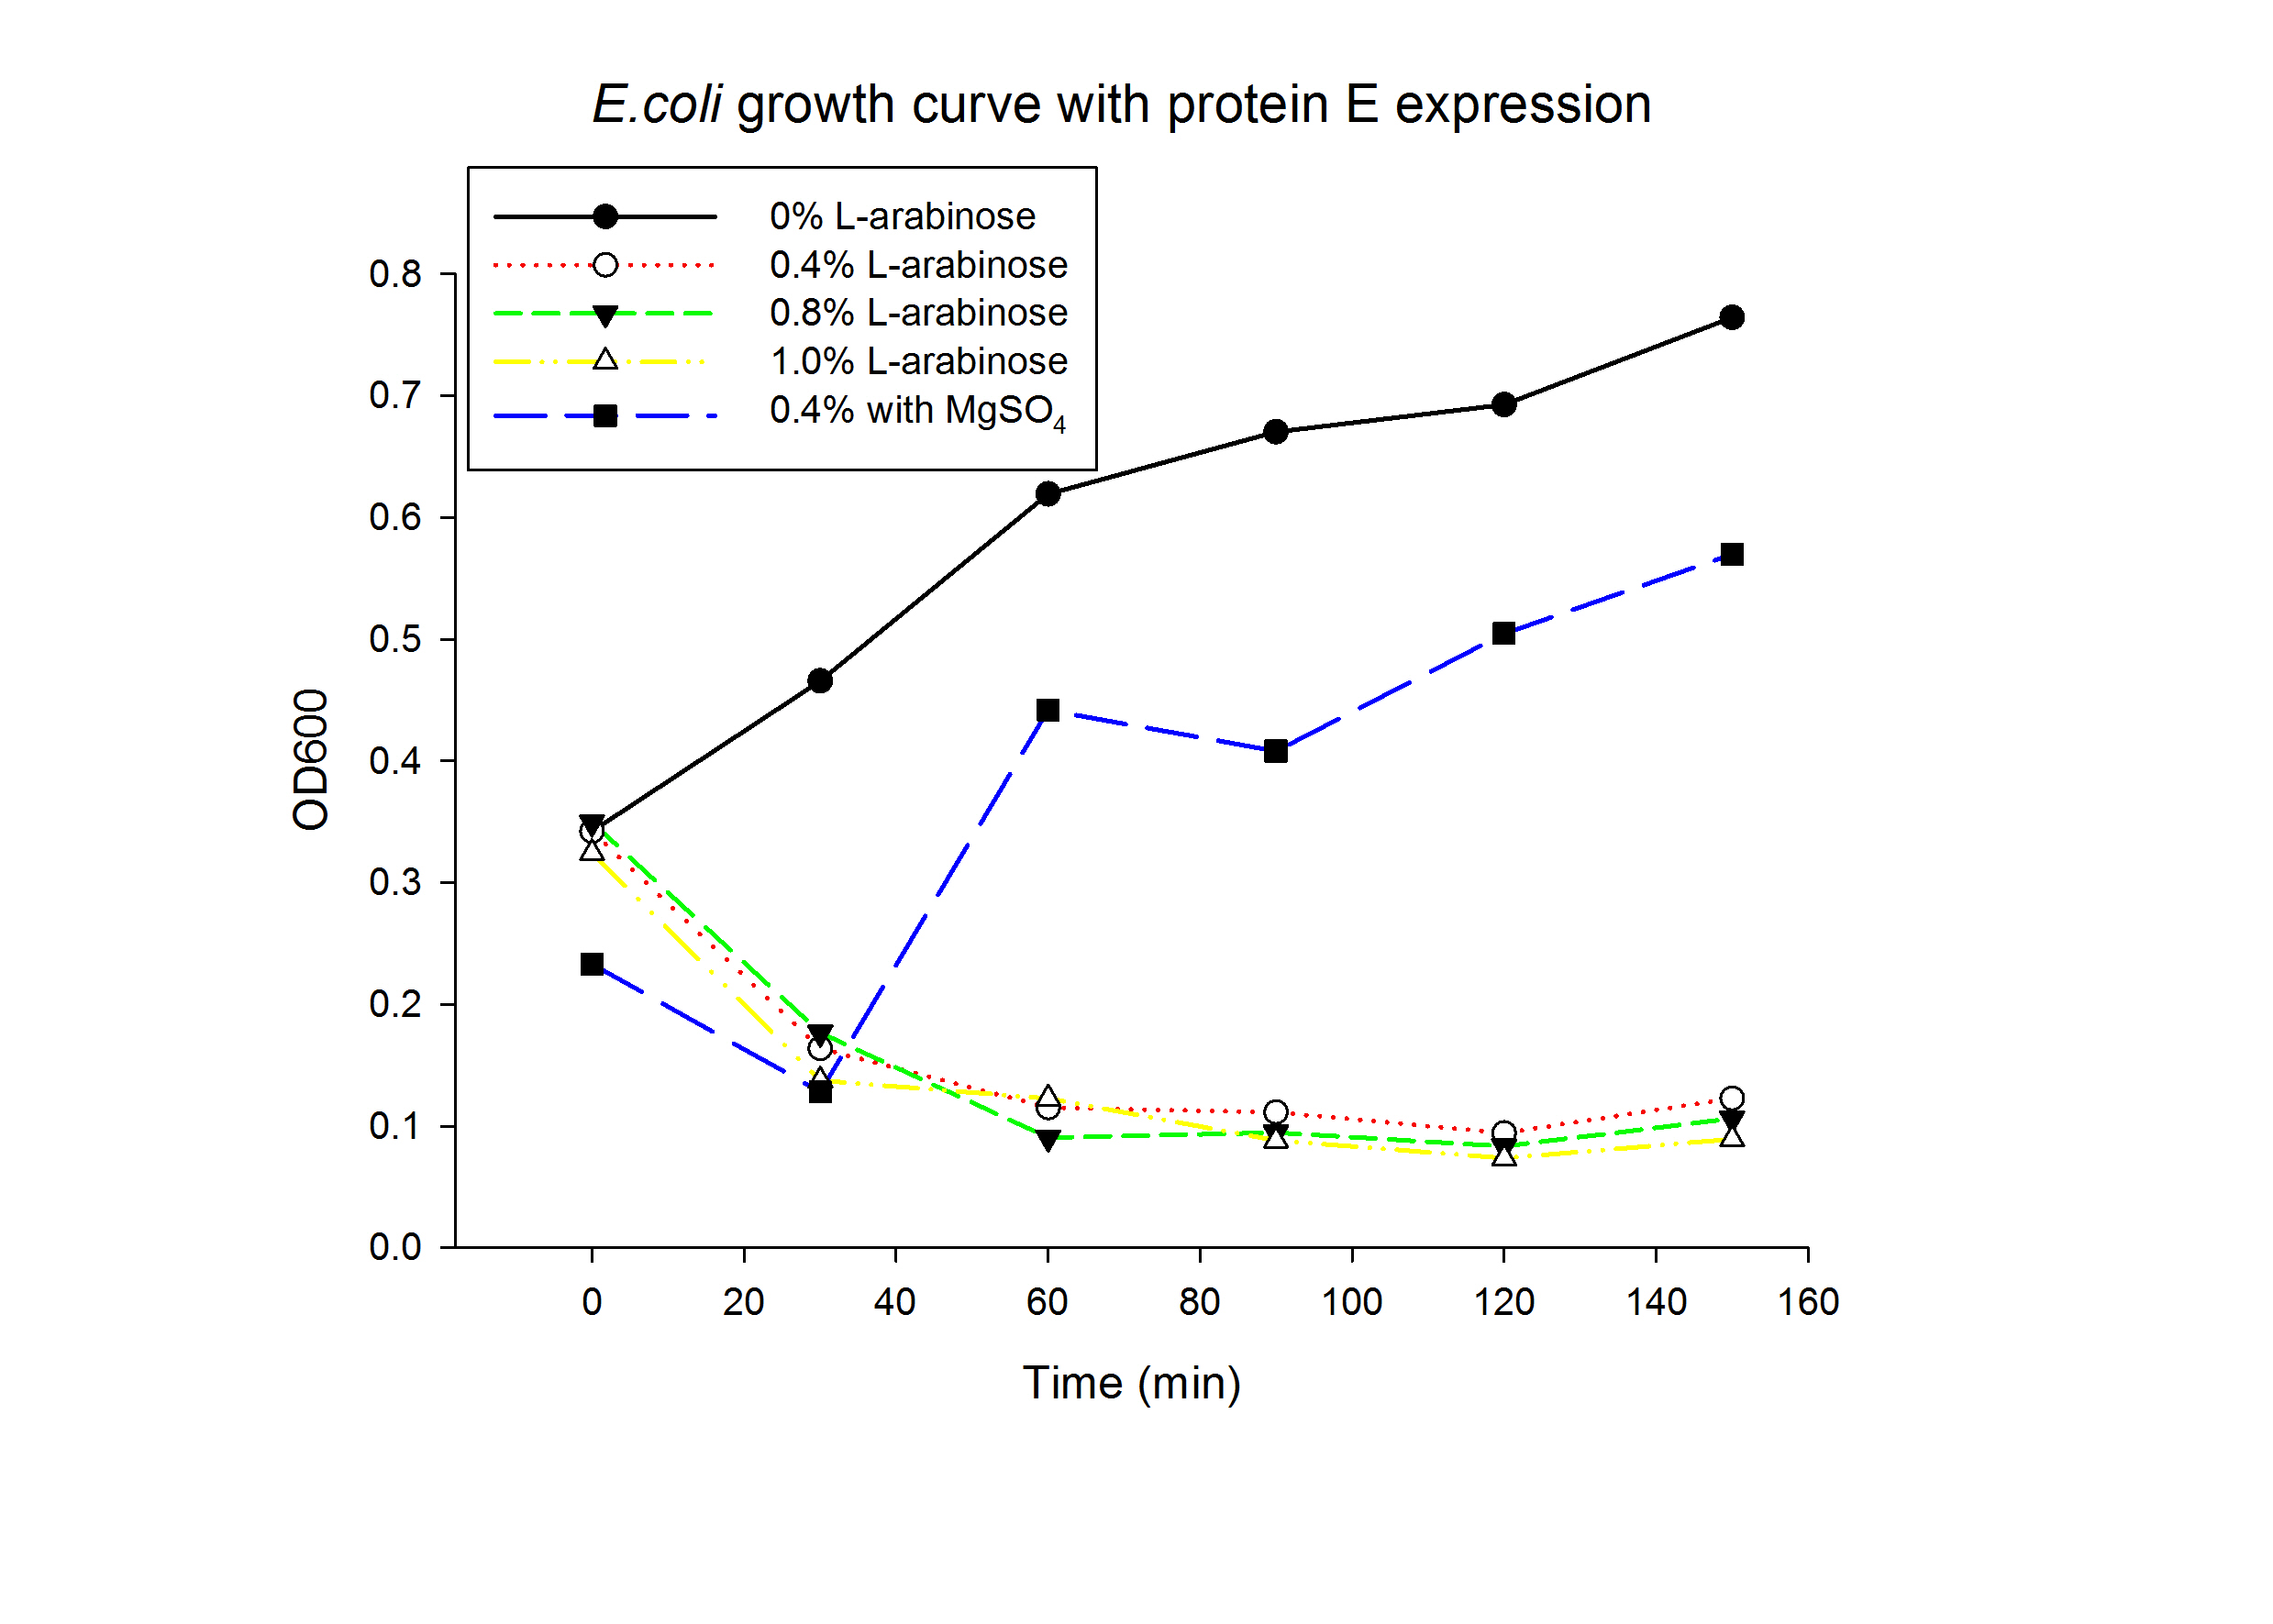
1.1 Protein E was put under the control of pBAD promoter. We recorded the growth curve of transformed E.coli cells treated with different concentrations of L-arabinose varying from 0.2% to 1%. MgSO4 has been reported to allow the expression of protein E but inhibit lysis. MgSO4 was added 30min before the induction according to previous works by others. The results showed that even as low as 0.2% L-arabinose can efficiently induce the lysis E.coli.
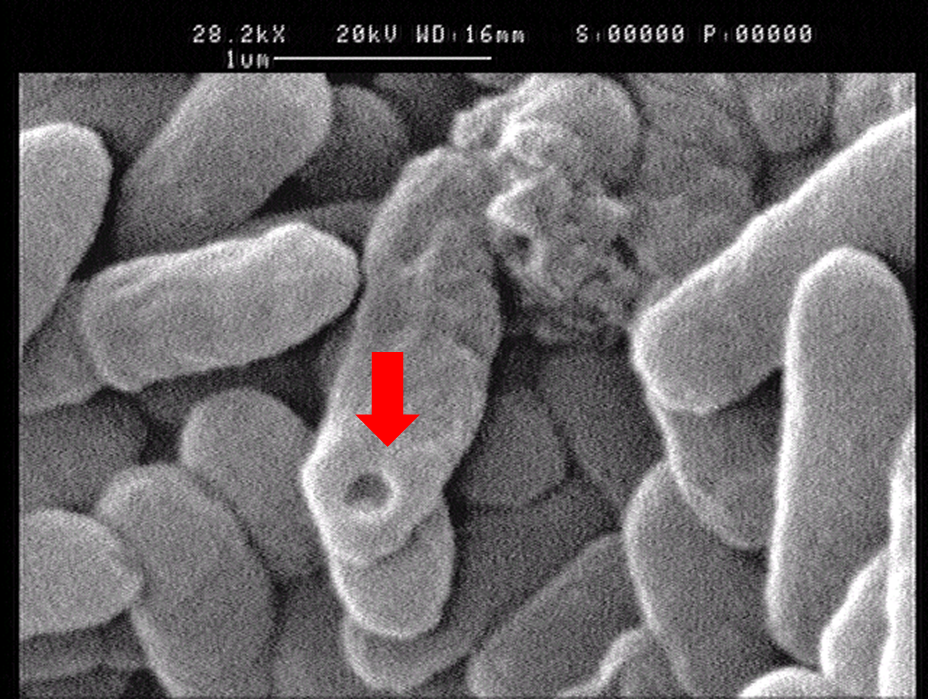
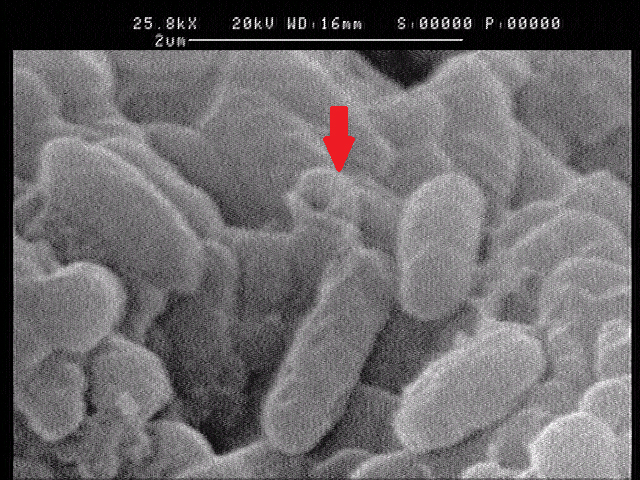
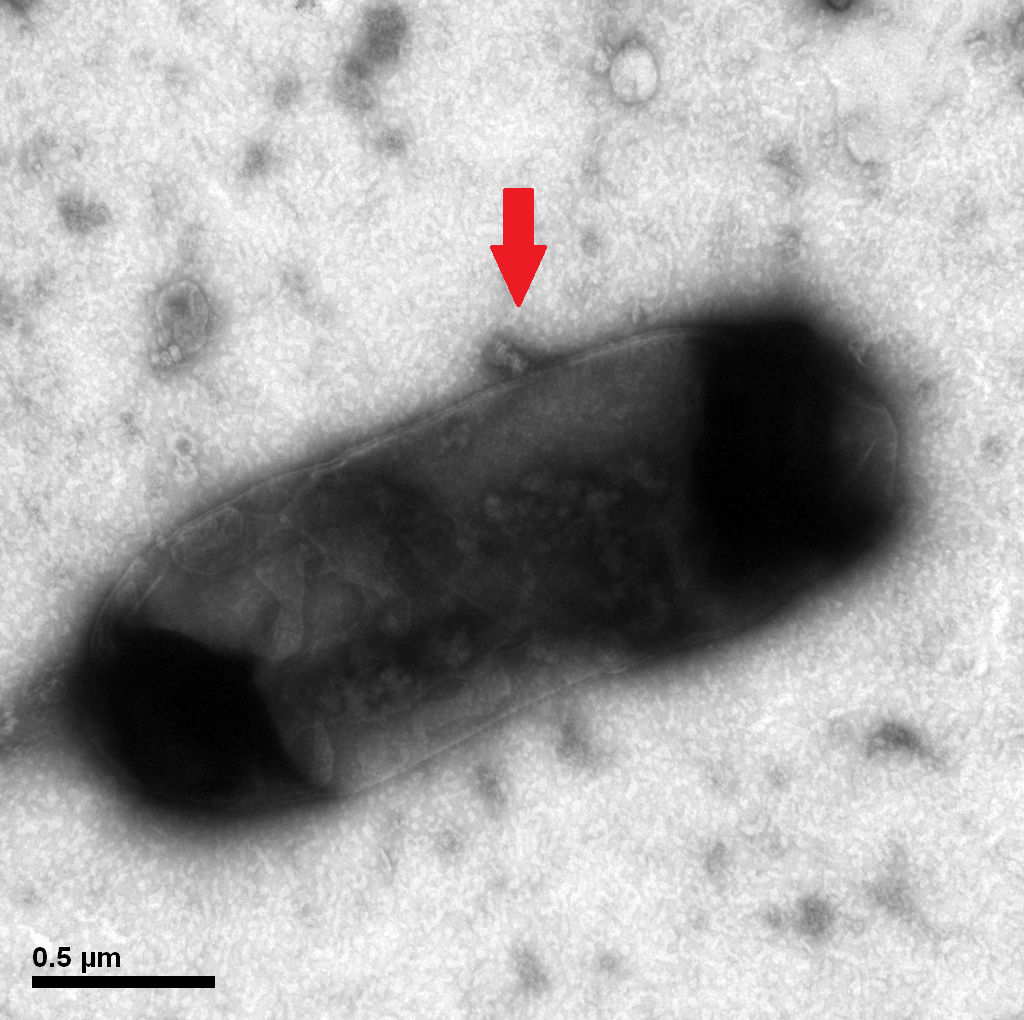
1.2 The lysed products were viewed under SEM and TEM to confirm the formation of tunnels. MgSO4 allows production of protein E, but inhibits lysis. 150min later cells were collected by centrifugation and resuspended in water causing immediate lysis by osmotic shock. This procedure would produce holes approximately equal in size to the diameter of the cell.
Left: SEM picture of protein E lysed E.coli.
Right: SEM picture of protein E lysed E.coli with MgSO4 protocol. The tunnel is relatively bigger than the left one.
Protein E mediated lysis of E.coli under TEM. A presumable efflux of cytoplasmic material is indicated by the arrow.
1.3 Determine the lysis ratio of protein E. The bacterial culture was diluted in a ratio 1:10,000 before and after the induction by L-arabinose. Then 100uL was taken to a non-antibotic plate and culture at 37C for 5hrs. The lysis ratio was determined by the equation: lysis ratio=(1-cfu before induction/cfu after induction)*100%.
(The cells in left plate were inducted while the right plate was not. The lysis ratio=(1-102/9690)*100%=98.9%)
Characterize the function of aptamers
We chose two well-characterized aptamers, namely 15-mer and 29-mer aptamers, targeting two different sites of thrombin. In order to achieve optimal spatial distance, we linked each of them with either short or long linkers (the underlined sequence below indicates the linker sequence).
| Thrombin aptamers with Short linker:
5’-biotin-ttttttggttggtgtggttgg 5’-biotin-tttagtccgtggtagggcaggttggggtgact |
|---|
| Thrombin aptamers with Long linker:
5’-biotin-ttttttttttttggttggtgtggttgg 5’-biotin-tttttttttagtccgtggtagggcaggttggggtgact |
|---|
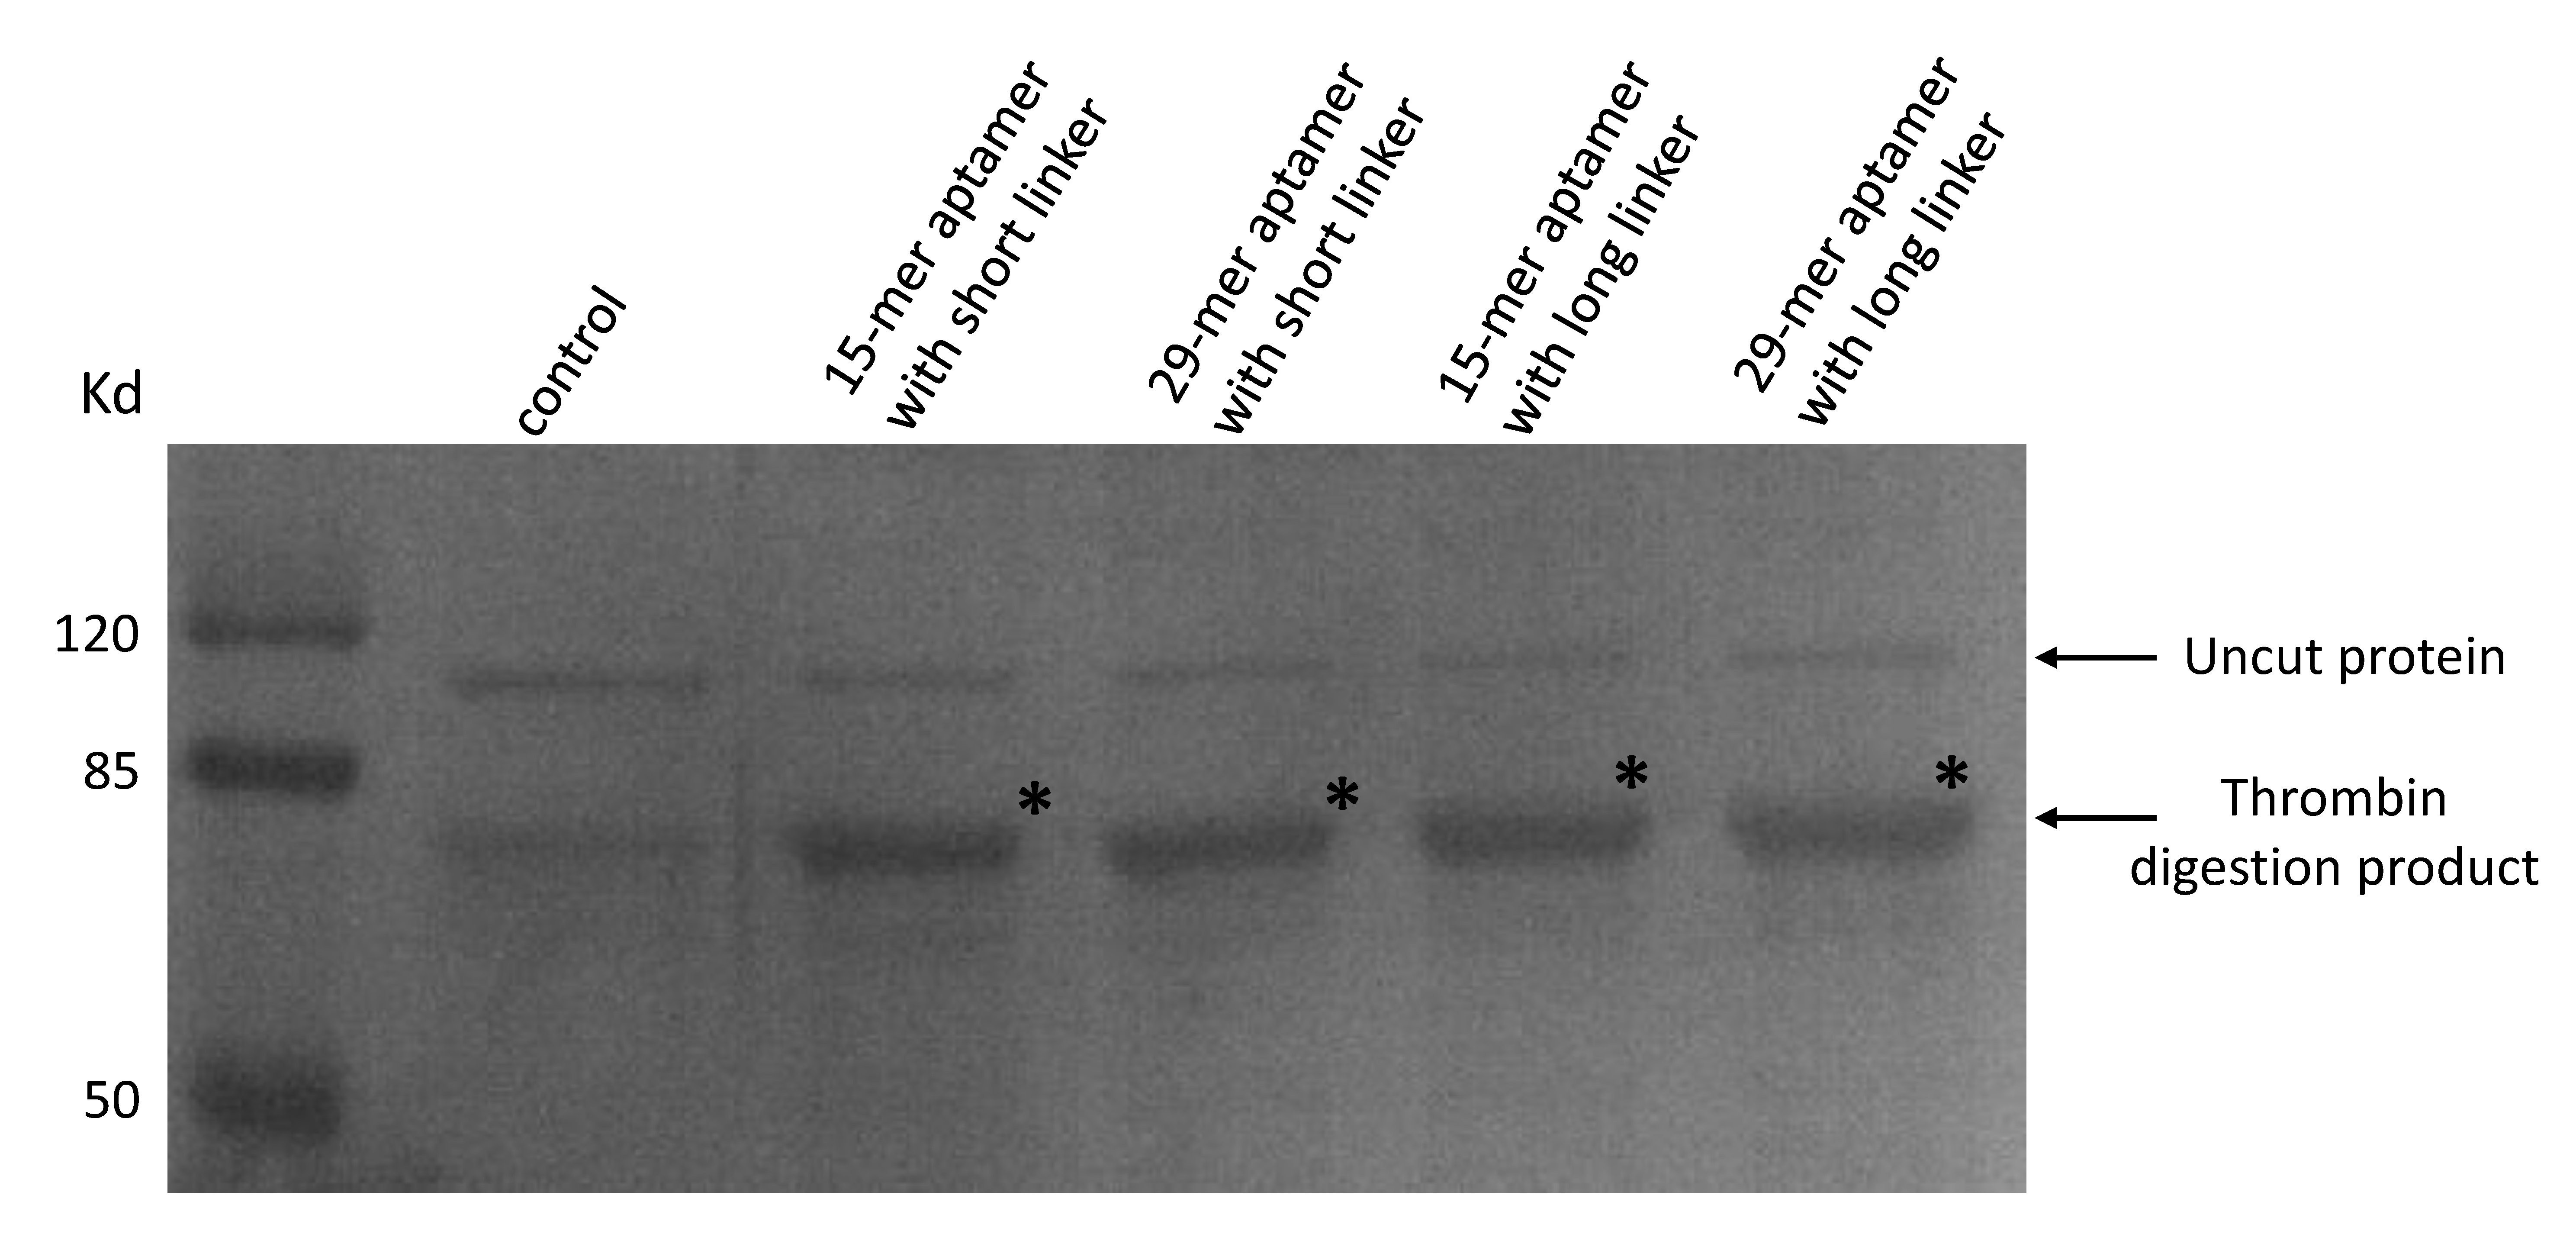
As our aptamers were biotin modified, we used a streptavidin beads pull down assay to see if these aptamers were capable of binding to thrombin.
(Coomassie blue staining of thrombin digested products. 20μL of streptavidin beads and final concentration of 50nM thrombin were added to a 300μL PBS solution. A final concentration of 50nM 15-mer aptamer with short linker (lane2), 29-mer aptamer with short linker (lane 3), 15-mer aptamer with long linker (lane4) and 29-mer aptamer with long linker (lane 5) were added respectively. No aptamers were added to lane 1. Beads were washed and resuspended and moved to a new solution of purified proteins in which a thrombin cutting site is included to allow digestion.)
Subcellular distribution of inner-membrane scaffolds
SsDsbA is the signal recognition particle (SRP)-dependent signaling sequence of DsbA. ssDsbA-tagged proteins are thus destined to export to the periplasmic space via the SRP pathway. With ssDsbA fused to the N-terminus, fusion inner-membrane proteins with transmembtrane domain are expected to be anchored onto inner membrane of E.coli.
We tried to confirm the localization of our inner-membrane scaffolds by looking at the subcellular distribution of green fluorescence in the cell. However, our confocal microscopy doesn't possess enough resolution to let us distinguish the subcellular localization of the fluorescence. So we resort to another way to tackle this problem.
We believe the nature to be rational and inferable. Logistically, because the construction of bacterial ghost is successful and cytosol would flow out to be replaced by PBS buffer, the fluorescence should come from nowhere but the membrane. In such way, we assume that our protein scaffolds have been successfully anchored to the inner-membrane of E. coli.
Detect thrombin using membrane scaffold FA and FB
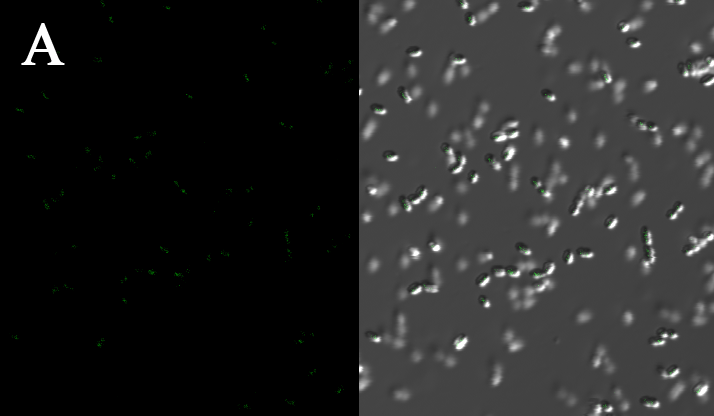
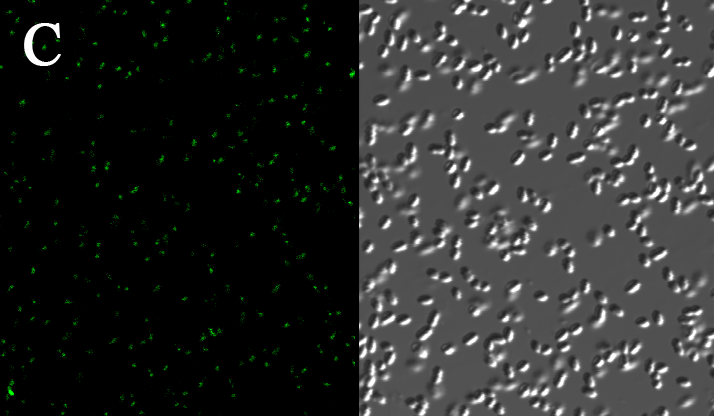
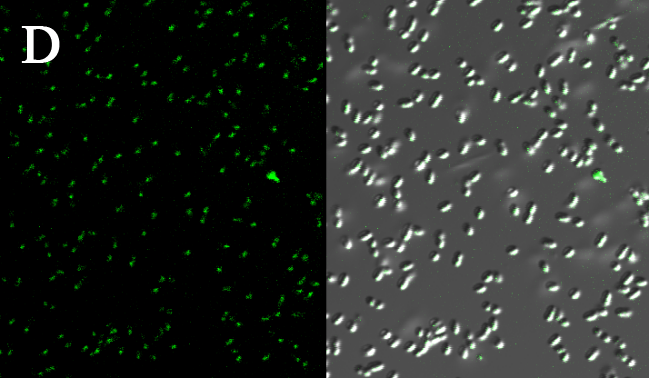
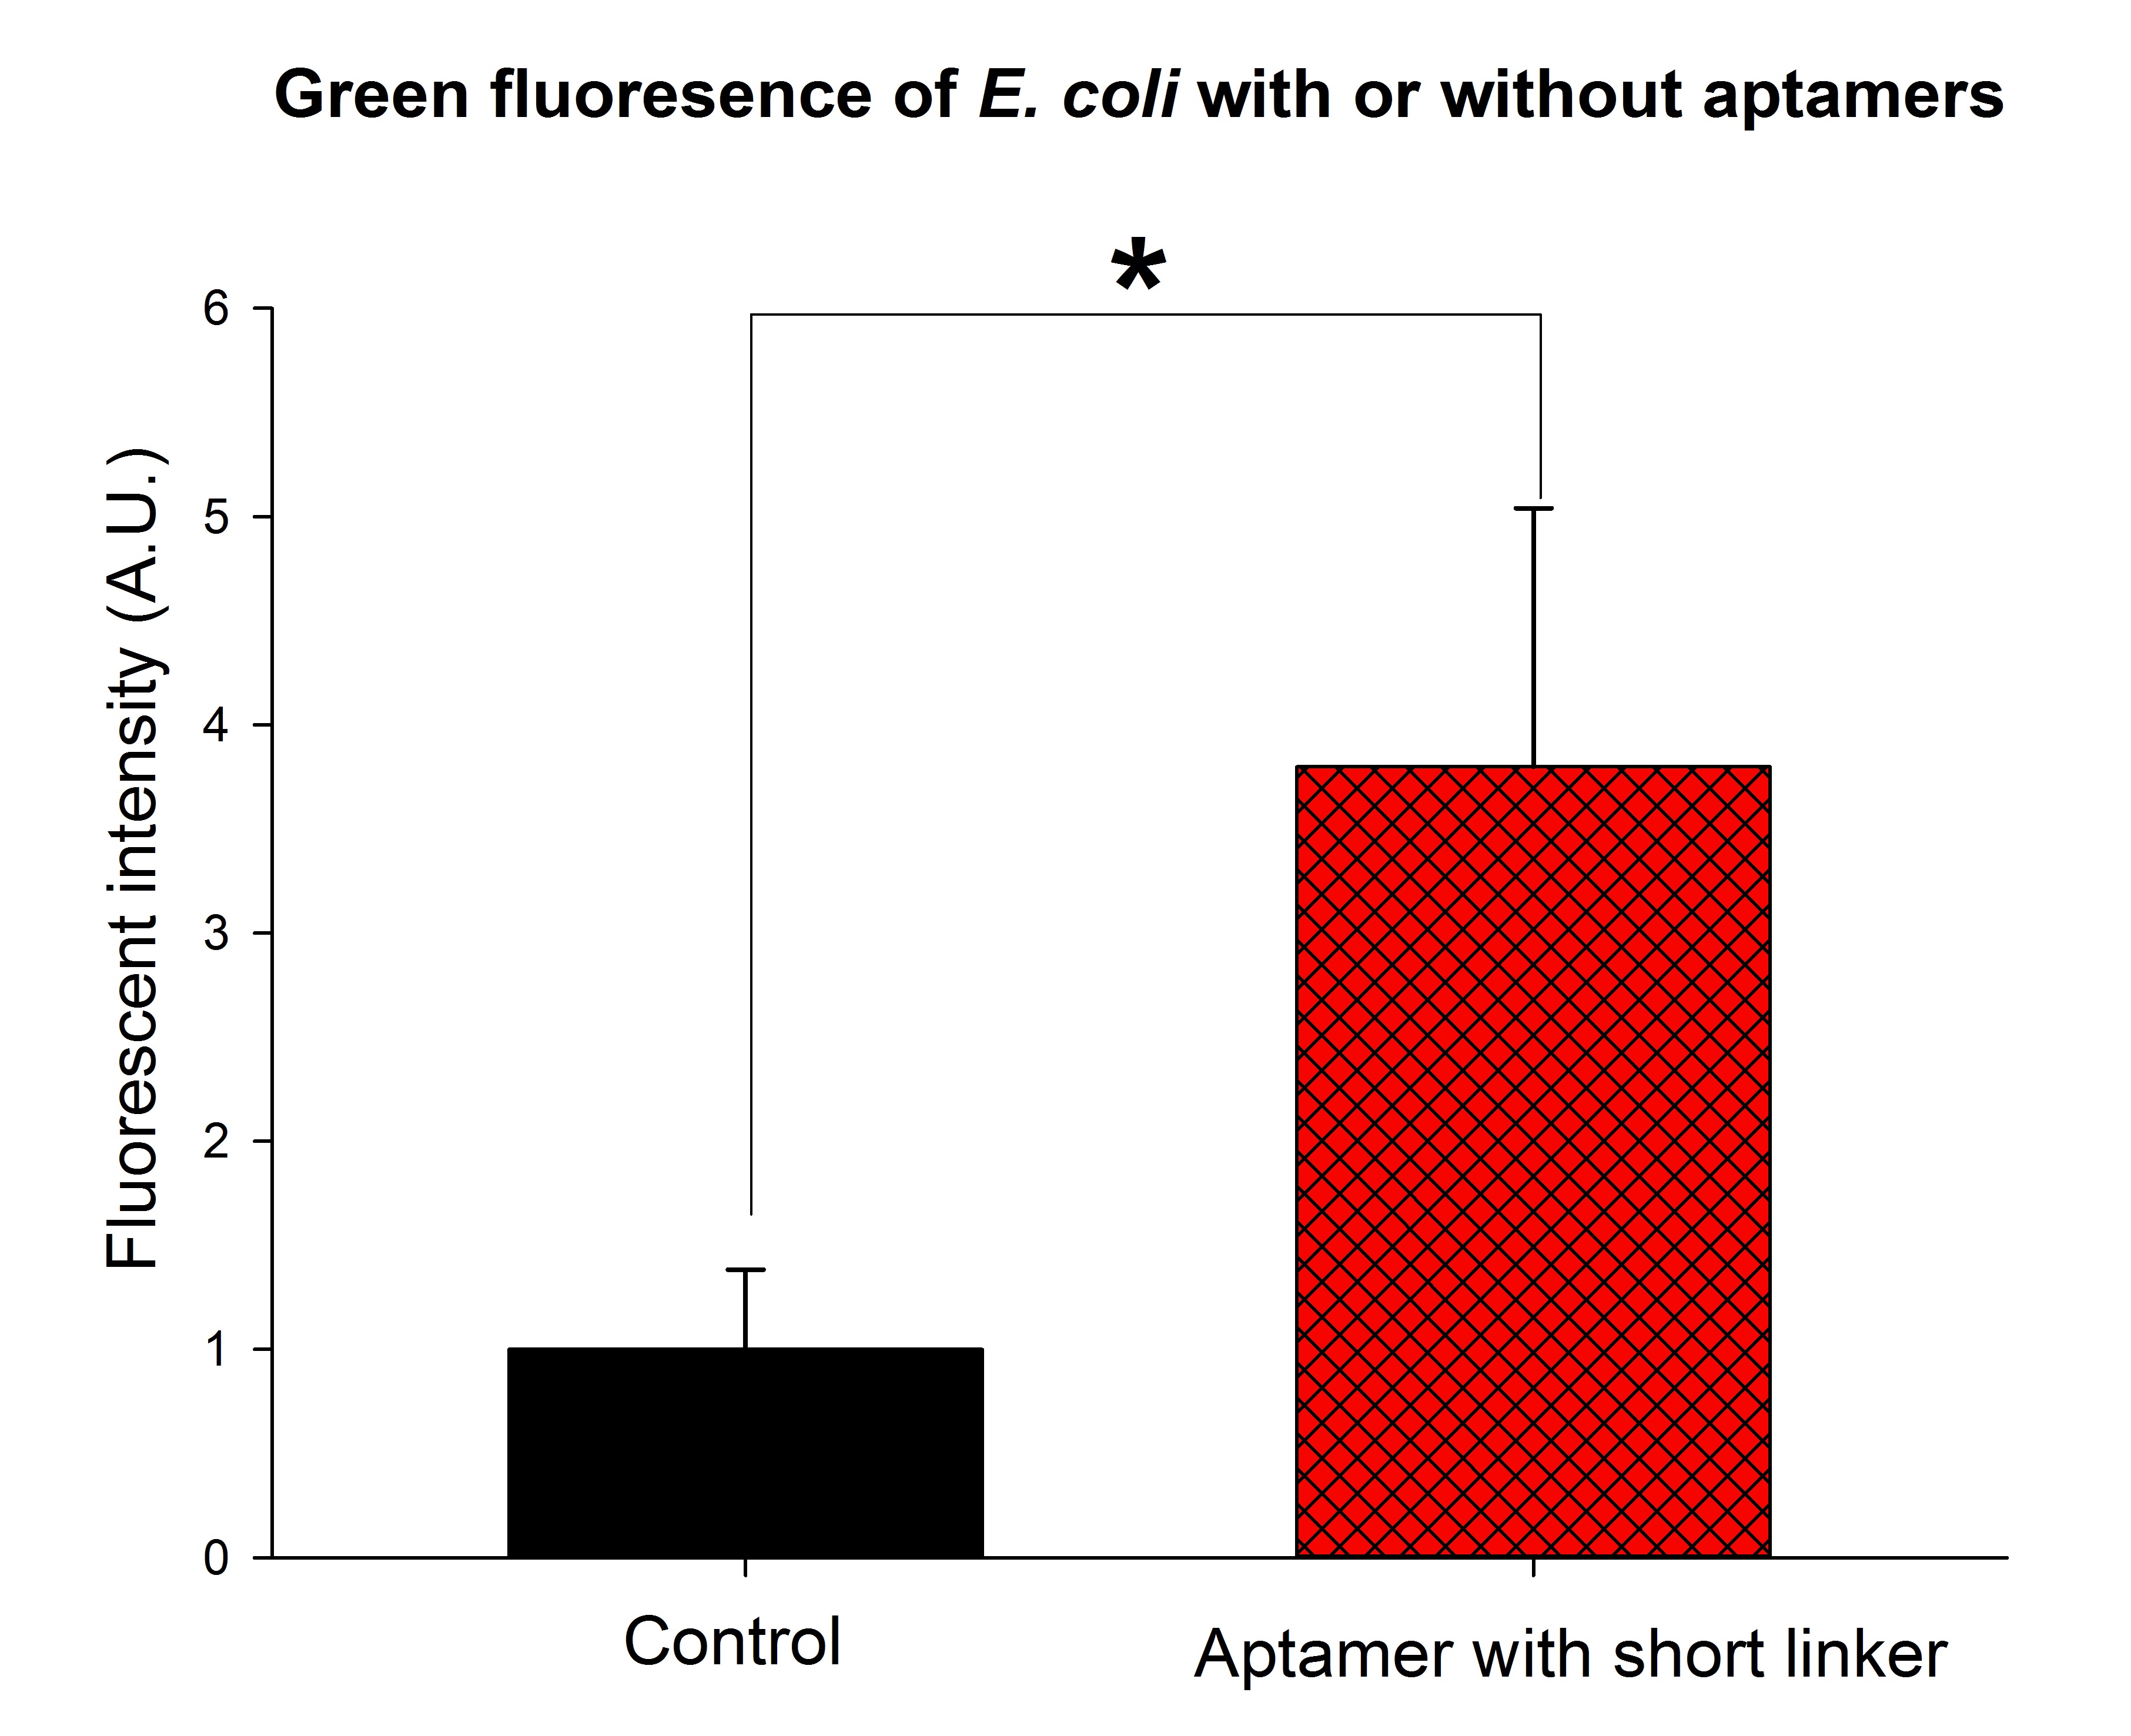
We expressed the first set of membrane scaffolds with split EGFP fragments FA and FB fused to the periplasmic end. Then we tested the function of our membrane scaffolds by adding two sets of aptamers with different linker length. The concentration of thrombin in the solution was adjusted to 0.2nM. 29-mer aptamer and 15-mer aptamer efficiently induced dimerization of membrane scaffolds (Figure C, D versus A) and led to green fluorescence emission under confocal microscopy.
(Fluorescence with or without aptamers. BL21 competent cells were co-transformed with FA, FB and protein E. When the OD-600 value reached 0.4, 0.4% was added to induce the expression of protein E. 2h later cells were harvested and washed two times with PBS. 5µL of bacteria were resuspended in 200 µL PBS, and a final concentration of 0.2nM thrombin was added to the solution. Different aptamers were also included in this point. The reaction system was incubated with shaking in room temperature for 30 min and then green fluorescence was viewed under confocal microscopy. Only very weak green fluorescence was visible when no aptamers were added to the reaction system (A). Biotinylated thrombin can readily induce membrane scaffolds dimerization because there were typically 1-4 biontin in one molecule leading to scaffolds crosslinking (B). 15-mer and 29-mer aptamer with short (C) or long (D) linkers were both effective in inducing crosslinking. But it seemed that long linkers (D) is more potent than short linker (C) in this system. )
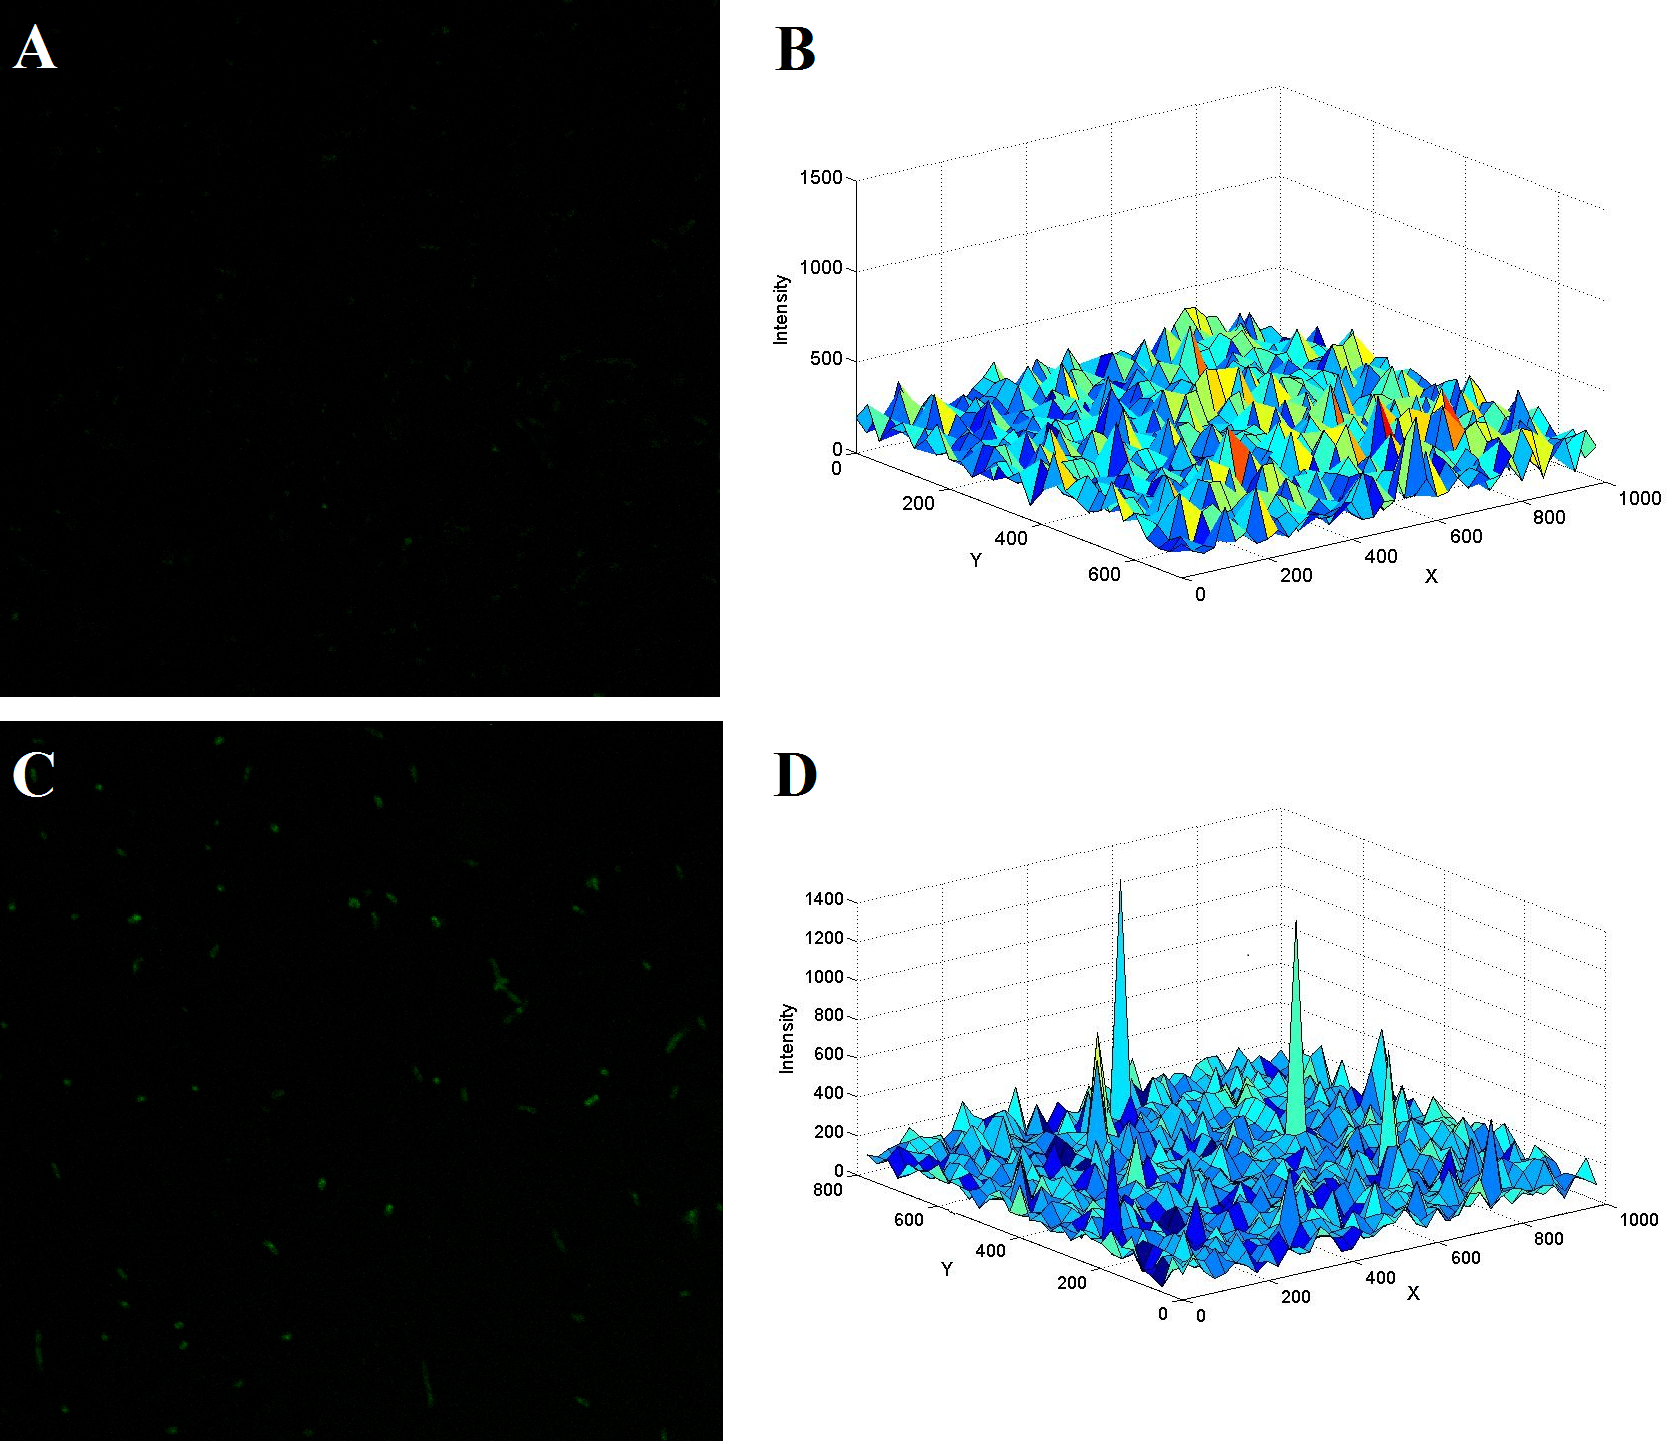
(The upper figure demonstrates another two typical confocal image of E.coli with (C) or without (A) the two kinds of thrombin aptamers. The thrombin concentration was adjusted to a final value of 0.2nM. Figure B and D shows the spatial fluorescent intensity distribution across the image of the left figure accordingly.)
(The green fluorescence intensity was significantly stronger than the control group when thrombin aptamers with short linkers were added to the solution. The final concentration of thrombin was adjusted to 0.2nM. p<0.01, n=3, t-tset. A.U., arbitrary unit.)
 "
"


