Team:TU-Munich/Results/GM-Moss
From 2013.igem.org
The PhyscoFilter for Erythromycin
In order to check the activity of the erythromycine esterase B we pursued two different approaches: on the one hand we produced the enzyme recombinant in Escherichia coli and purified it. The purified protein was used for in vitro activity tests determining the depletion rates. The reaction was stopped at predetermined times by addition of three volumes acetonitrile and freezing in liquid nitrogen. On the other hand we added the substrate erythromycin at a concentration of 0.2 g L-1 to 3 mL of a polyclonal suspension of transgenic moss plants expressing the erythromycin esterase B in the cytoplasm. After 24 h of incubation at normal growth conditions 100 µL of the supernatant were used for further analysis.
Both samples were analyzed by liquid chromatography coupled to mass spectrometry (UPLC/MS/MS). The samples were measured at a Waters Xevo TQ-S using a Waters Acquity BEH C18 2,1 x 100mm column (1.7 µm, 130 Å pore size) and the following method: Solvent A: 0.1 % formic acid in water, B: 0.1 % formic acid in ACN and a linear gradient of 99 % A 0.5 min isocratic to 99 % B in 6 min. Column temperature 40 °C, flux 0.4 mL min-1, maximal pressure 703 bar. The tuning was executed with solutions consisting of the pure educt at concentrations of approximately 0.1 mgL-1.
In part A of figure seven the liquid chromatography chromatogram and the associated molecular mass for pure erythromycin as a standard is shown highlighted in red at a retention time of 3.65 min and a mass of ~734.3 g mol-1.
Part B of figure seven shows the corresponding LCMS spectra of purified erythromycin esterase B incubated for 0 min and 5 min with erythromycin. After 0 min of incubation the red highlighted peak with a retention time of 3.68 min and a mass of ~734.3 g mol-1 shows the initial presence of the substrate. However even merely mixing the substrate and enzyme was sufficient to degrade a small amount of substrate which is shown by the emerging peaks at 4.19 and 4.30 min retention time. The chromatogram of the sample taken after five minutes of incubation no longer shows the characteristic substrate peak at 3.68 min indicating that the whole amount of substrate was successfully degraded by the purified enzyme.
Part C of figure seven shows the corresponding LCMS spectra of the in vivo degradation experiment with transgenic moss expressing erythromycin esterase B in the cytoplasm. After 24 h of incubation at normal growth conditions the chromatogram of the sample containing the wild type moss as a negative control exclusively shows the characteristic peak for the substrate highlighted in red. The chromatogram of the sample in which the transgenic moss was utilized in contrast shows the clear degradation of the substrate because only the peaks at retention times of 4.19 and 4.30 min appear representing the degradation product as explained for part B of this figure.
To summarize this experiment demonstrates that our transgenic moss successfully degraded the environmental pollutant erythromycin!
The PhyscoFilter for Diclofenac and Ethinylestradiol
One major advantage of the applied enzyme laccase is its broad substrate spectrum. The enzyme should be able to degrade important hormones as 17-ß-estradiole or ethinylestradiole as well as the extensively used pain killer diclofenac. Laccases are secretory enzymes requiring an oxidized milieu for proper activity. Therefore we tried to express the laccase from Bacillus pumilus membrane anchored.
Figure 2 shows fluorescence microscopy images of the receptor associated GFP. In comparison to other fluorescence images of trans membrane constructs the fluorescence at the membrane is ony slightly increased. This could indicate an inefficient integration of our construct into the membrane. Therefore we tried to determine if our transgenic moss is able to degrade substrate in vivo. Besides LC MS a suitable detection method for diclofenac is a competitive ELISA developed by prof. Knopp. This ELISA is by now commonly used for the routine detection of diclofenac in waste water.
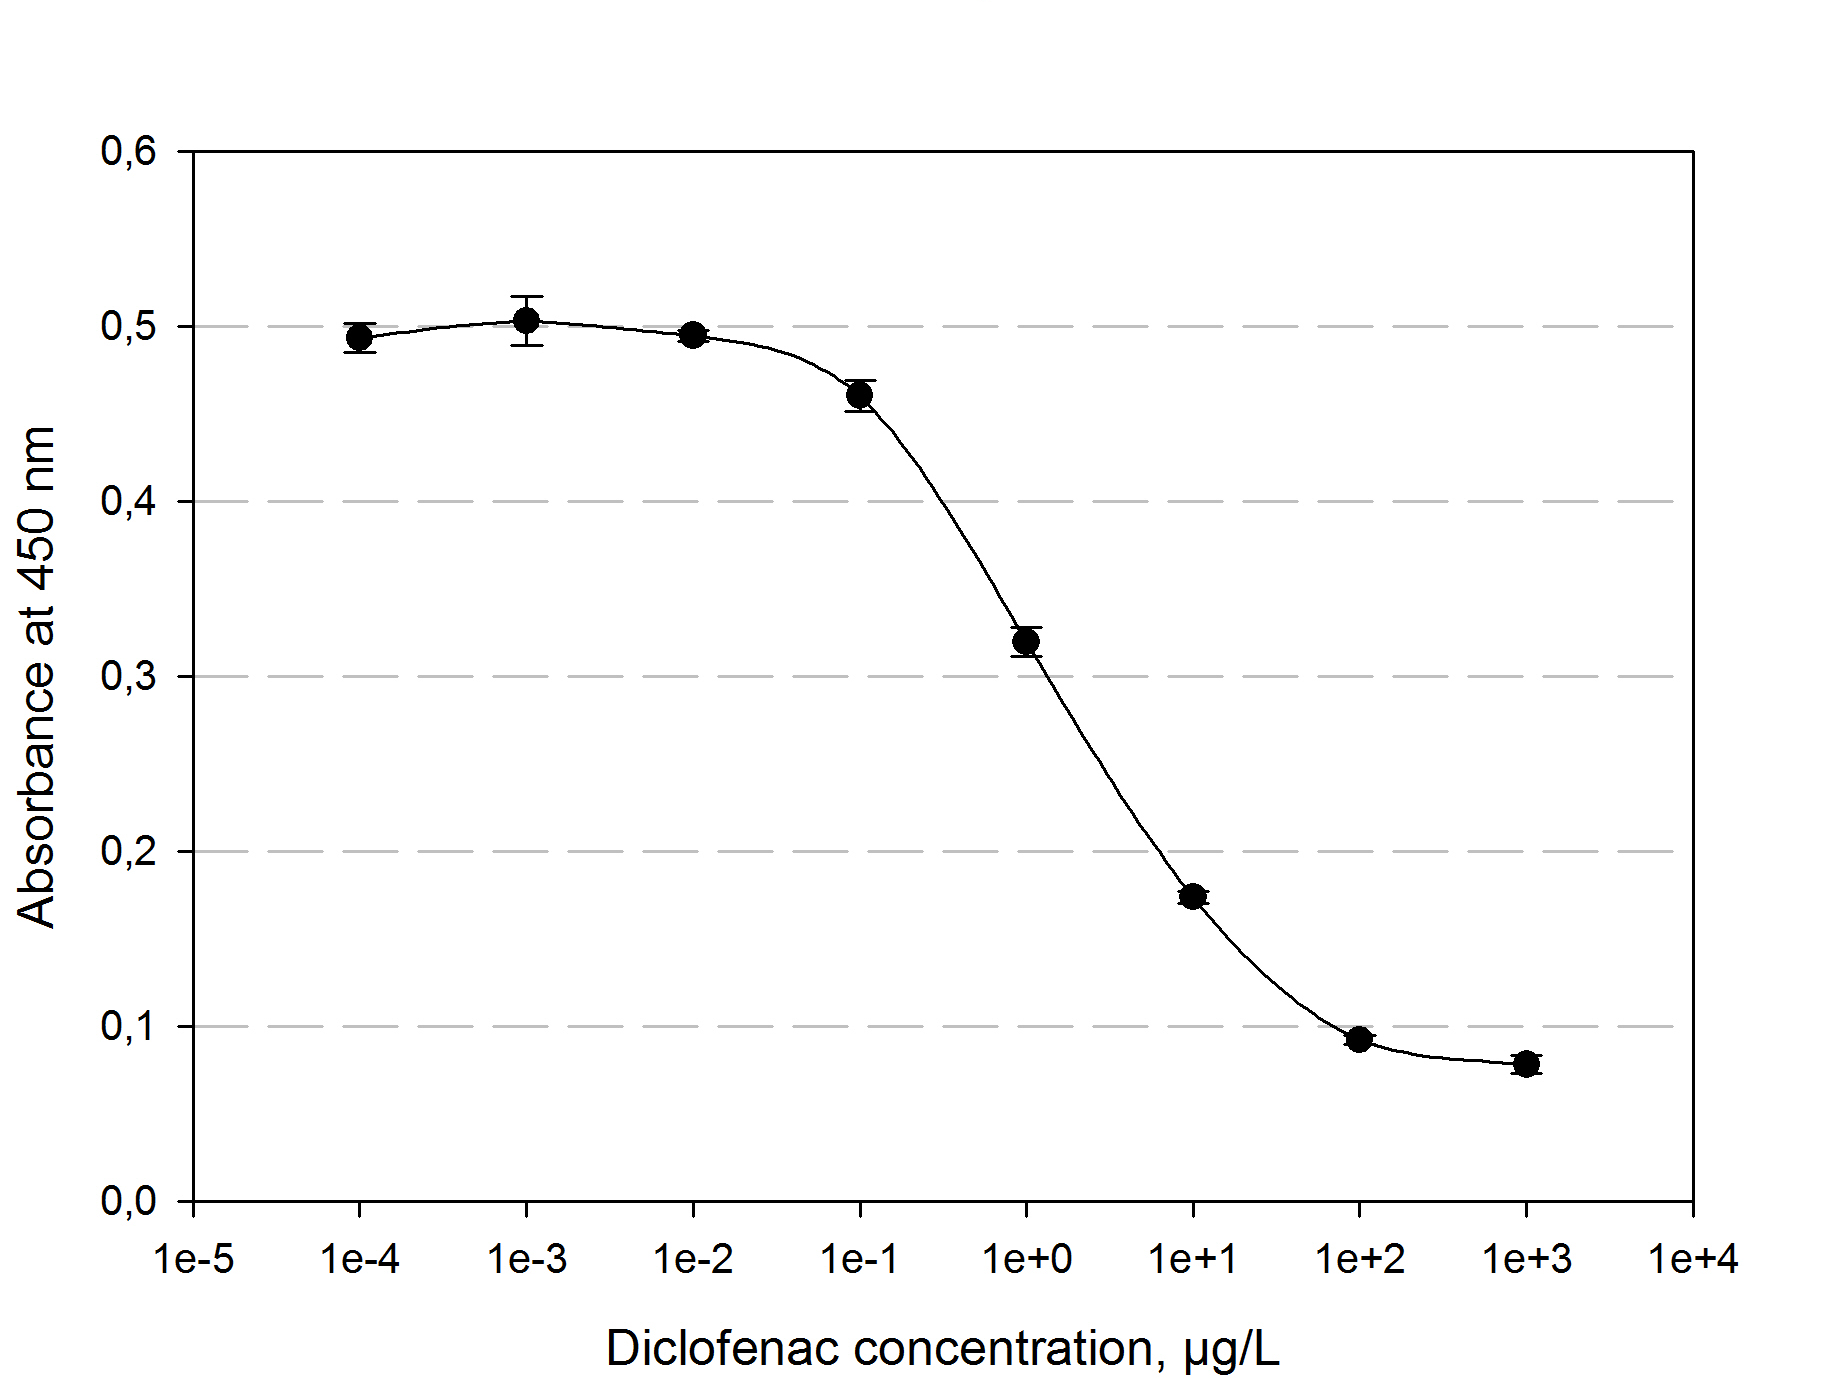
The function principle of the ELISA is as follows: a 96 well plate gets precoated with an diclofenac-OCA-conjugate at 4°C over night. After washing and blocking with 1% casein the competition reaction is initiated by the addition of a polyclonal antibody solution and the samples which should be quantified. The diclofenac present in the samples competes with the diclofenac-OVA-conjugate to be bound by the antibodies. The more diclofenac a sample contains, the less antibody binds to the plate surface. After a washing step a secondary HRP-labeled antibody is added to the plate. The read-out reaction is initiated by coating the plate with 1% H2O2 and TMB (3,3′,5,5′-Tetramethylbenzidin). After 15-20 min. the reaction is stopped by adding 5 % H2SO4. The blue TMD with an absorbtion maxima at 650 nm changes to yellow with an absorption at 450 nm. The amount of TMB is detected by measuring the absorbance. The standard calibration graph for diclofenac concentrations of 10-5 to 104 µg/L we performed is shown in figure 4. The samples of diclofenac incubated with either transgenic moss or recombinant produced and purified laccase did not show any evaluable results. Possibly the used primary antibody shows cross reactivity with the created product of the degradation reaction, so that the assay is not suitable to quantify the degradation product. This has to be checked via LC MS.
The PhyscoFilter for Microcystin
Besides our own approaches to prove the opportunity of cell surface immobilized effectors for the bioaccumulation of those pollutants which cannot be degraded enzymatically so far, we took part in a collaboration with this year’s iGEM team from Dundee and expressed their Protein Phosphatase 1 in our moss. Due to the high amount of free cysteine residues of this protein it is necessary to express it as a secreted or cell surface immobilized protein. For a sustainable removal of PP1’s substrate microcystein we decided to express PP1 membrane-anchored. The naturally occurring membrane turn-over could lead to a degradation of the receptor-bound microcystein through the intra cellular degradation machinery. This way the idea of a self-regenerating biological filter could be realized for non-enzymatically degradable substances, too.

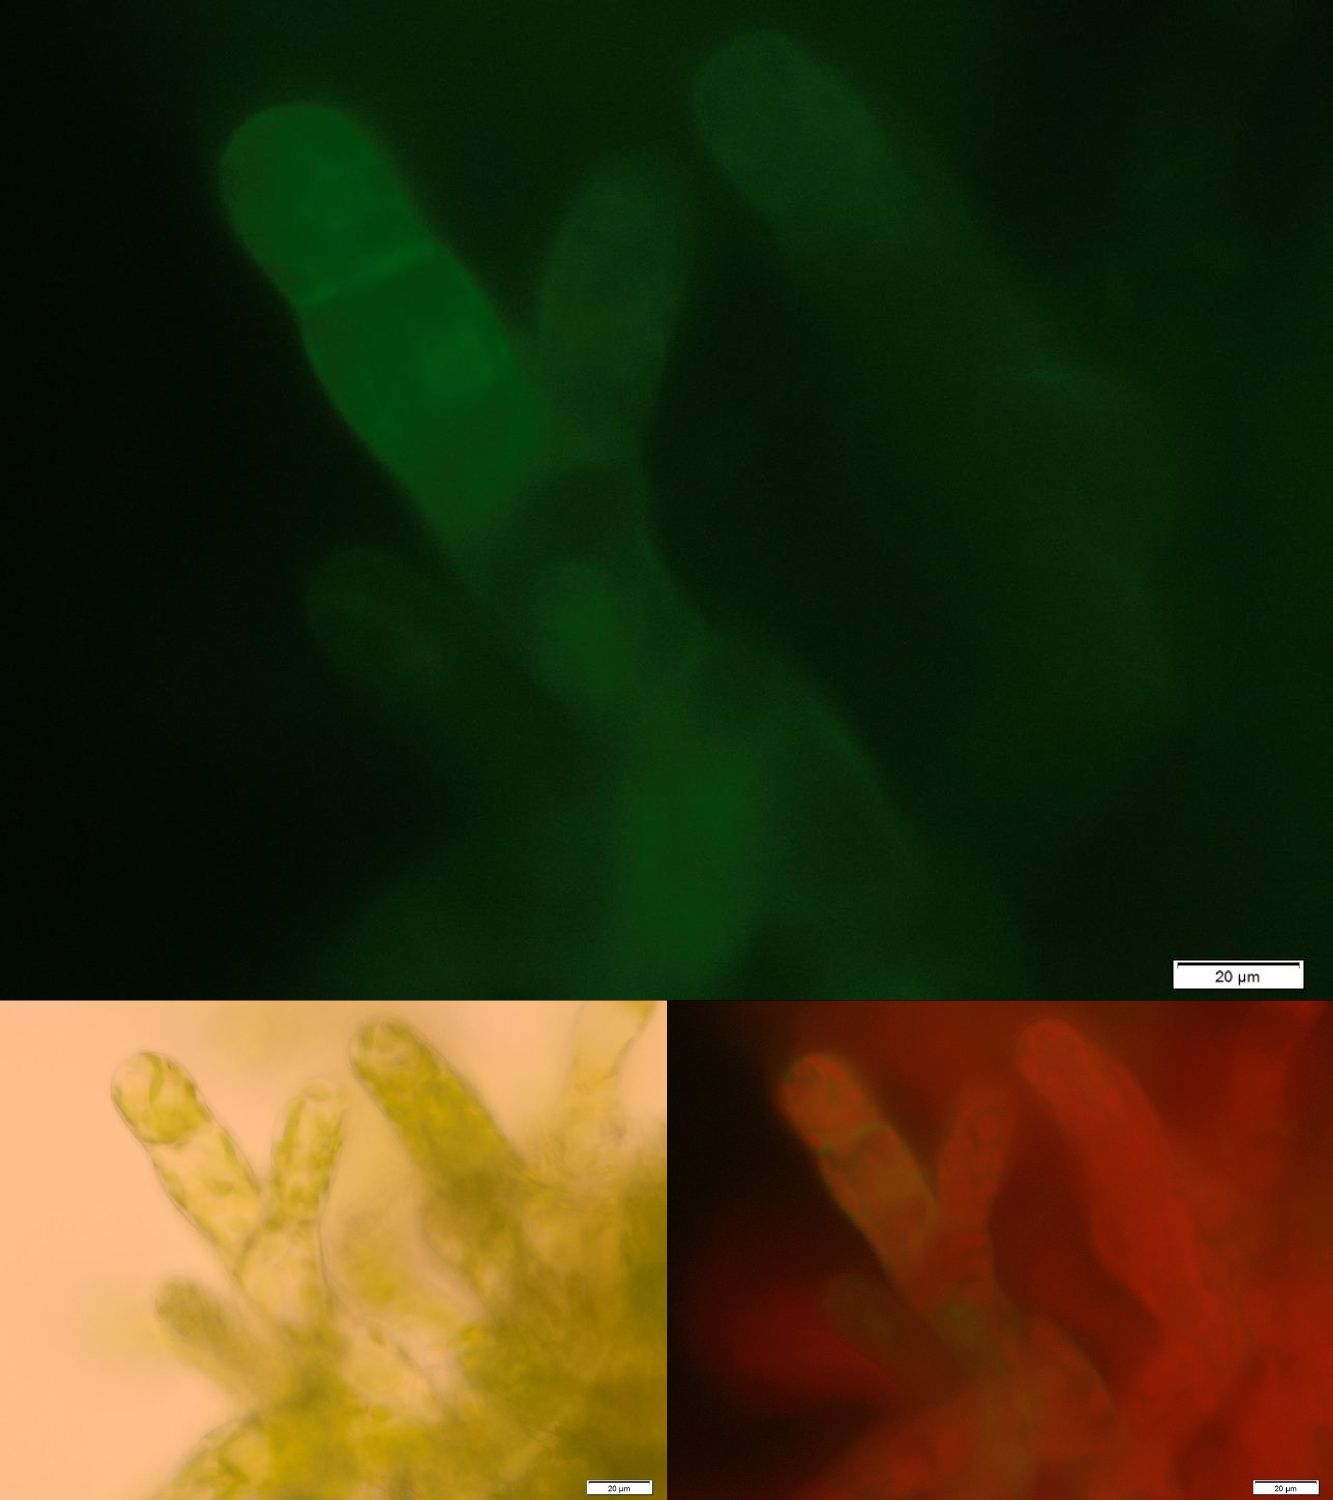
In the upper part of Figure 5 fluorescence images of the transgenic moss transformed with membrane-bound PP1 are shown. Conspicuously the fluorescence only occurs in small locally restricted dots which are widespread distributed over the whole cell. Anyway the images give strong indications that the receptor fusion proteins are not membrane associated due to aggregation, assumedly in the endoplasmic reticulum. Probably even the protein folding machinery of our moss cannot handle the correct folding of this construct. Therefore from our point of view protein engineering with subsequent deletion of free cysteine residues could be a suitable next step to decrease the aggregation tendency and thereby increase the amount of membrane localized PP1 with correct folding.
The PhyscoFilter for Fluorescein
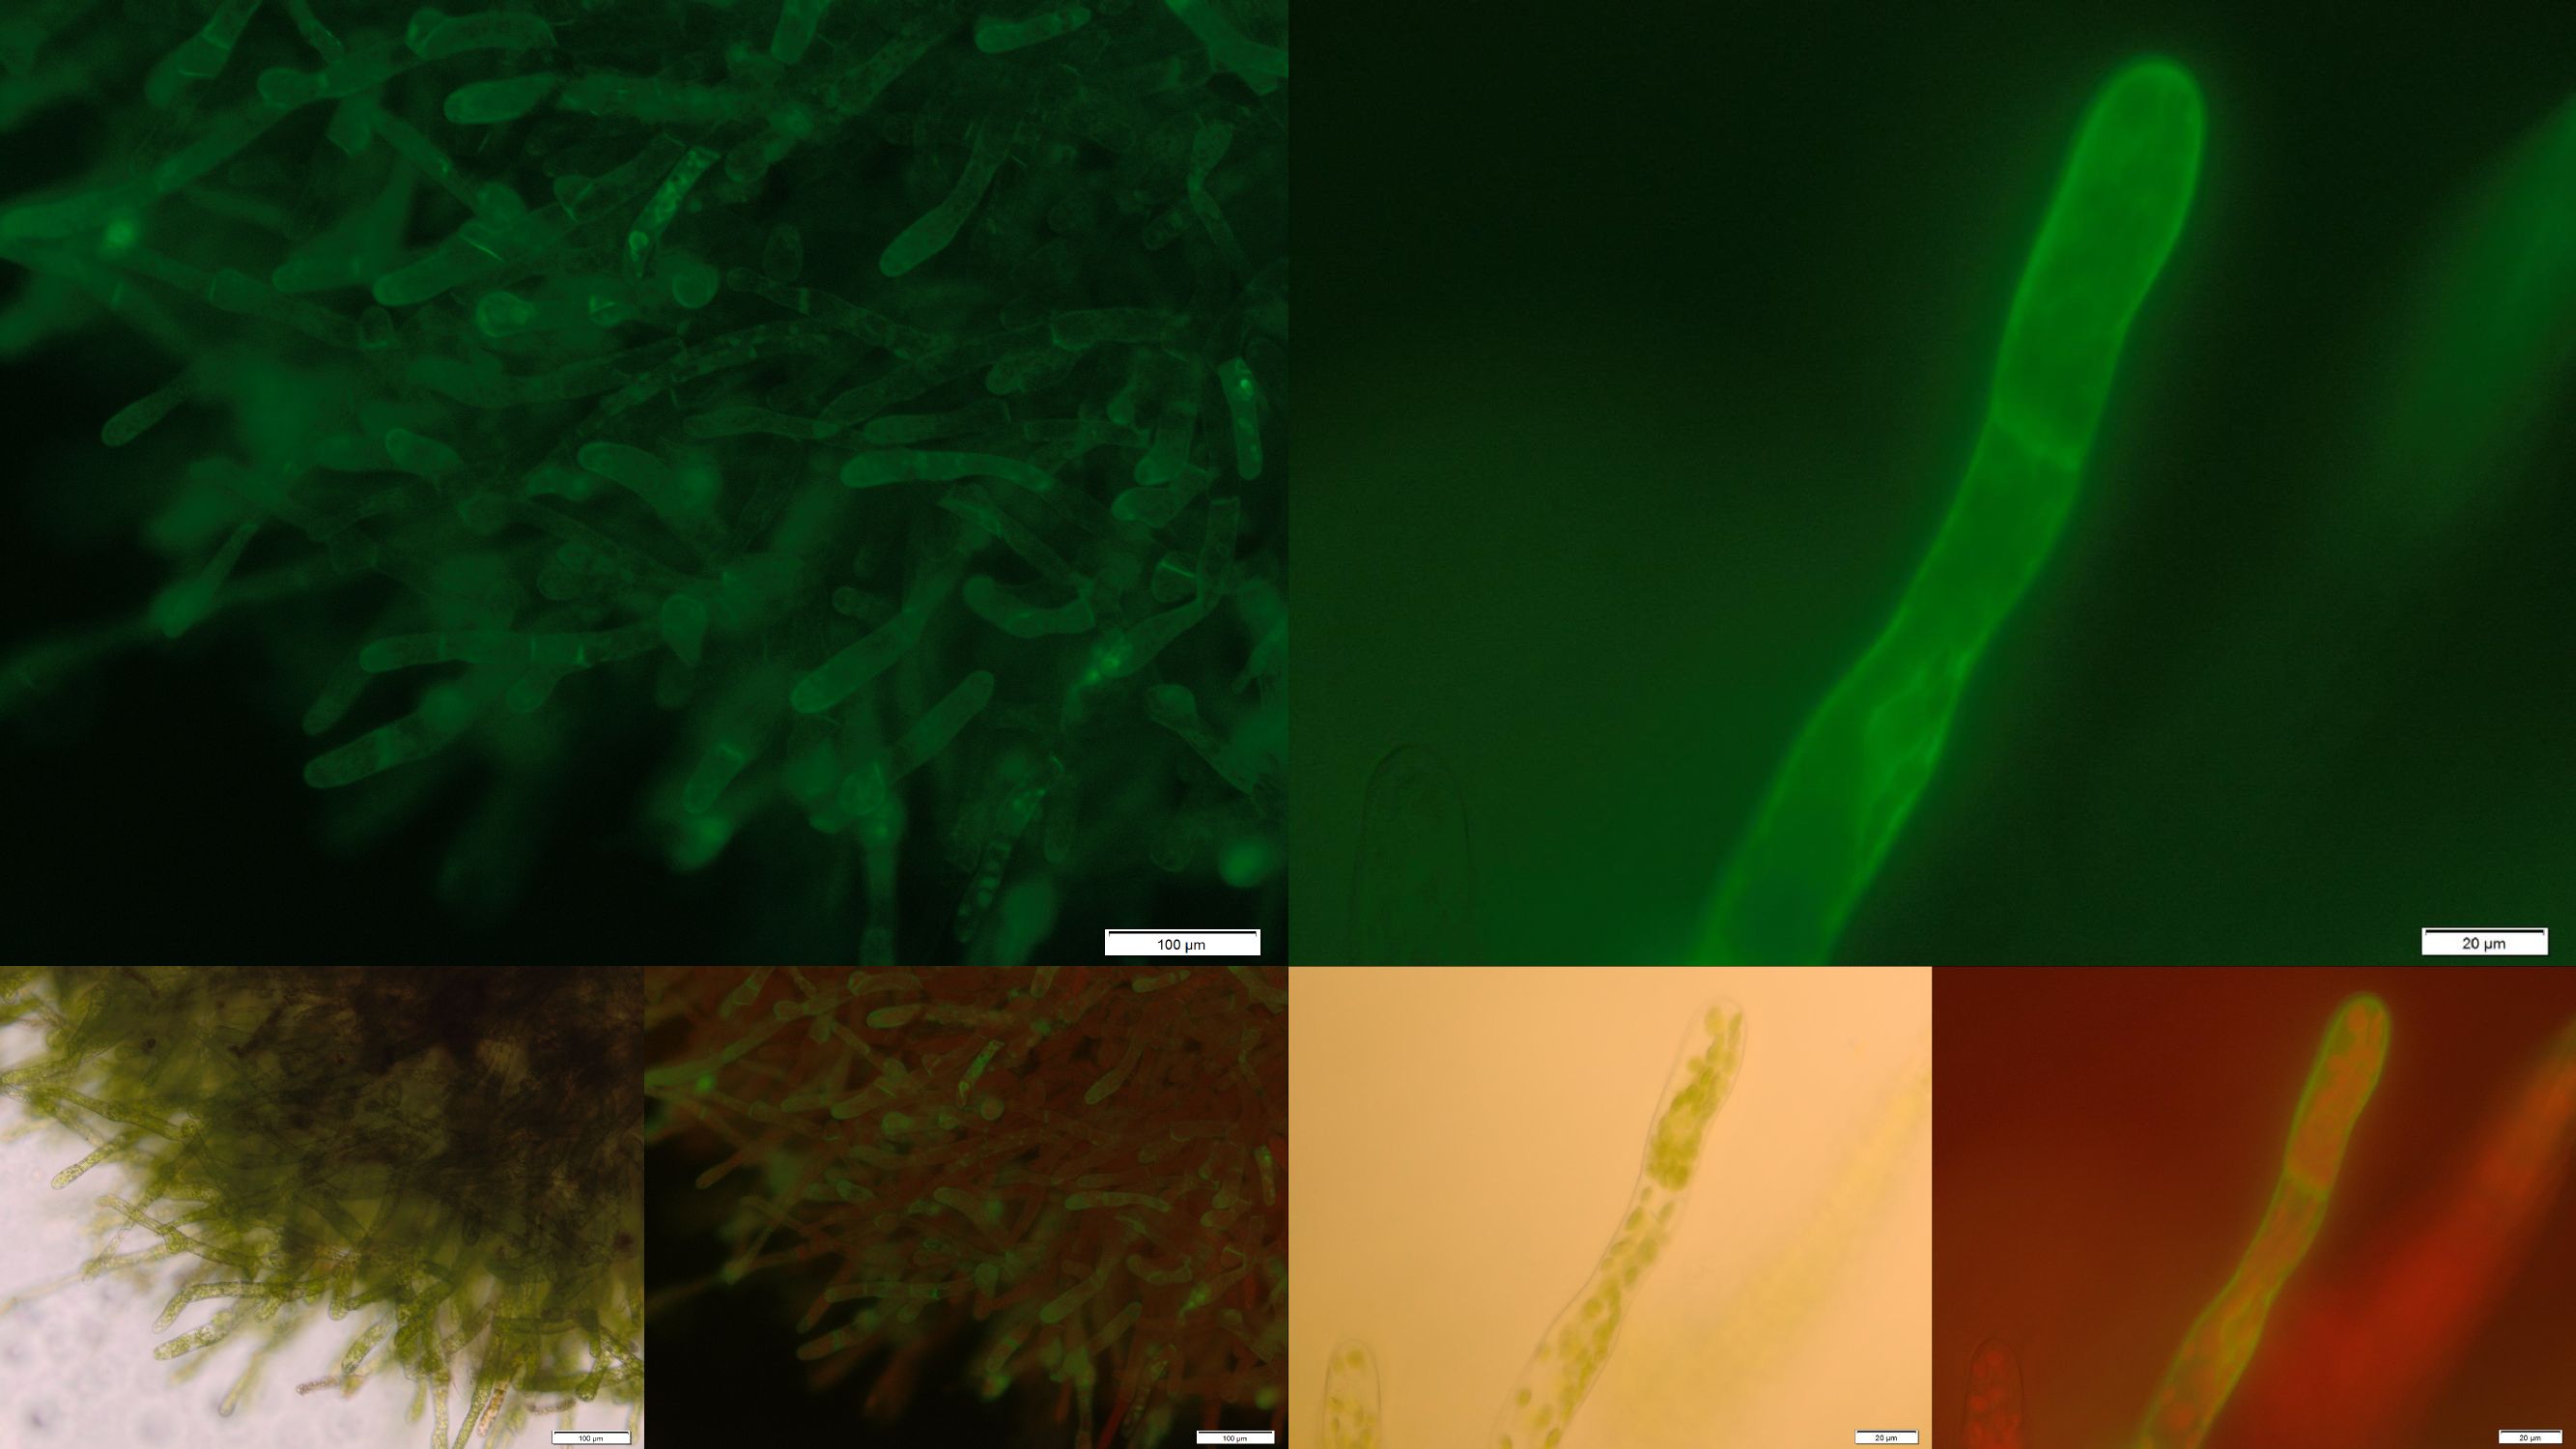
In order to prove the suitability of surface immobilized binding molecules in general and of aniticalins in particular we decided to transform our moss with a genetic construct containing [http://parts.igem.org/Part:BBa_K1159003 FluA], an Anticalin with a high affinity towards fluorescein, fused at the C-terminus to the N-terminus of our developed [http://parts.igem.org/wiki/index.php?title=Part:BBa_K1159315 trans membrane receptor]. Especially in the upper and lower fluorescence images on the right a compared to the cytoplasm increased membrane associated GFP fluorescence can be seen. This fluorescence indicates that our used secretion signal and trans membrane domain work properly and lead to the desired membrane localization.
References:
http://www.plant-biotech.net/paper/CurrGenet_2003_hohe.pdf Hohe et al., 2004 An improved and highly standardised transformation procedure allows efficient production of single and multiple targeted gene knockouts in a moss, Physcomitrella patens, Current Genet. 44, 339-347.
http://www.ncbi.nlm.nih.gov/pubmed/12966990 Deng et al., 2003 Residue analysis of the pharmaceutical diclofenac in different water types using ELISA and GC-MS, Environ Sci Technol. 37, 3422-3429.
 "
"


AutoAnnotator:
Follow us:
Address:
iGEM Team TU-Munich
Emil-Erlenmeyer-Forum 5
85354 Freising, Germany
Email: igem@wzw.tum.de
Phone: +49 8161 71-4351