Team:Leeds/Results
From 2013.igem.org
Results from the lab so far. Please note, many of the images have been uploaded at high resolution, and are best viewed from their file page. Access this by clicking the image. We may later introduce a gallery of the images to maximise the screen usage, but this is dependent upon Coffee-Induced coding by the Code Monkey.
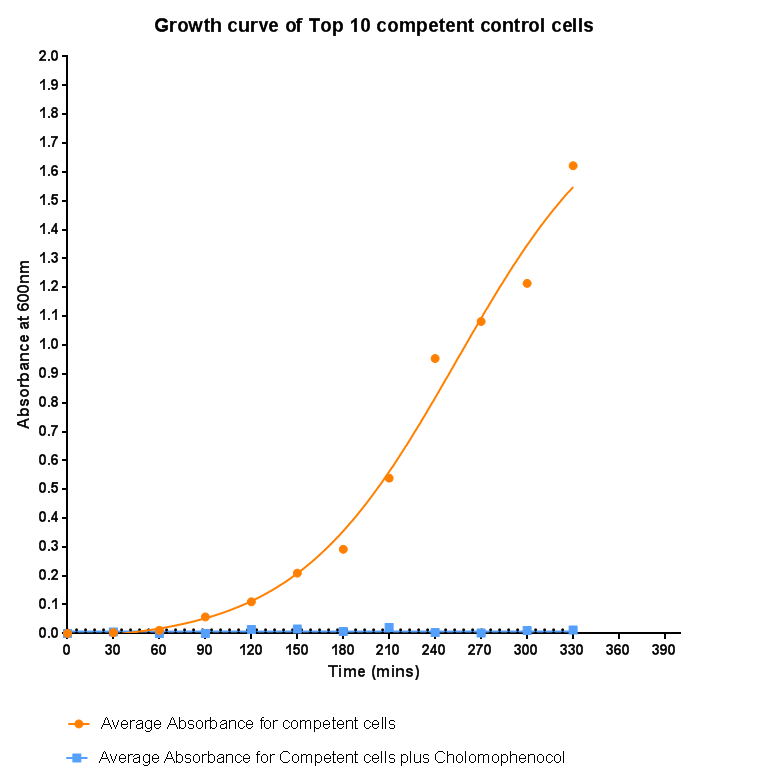
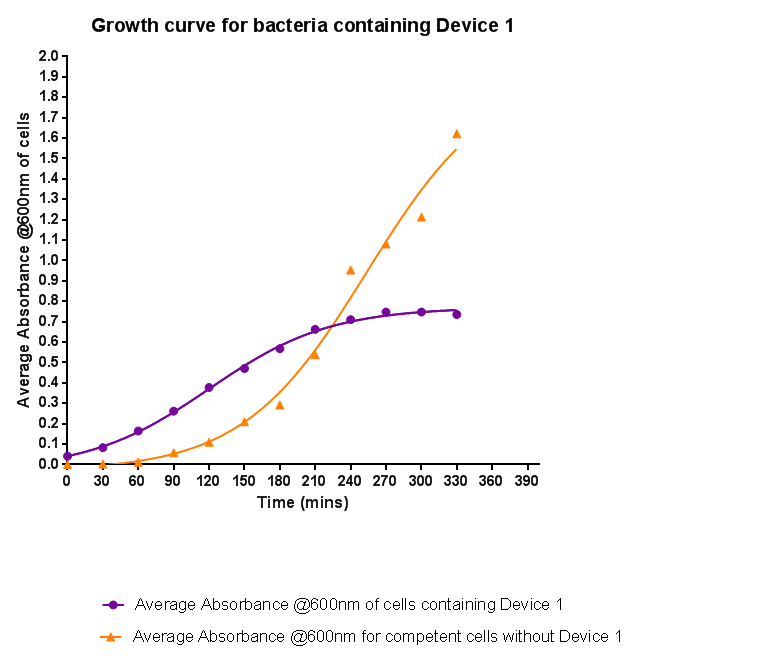
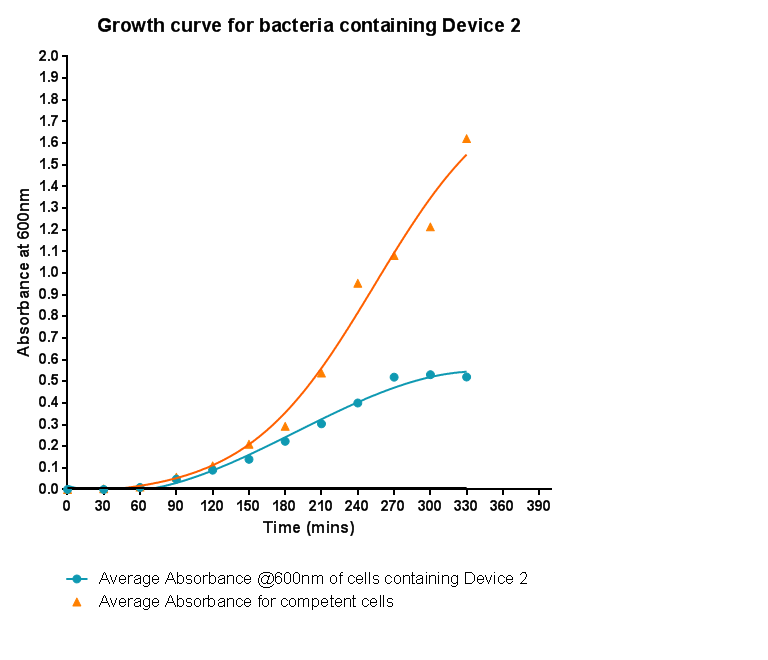
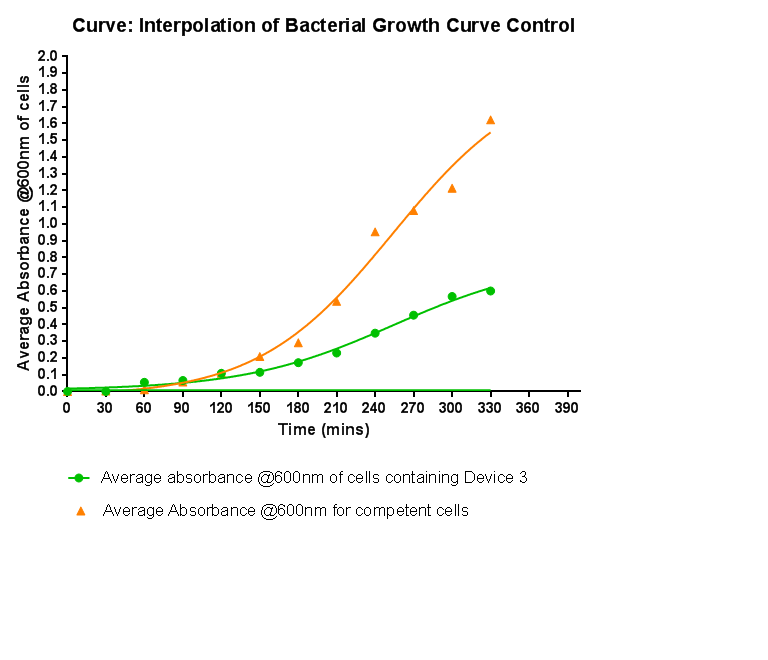
Bacterial growth curvesWe are monitoring the growth of our bacteria containing our devices to see if the genes we inserted have any effect on bacterial growth. Control Bacterial Growth CurveIn this experiment we used our chosen expression cells and monitored their growth on SB media both in the presence of chloramphenicol and without chloramphenicol. As the bacteria do not contain our plasmid that codes for chloramphenicol resistance, we didn't expect them to grow when it was present. The graph produced from the absorbance measurements taken over time, shows the growth of the bacteria. It has a clear lag and log phase when the bacteria are grown in SB media only. But as expected, the graph shows that the bacteria do not grow in the presence of chloramphenicol. This graph will be used as a control and other growth curves of bacteria containing our device will be compared to it in order to determine whether the genes we inserted cause an effect on cell growth.
Characterisation of Device 1
Growth Curve
Restriction Digests
Plate Imaging
Membrane Stress - Hydrophobic Stress
Membrane Stress - Changes in pH
Membrane Stress- Atomic Force Microscopy
Characterisation of Device 2Growth Curve
Restriction Digests
Plate Imaging
Binding assay-washing beads
Binding assay-Confocal Microscopy
Characterisation of Device 3
Growth Curve
Restriction Digests
Plate Imaging
Binding Assay-Beads cause fluorescence?
| |||||||
 |
| ||||||

| |||||||

| |||||||
 "
"
