"
"
Team:Evry/Model1
From 2013.igem.org
| (23 intermediate revisions not shown) | |||
| Line 5: | Line 5: | ||
<div id="mainTextcontainer"> | <div id="mainTextcontainer"> | ||
| - | <h1> | + | <h1>Duodenum model</h1> |
<h2>Overview</h2> | <h2>Overview</h2> | ||
<p> | <p> | ||
| - | + | Once our genetically modified bacteria are released in the duodenum, they produce siderophores to chelate the solved iron, thus making it unavailable for intestinal absorption. Then, <b>they eventually flush out of the duodenum</b>. The main hypothesis in this model is that the bacteria don't colonize the duodenum : they only flow through. <br/> | |
| - | + | ||
The goal of this model is to measure how efficient could this form of treatment be. Because too much parameters remain unknown, it is a theoretical simulation which will <b>not</b> give any numerical results. | The goal of this model is to measure how efficient could this form of treatment be. Because too much parameters remain unknown, it is a theoretical simulation which will <b>not</b> give any numerical results. | ||
</p> | </p> | ||
| + | <a id="Assumptions"></a> | ||
<h2>Assumptions</h2> | <h2>Assumptions</h2> | ||
| Line 31: | Line 31: | ||
<span style="color:#0000FF;">A</span> : Total quantity of iron absorbed by the duodenum (mol) | <span style="color:#0000FF;">A</span> : Total quantity of iron absorbed by the duodenum (mol) | ||
<br/> | <br/> | ||
| - | <span style="color:#FF0000;">S</span> : Quantity of | + | <span style="color:#FF0000;">S</span> : Quantity of solubilized iron (mol) |
<br/> | <br/> | ||
P : Total quantity of enterobactin produced by our population of bacteria (mol) | P : Total quantity of enterobactin produced by our population of bacteria (mol) | ||
| Line 43: | Line 43: | ||
The graph on the right explains the reasoning: for instance, the arrow with a + between N and P means that the variation of P has a positive linear term in N. | The graph on the right explains the reasoning: for instance, the arrow with a + between N and P means that the variation of P has a positive linear term in N. | ||
</p> | </p> | ||
| - | Where <img src="https://static.igem.org/mediawiki/2013/0/01/LogistiqueDuodenum.png" /> is our <a href="https://2013.igem.org/Team:Evry/LogisticFunctions">logistic function</a>.<br/> | + | Where <img src="https://static.igem.org/mediawiki/2013/0/01/LogistiqueDuodenum.png" /> is our <a href="https://2013.igem.org/Team:Evry/LogisticFunctions">logistic function</a> (which we will here abusively call activator).<br/> |
| - | <u>Parameters:</u><br/> | + | |
| + | |||
| + | <a id="Results"></a> | ||
| + | <h2>Results</h2> | ||
| + | <p> | ||
| + | |||
| + | |||
| + | |||
| + | <div class="captionedPicture" style="width:100%;"> | ||
| + | <a title="Absorption" href="https://static.igem.org/mediawiki/2013/4/44/Model_absorption_treatment.png"> | ||
| + | <img alt="Absorption" src="https://static.igem.org/mediawiki/2013/4/44/Model_absorption_treatment.png" class="Picture"/> | ||
| + | </a> | ||
| + | <div class="caption"> | ||
| + | <b>Figure 1 : </b> Iron Absorption in the duodenum with and without treatment. | ||
| + | </div> | ||
| + | </div> | ||
| + | <br/> | ||
| + | Figure 1 represent the iron absorbed by the duodenum during a meal. We can see the reduction of iron absorption in the duodenum | ||
| + | <br/> | ||
| + | <div class="captionedPicture" style="width:100%;"> | ||
| + | <a title="Quantity" href="https://static.igem.org/mediawiki/2013/0/07/Model_iron_treatment.png"> | ||
| + | <img alt="Quantity" src="https://static.igem.org/mediawiki/2013/0/07/Model_iron_treatment.png" class="Picture"/> | ||
| + | </a> | ||
| + | <div class="caption"> | ||
| + | <b>Figure 2 : </b> Iron in the duodenum during the simulation | ||
| + | </div> | ||
| + | </div> | ||
| + | <br/> | ||
| + | Figure 2 represent iron disolved in the chyme. This graph point out the influence of bacteria on the middle. The blue curve decrease significantly under the bacteria flux. That underline the fact that the treatment don't affect the absorption directly. | ||
| + | |||
| + | |||
| + | |||
| + | <br/><br/> | ||
| + | <u>Parameters:</u><br/><br/> | ||
| + | The simulations was made with following parameters:<br/> | ||
<table width="100%" border="1"> | <table width="100%" border="1"> | ||
<tr width="100%"> | <tr width="100%"> | ||
<th>Name</th> | <th>Name</th> | ||
<th>Value</th> | <th>Value</th> | ||
| + | <th>Unit</th> | ||
<th>Description</th> | <th>Description</th> | ||
<th>Reference</th> | <th>Reference</th> | ||
| Line 55: | Line 90: | ||
<td>alpha</td> | <td>alpha</td> | ||
<td>0.03</td> | <td>0.03</td> | ||
| - | <td>-</td> | + | <td>s-1</td> |
| + | <td>Duodenum absorption rate</td> | ||
<td>-</td> | <td>-</td> | ||
</tr> | </tr> | ||
<tr width="100%"> | <tr width="100%"> | ||
<td>v</td> | <td>v</td> | ||
| - | <td>0.007 m/s</td> | + | <td>0.007</td> |
| + | <td>m/s</td> | ||
<td>Chyme's flow average speed</td> | <td>Chyme's flow average speed</td> | ||
<td>[1]</td> | <td>[1]</td> | ||
| Line 66: | Line 103: | ||
<tr width="100%"> | <tr width="100%"> | ||
<td>L</td> | <td>L</td> | ||
| - | <td>0.3 m</td> | + | <td>0.3</td> |
| + | <td>m</td> | ||
<td>Duodenum length</td> | <td>Duodenum length</td> | ||
<td>[3]</td> | <td>[3]</td> | ||
| Line 73: | Line 111: | ||
<td>delta</td> | <td>delta</td> | ||
<td>2.65*10^-8</td> | <td>2.65*10^-8</td> | ||
| - | <td>-</td> | + | <td>mol-1</td> |
| + | <td>Dimensional parameter</td> | ||
<td>-</td> | <td>-</td> | ||
</tr> | </tr> | ||
<tr width="100%"> | <tr width="100%"> | ||
<td>Sp</td> | <td>Sp</td> | ||
| - | <td>4.5*10^-9 mol/s</td> | + | <td>4.5*10^-9</td> |
| + | <td>mol/s</td> | ||
<td>Iron pulse</td> | <td>Iron pulse</td> | ||
<td>[1]</td> | <td>[1]</td> | ||
| Line 85: | Line 125: | ||
<td>K</td> | <td>K</td> | ||
<td>100</td> | <td>100</td> | ||
| + | <td>mol/s</td> | ||
<td>Activator Magnitude</td> | <td>Activator Magnitude</td> | ||
<td>-</td> | <td>-</td> | ||
| Line 91: | Line 132: | ||
<td>p</td> | <td>p</td> | ||
<td>0.005</td> | <td>0.005</td> | ||
| + | <td>mol/s</td> | ||
<td>Value at zero of the activator</td> | <td>Value at zero of the activator</td> | ||
<td>-</td> | <td>-</td> | ||
| Line 97: | Line 139: | ||
<td>h</td> | <td>h</td> | ||
<td>10^-5</td> | <td>10^-5</td> | ||
| + | <td>-</td> | ||
<td>Activator efficiency</td> | <td>Activator efficiency</td> | ||
<td>-</td> | <td>-</td> | ||
| Line 103: | Line 146: | ||
<td>d</td> | <td>d</td> | ||
<td>10^-9</td> | <td>10^-9</td> | ||
| + | <td>mol</td> | ||
<td>Activator threshold</td> | <td>Activator threshold</td> | ||
<td>[2]</td> | <td>[2]</td> | ||
| Line 108: | Line 152: | ||
</table> | </table> | ||
| - | |||
| - | |||
| - | |||
| - | |||
| - | |||
| - | |||
</p><br/> | </p><br/> | ||
<p>There is a slight difference between the two cases, which would possibly allow us to fit the treatment to the patient's characteristics.</p> | <p>There is a slight difference between the two cases, which would possibly allow us to fit the treatment to the patient's characteristics.</p> | ||
| + | <a id="Conclusion"></a> | ||
<h2>Conclusion</h2> | <h2>Conclusion</h2> | ||
| Line 130: | Line 169: | ||
</ol> | </ol> | ||
</div> | </div> | ||
| + | |||
| + | <a href="https://static.igem.org/mediawiki/2013/2/2e/Duodenum.zip"> Download the model</a> | ||
</div> | </div> | ||
Latest revision as of 09:56, 26 October 2013


Duodenum model
Overview
Once our genetically modified bacteria are released in the duodenum, they produce siderophores to chelate the solved iron, thus making it unavailable for intestinal absorption. Then, they eventually flush out of the duodenum. The main hypothesis in this model is that the bacteria don't colonize the duodenum : they only flow through.
The goal of this model is to measure how efficient could this form of treatment be. Because too much parameters remain unknown, it is a theoretical simulation which will not give any numerical results.
Assumptions
- Our bacteria don't settle in the duodenum
- No regulation in the patient's iron absorption
- Constant iron flow
- Homogeneous fluid
- The bacterial quantity is constant
- The bacterial natural absorption is insignificant compared to the chelation
- The patient ingests 20mg of iron per day (Guideline Daily Amounts)
Model Description
 A : Total quantity of iron absorbed by the duodenum (mol)
S : Quantity of solubilized iron (mol)
P : Total quantity of enterobactin produced by our population of bacteria (mol)
Q : Total quantity of chelated iron (mol)
N : Number of bacteria

The graph on the right explains the reasoning: for instance, the arrow with a + between N and P means that the variation of P has a positive linear term in N.
Where is our logistic function (which we will here abusively call activator).
Results
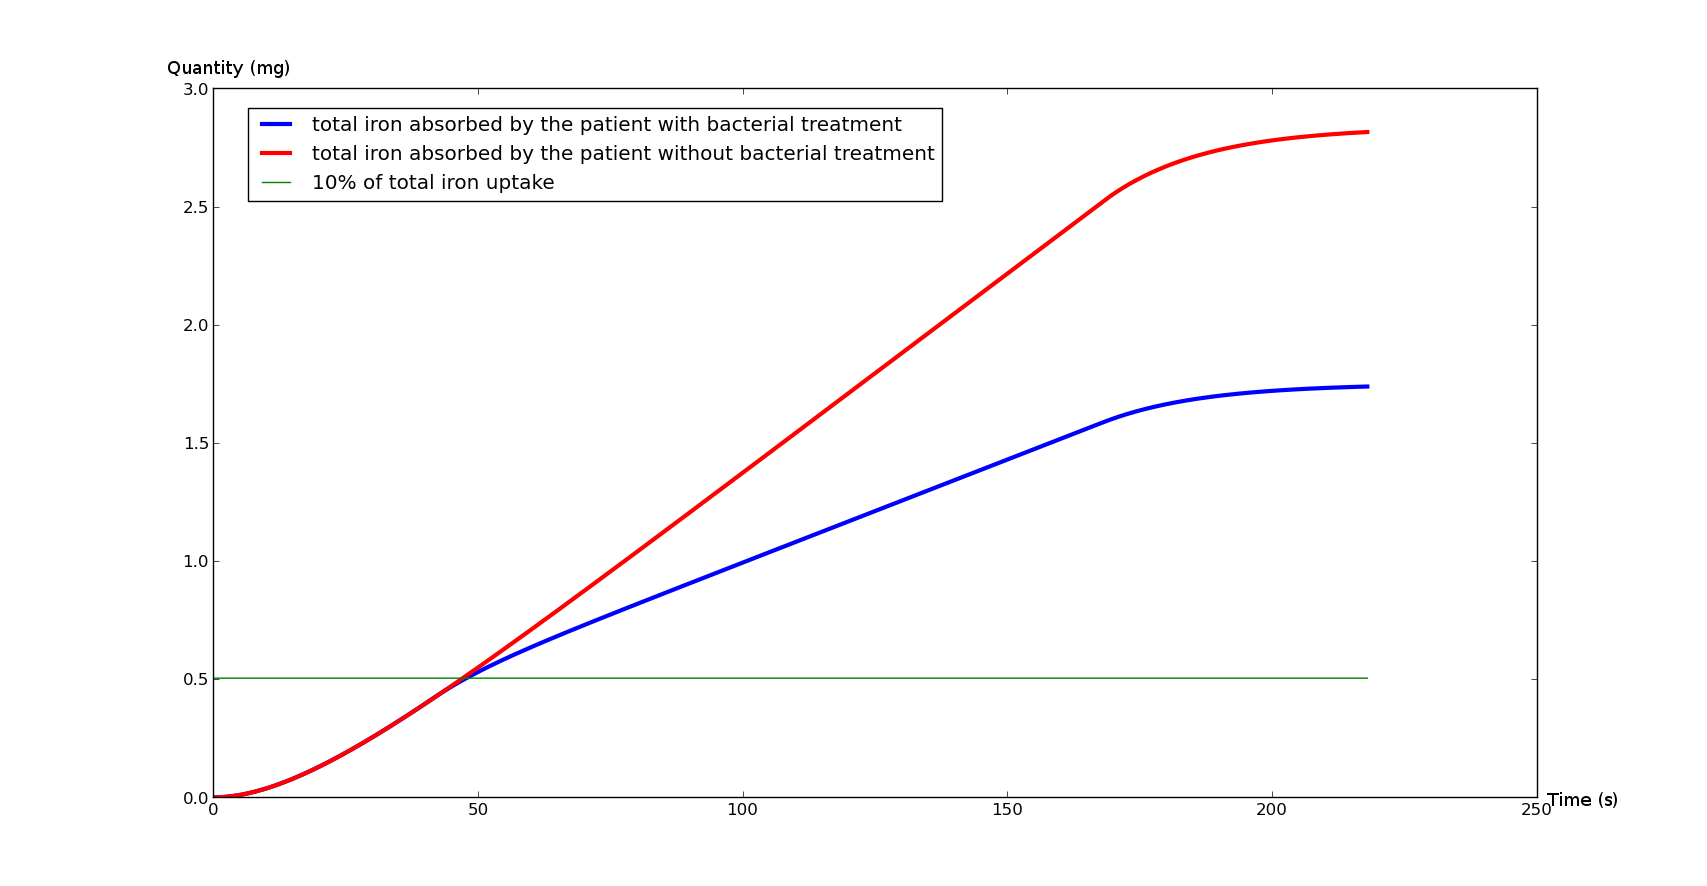
Figure 1 represent the iron absorbed by the duodenum during a meal. We can see the reduction of iron absorption in the duodenum

Figure 2 represent iron disolved in the chyme. This graph point out the influence of bacteria on the middle. The blue curve decrease significantly under the bacteria flux. That underline the fact that the treatment don't affect the absorption directly.
Parameters:
The simulations was made with following parameters:
| Name | Value | Unit | Description | Reference |
|---|---|---|---|---|
| alpha | 0.03 | s-1 | Duodenum absorption rate | - |
| v | 0.007 | m/s | Chyme's flow average speed | [1] |
| L | 0.3 | m | Duodenum length | [3] |
| delta | 2.65*10^-8 | mol-1 | Dimensional parameter | - |
| Sp | 4.5*10^-9 | mol/s | Iron pulse | [1] |
| K | 100 | mol/s | Activator Magnitude | - |
| p | 0.005 | mol/s | Value at zero of the activator | - |
| h | 10^-5 | - | Activator efficiency | - |
| d | 10^-9 | mol | Activator threshold | [2] |
There is a slight difference between the two cases, which would possibly allow us to fit the treatment to the patient's characteristics.
Conclusion
It is possible to significantly reduce intestinal iron intake if the patient takes one pill before or during each meal. This means that the patient would endure a lighter treatment : less bloodletting for people suffering from hemochromatosis, and less iron chelator's side effects for the thalassemia.
References:
- Calculated from : Computational Modeling and Simulation of the Human Duodenum - B. Hari, S. Bakalis, P. Fryer - 2012
- http://onlinelibrary.wiley.com/doi/10.1016/S0168-6445%2803%2900055-X/pdf p.217
- Wikipedia