 "
"
Team:Freiburg/Notebook/modeling
From 2013.igem.org
Novemberkind (Talk | contribs) |
|||
| Line 109: | Line 109: | ||
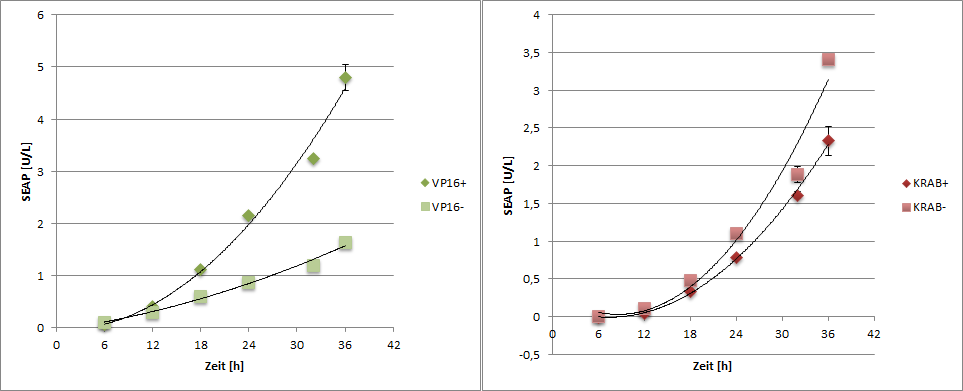
Results | Results | ||
</p> | </p> | ||
| - | + | <img class="imgtxt" src="https://static.igem.org/mediawiki/2013/b/b1/Freiburg2013_modelling_seap.png"> | |
<div> | <div> | ||
Revision as of 01:39, 5 October 2013


Modeling Notebook
65000 cells per well were seeded. 24 h before transfection.
The cells had been transfected at 21:30 h.
| |
| Figure 1: Transfection Scheme Cells were transfected with dCas9-VP16 (transfection one) or dCas9-KRAB (transfection 3). As controll we used .... (trandfection 3 and 4). |
To generate time dependent data, one well was treated every 6 h.
t0= 01:30
t1= 07:30
t2= 13:30
t3= 19:30
t4= 01:30
t5= 07:50
t6= 13:30
Every timepoint the supernant was taken for SEAP measurement and the cells were lysated with RIPA buffer for quantitative western blotting.
The standard western blot procedure was done with 20 µl of the cell lysates.
For quantification of the western blot data, a dot blot was done. A serial dilution of anti-HA (200ng/µl)was prepared.
1:100, 1:200, 1:400, 1:800, 1:1600, 1:3200, 1:6400
After PVDF-membran activation in methanol and a short incubation in tranfer buffer, 2 µl of each dilution have been droped onto the membrane. After that the membrane was indubated at room temerature (1h) for drying.
The detection with the secondary anti-body was done similar to the treatment of the dCas9 blots.
Results
 |
| Figure 2: Western Blot The dCas9 fusion protein possesses a HA-tag and could so be detectet with an anti-HA antibody. The first two blots show dCas9-KRAB. The particular timepoints are labelled above the band. The same pertains for the two dCas9-VP16 blots. As negative control (c), the lysate of timepoint 6 of transfection 3 and 4 has been used. |
 |
| Figure 3: Dot Blot The dots are labelled with their ditution rate. Only the labelled dots were used for quanitfication. The blots of the first line have been illuminated under the same conditions as the dCas9-KRAB blots, the one of the second line under conditions as the dCas9-VP16 blots. |
For the quatification, the dot intensity has been analysed with Image J. The data was used to generate a calibaration curve. The intesitys of the dCas9 bands were compared with the calibration curve, so that the amount of dCas9 per band could be defined.