 "
"
Team:Imperial College/Waste Degradation: SRF
From 2013.igem.org


Resourceful Waste
The mixed waste produced from materials recovery facilities is currently disposed of by incineration, causing harm to the environment and health. It also wastes the resources present, many of which are non-renewable. We have developed a system to produce the valuable bioplastic P3HB, from this waste. To utilise the plastics in the mixed waste we have expanded the range of plastic degradation parts in the registry, expressing Polyurethane esterases which break down polyurethane to produce the platform chemical ethylene glycol, which can be filtered off and sold. Once the oil based plastics have been removed, E.coli transformed with the phaCAB operon from Ralstonia eutropha will produce P3HB from the remaining waste material. In this way, the mixed can be used to produce commodities.
Overview
Petrochemical Plastic degradation
It is known from previous research that some lignin degrading microbial enzymes to be so tough that they can even deal with more difficult polymers: plastics. Some previous iGEM teams have exploited this and worked on enzymatic degradation of various kinds of plastic. We would like to build on this work and extend the plastic degradation capabilities of the synthetic biology community by improving PUR degradation in particular as this has not been successfully achieved before. We have identified 5 PUR-esterase enzymes from the literature that are capable of catalyzing the below reaction.
Pathway of PUR hydrolysis:

We have synthesised all of the genes in the below table and are testing them for expression in E.coli, secretion, activity and PUR degradetion capabilities. Our ultimate design is to be able to control the relative levels of different enzymes in waste degrading bio-reactor in order to adjust it to the composition of waste. Therefore we designed the expression constructs accordingly. Our models predict the degradation rate of PUR at the bioreactor scale.
| enzyme | source organism | biobrick | reference |
|---|---|---|---|
| EstCS2 | uncultured unknown bacterium (GU256649.1) | [http://parts.igem.org/Part:BBa_K1149002 BBa_K1149002] | [http://www.microbialcellfactories.com/content/10/1/41 Kang et.al 2011] |
| pueA | Pseudomonas chlororaphis | [http://parts.igem.org/Part:BBa_K1149003 BBa_K1149003] | [http://onlinelibrary.wiley.com/doi/10.1111/j.1574-6968.2000.tb09056.x/pdf Stern et al., 2000] |
| pueB | Pseudomonas chlororaphis | [http://parts.igem.org/Part:BBa_K1149004 BBa_K1149004] | [http://www.sciencedirect.com/science/article/pii/S0964830501000427 Howard et al., 2001] |
| pudA | Comamonas acidovorans | [http://parts.igem.org/Part:BBa_K1149005 BBa_K1149005] | [http://www.sciencedirect.com/science/article/pii/S0964830598000663 Allen et al. 1999] |
| pulA | Pseudomonas fluorescens | [http://parts.igem.org/Part:BBa_K1149006 BBa_K1149006] | [http://www.sciencedirect.com/science/article/pii/S0964830598000687 Vega et al., 1999] |
Bioplastic Synthesis
Poly-3-hydroxybutyrate(P3HB) is a bioplastic which is naturally produced inside bacteria such as Ralstonia eutropha, where it accumulates as globules inside the cell. In its native bacteria it is produced as an energy store(1) but it is as a plastic that it interests researchers and industrialists.
We have made P3HB in E.coli, transferring three genes, naturally found in Ralstonia eutropha into E.coli MG1655. These encode the three enzymes necessary for P3HB production; polyhydroxyalkanoate synthase(phaC), 3-ketothiolase(phaA) and acetoacetyl coenzyme A reductase(phaB). These are encoded by the phaCAB operon. We have altered the expression of these three genes to maximise the production of P3HB as high yields are required for it to be economically viable.
http://www.igem.org/wiki/images/f/f3/Reaction_phaC.jpg
Specification
1. The bacteria should survive and grow in mixed waste
In order for the bacteria to produce bioplastic from the mixed waste they first need to be able to use it as a carbon source
2. The bacteria should secrete a functional polyurethane esterase
To recover the resources from polyurethane in the mixed waste, the enzymes should secrete in an active form.
3. Our Bacteria should be able to tolerate mixed waste degradation products, such as Ethylene Glycol
The products of Polyurethane degradation are toxic and so any bacteria growing with them must be able to survive to a concentration which will allow economical production of ethylene glycol. We have chosen a strain of E.coli-MG1655, which is resistant to ethylene glycol toxicity.
4. The bacteria should produce P3HB
Modelling: P(3HB) synthesis module
This section is about modelling the plastic-synthesising E.coli developed in our project. The plastic that this module synthesises is the bioplastic poly-3-hydroxybutyrate, also known as P(3HB). The content below shows the process of building, designing and optimisation of the model. Also, the considerations, assumptions and limitations will be discussed.
Specifications for the model
- Input = monomer (3HB)
- Output = polymer (P(3HB))
Deterministic model
The model was built and simulated in Simbiology, a Matlab package designed for modelling biological systems. In our model we have a compartment (labelled "E. coli_1") that represents our engineered cell. The compartment contains the reactions and species that interact with the polymer synthesis pathway.
The pathways on the right half of the cell are genetic expressions of the 3 enzymes involved in the plastic synthesis pathway. The pathways on the left represent the actual P(3HB) production pathway.


ODEs in Matlab Simbiology model
Genetic regulations and expressions
BDH2 (3-hydroxybutyrate dehydrogenase)


PhaB (Acetoacetyl-CoA reductase)and PhaC (P(3HB) synthase)


Values, sources and assumptions
| Parameter | Description | Value | Units | Sources | Assumptions |
|---|---|---|---|---|---|
| β | maximum rate of transcription | 0.032 | mM/min | Please see derivation 1 below. | Please see derivation 1 below. |
| n | Hill coefficient | 2.0 | dimensionless | [http://parts.igem.org/Part:pSB1C3?title=Part:pSB1C3] | Rounded to 2.0 from 2.26 as Simbiology wouldn't allow a non-integer value for such parameter. |
| K | Activation coefficient | 0.0031 | mM | [http://parts.igem.org/Part:BBa_K206000:Characterization] | Taking the "switch point" as the activation coefficient |
| dmRNA | mRNA degradation rate | 0.10 | 1/min | [http://www.ncbi.nlm.nih.gov/pmc/articles/PMC420366/pdf/07X.pdf] | Taking the value of mRNA half-life in E.coli strain MG1655 as 6.8min. rate = ln2/half-life = ln2/6.8 = 0.10 |
| dprotein | Protein degradation rate | 0.050 | 1/min | [http://jb.asm.org/content/189/23/8746.full] | There is no active degradation pathway and that dilution is the dominant way by which the protein level decreases in a cell. Rate = 1/doubling time, where doubling time = 20min. Assuming steady-state growth in LB broth as presented in paper. |
| k2 | Protein production rate (BDH2) | 4.7 | 1/min | Please see derivation 2 below. | Please see derivation 2 below. |
| k3 | Protein production rate (PhaCB) | 0.58 | mM/min | Please see derivation 3 below. | Please see derivation 3 below. |
| [Arabinose] | Concentration of arabinose | Initial: 0.008 | mM | ||
| [mRNA] | Concentration of mRNA | - | mM | - | - |
| [BDH2] | Concentration of BDH2 | - | mM | - | - |
| [PhaB] | Concentration of PhaB | - | mM | - | - |
| [PhaC] | Concentration of PhaB | - | mM | - | - |
1.Derivation of the maximal expression rate,β
- Average molecular weight (Mw) of a base pair = 660g/mol[http://www.geneinfinity.org/sp/sp_dnaprop.html][http://www.lifetechnologies.com/uk/en/home/references/ambion-tech-support/rna-tools-and-calculators/dna-and-rna-molecular-weights-and-conversions.html]
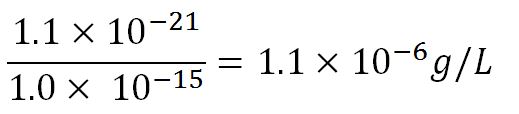
- Average mass of a base pair = 660g/mol x 1.66x10-24 = 1.1x10⁻²¹g
- Volume of an E.coli cell = 1µm3[http://kirschner.med.harvard.edu/files/bionumbers/fundamentalBioNumbersHandout.pdf] = 1x10-15L
- ∴Mass concentration =
- ∴Molar concentration of 1 base pair in the volume of E.coli =
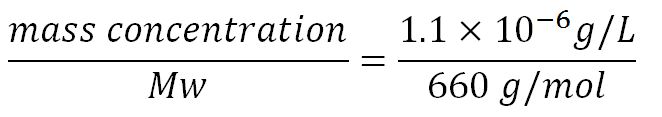 = 1.66x10⁻⁶ mM
- ∴Mass concentration =
- BioBrick assembly plasmid pSB1C3 is a high copy number plasmid (100-300 copies per cell)[http://parts.igem.org/Part:pSB1C3?title=Part:pSB1C3]
- assume 200 copies per cell
- ∴ concentration of the gene per cell = N x 200 x 1.66x10-6mM, where N = number of base pairs
- ∴ concentration of the gene BDH2 (N = 768) in the volume of an E.coli cell is = 0.25mM
- Transcription rate in E.coli = 80bp/s[http://kirschner.med.harvard.edu/files/bionumbers/fundamentalBioNumbersHandout.pdf] = 80 x 1.66x10-6mM/s = 80 x 1.66x10-6 x 60mM/min = 7.97x10⁻³mM/min
- ∴ Rate of mRNA_BDH2 production under the control of pBAD = 7.97x10⁻³ ÷ 0.25 = 0.032/min

2.Protein production rate of BDH2, k2
- Average molecular weight(Mw) of an amino acid(aa)= 110g/mol[http://www.genscript.com/conversion.html][http://www.promega.com/~/media/Files/Resources/Technical%20References/Amino%20Acid%20Abbreviations%20and%20Molecular%20Weights.pdf]
- Average mass of an amino acid = 110g/mol x 1.66x10-24=1.83x10⁻²²g/L
- ∴Mass concentration of one aa in the volume of an E.coli =
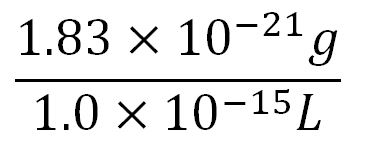 = 1.83x10⁻⁶g/L
- ∴Molar concentration of one aa =
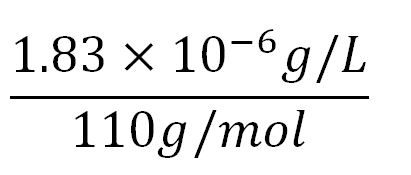 = 1.66x10⁻⁵mM
- ∴Mass concentration of one aa in the volume of an E.coli =
- Translation rate = 20aa/s = (20 x 1.66x10-5 x 60)mM/min = 0.020mM/min
- BDH2 comprises of 256aa[http://www.uniprot.org/uniprot/Q2PEN2&format=html]
- ∴concentration of BDH2's aa in the volume of an E.coli = 1.66x10-5mM x 256 = 4.25x10⁻³mM
- ∴ Rate of protein production = 0.020 ÷ 4.25x10-3 = 4.7/min


3.Protein production rate for PhaB and PhaC, k3
- Relative promoter strengths: J23104 = 1.3RPU, J23101 = 1.0RPU.
- ∴ 104 is 1.3x stronger than 101.
- In absolute units: take GFP synthesis rate (molecules per min per cell) and approximate that as a generic protein synthesis rate for the promoter.
- GFP synthesis rate of 101 = 2232 molecules per min per cell.
- ∴ GFP synthesis rate of 104 = 1.3 x 2232 = 2902 molecules per min per cell
- Assume 1 molecule in an E.coli cell gives a concentration of 1nM.
- ∴ GFP synthesis rate of 104 = 2902 x 1nM = 2.9x10⁻⁶nM/min per cell
- Plasmid copy number assumed as 200 (as in derivation 1)
- ∴ GFP synthesis rate of 104 in our E.coli = 200 x 2.9x10-6 = 0.00058nM/min = 0.58mM/min
Enzyme kinetics
BDH2 (3-hydroxybutyrate dehydrogenase)
atoAD (Acetyl-CoA:acetoacetyl-CoA transferase (α and β subunits))
phaB (Acetoacetyl-CoA reductase)
phaC (P(3HB) synthase)
Simulation results
P(3HB) production
Model-guided design and optimisation
Sensitivity analysis: species concentrations
What is sensitivity analysis and why do it?
In order to look at how we could increase the production of P(3HB) we decided to run a sensitivity analysis (also in Simbiology) to identify what species in the model P(3HB) is sensitive to, given the specific conditions with which we set the model. In other words, we calculated the time-dependent sensitivity of P(3HB) with respect to the initial conditions of other species (species formed along the synthesis pathway and enzymes involved).[http://www.mathworks.co.uk/help/simbio/ug/calculating-sensitivities.html#brbumlr|ref]
For a species x, whose concentration depends on time, it can be expressed as x(t). To calculate the sensitivity of x(t) with respect to another species y(t), the sensitivity with normalisation relative to the numerator x(t) can be calculated as:

Therefore, the underlying algorithm for this sensitivity analysis of P(3HB) is:


Scan with different levels of PhaB
The plot below is to show that increasing PhaB concentration within the engineered organism would have a positive effect on the concentration of the P(3HB) synthesised. As so many parameters within the model were taken from different sources, it would be difficult to give a simulation plot that is accurate quantitatively. It was decided to show the single cell simulation for this because the scans were carried out up to the doubling time of 20mins, hence avoided the issue of scaling-up which would have otherwise subjected the simulation to more errors. Therefore, this plot should be interpreted from a qualitative perspective and the trend should be observed.

Difference between promoter expressions after optimisation
Metabolic considerations
The metabolic model predicts the interaction of our pathway with endogenous pathways. In synthetic biology, an ideal system is fully orthogonal. However, it can be the case, such as here that coenzymes are needed for the reaction steps in a metabolic pathway. When we realised that our pathway uses a lot of Co-A, we constructed a model to see how this can be recycled and predict whether it would negatively effect the chassis. Tell that the Co-A is regenerated at the same speed as it is used and therefore there is not a huge amount of Co-A "stuck" in the pathway at any one time. (Bobby, how much Co-A is that exactly?) This informed us about that the cells should be able to bear the burden of the pathway.
Metabolic model to optimise PHB production. Tell us how you predicted that phaB is the key enzyme and justify why the increase in enzyme level will increase the amount of PHB. This informed our design and we are changing the promoter in front of the phaCAB operon. Tell that if we can predict that it would be useful to downregulate any genes in the native metabolism of E.coli.
Effect on growth and interference with metabolism
Initial concentrations of metabolites
Synthesis model scaled up and what that means for industrial implementation and MAPLE.
Design
Polyurethane Degradation
Gene expression: PUR degradation constructs
Inducible promoters, His and Flag tags for western, GFP in operon .
later, these enzymes can be combined

Secretion
align="justify">E.coli is commonly used as a chassis in innovative iGEM project that aim to prove the concept and make the case for a novel function in a biologically engineered machine. In our case, we aim to degrade and synthesise plastic and the degradation part of our system needs to be extacellular. There are not only such biotechnological but also many other reasons for the extracellular targeting of a protein: It can be a product with a medical function, like the [http://www.2009.igem.org/Team:METU-Gene/EGF_Transportation EGF hormone in a previous iGEM project] or be important in bioremediation such as in Dundee Team’s toximop system and much more. There are many strategies for secretion. On the following page, you can read about these and find out why we chose the pelB tag for all our degradation enzymes and how we improved the ESTCS2 esterase by changing the phoA outer-membrane anchoring tag in the original Biobrick to pelB. Our story will help you to choose a secretion strategy best suited to your project and also give you guidance with the technical details of using it.
Alternative strategies for protein secretion in E.coli:
N terminal secretion-signal peptides are recognised by the sec pathway . The pathway transports to the periplasm and additional mechanism are usually necessary to further export the protein to the extracellular space. An approach for using this pathway is the addition of an N terminal signal peptide to the target protein which can obtain as high as 90% efficiency in secretion to the extracellular space. Such signals are pelB and phoA tags which are available as biobricks. PelB can get cleaved off by pelB peptidase in the periplasm but phoA will anchor your protein to this localisation.
Fusion partners are endogenous proteins that naturally get secreted in E.coli and can be fused to the target protein. Some such proteins were demonstrated to be a powerful carriers of medically relevant human proteins in E.coli. The yebF and ompF proteins exit the cell via the sec pathway and use additional mechanism for leaving the periplasm where they interact with outer-membrane porins for extracellular secretion. The osmY is available as a Biobrick and we have submitted ompF this year.
The porin proteins such as ompF and ompA, can be used as fusion partners too and anchor proteins to the outer surface of E.coli.
ABC transporters use ATP for transport of specific proteins across the bacterial membrane. The ABC transporter of Erwinia chrysanthemi can be expressed in E.coli and export proteins that contain the LARD1 domain as a C terminal fusion. The system is biobricked in two separate plasmids (transporter, LARD1) with different antibiotic resistance and it is important to use both at the same time.
The [http://parts.igem.org/Protein_domains/Localization page] in the registry that lists localisation tags] is incomplete and contains eukaryotic and prokaryotic localisation signals mixed together. We have therefore put together the tables below for you to help choose an E.coli secretion strategy that is suitable for your project.
</p>
Extracellular Secretion in E.coli:
| Description | Biobrick | Team | |
|---|---|---|---|
| pelB | type II secretion signal peptide, cleaved off in periplasm | BBa_K208004 BBa_K1149022 BBa_K208004 BBa_J32015 | lots eg. Imperial 2013 |
| yebF | large fusion-protein, Sec-pathway and additional mechanism | BBa_K1149001 | Imperial 2013 |
| osmY | large fusion-protein, Sec-pathway and additional mechanism | BBa_K892008 | Washington 2012 |
| LARD 1 | Lipase ABC transporter recognition domain | BBa_K258001 | METU-GEne 2009 |
Outer Membrane Anchors and Periplasmic Expression in E.coli:
| Description | Biobrick | Team | |
|---|---|---|---|
| ompF | porin protein that can be fused to a protein, anchors to outer membrane | BBa_K864204 | Uppsala 2012 |
| ompA | porin protein that can be fused to a protein, anchors to outer membrane | BBa_K103006 | Wasraw 2008 |
| INP | short domain,anchors in periplasm | BBa_K523013 (INP-YFP) BBa_K632002 (INP-Silicatein) | Minnesota 2011 Edinburgh 2011 |
| torA | anchors in periplasm | Dundee 2013 | |
| phoA | tag for sec pathway, anchors to OM | BBa_K808028 | Darmstadt 2011 |
Our choice is to use the pelB secretion tag as it has been demonstrated to work in many cases with sometimes as high as 90% transport efficiency. The pelB has been used in iGEM project for many years and is part of 50+ constructs. The UC-Davis team last year used it to secrete LC-Cutinase, a PET plastic degrading enzyme ( BBa_K936013) successfully which is somewhat similar to our plastic degradation enzymes.
Assembly methods and toolkit:
An advantage of the pelB is that it is relatively short (only 66 BP) and we could get our gene synthesised with the tag. A problem with standard biobrick assembly is that the scar site contains a STOP codon and therefore [http://parts.igem.org/Protein_domains alternative strategies are needed]. One of the ways around this is to use Infusion/Gibson assembly which we also had a go with and you can find instructions under our protocols section. We have constructed a biobrick where LARD1 is after a constitutive promoter and RBS in order to facilitate quicker cloning with less assembly steps, [http://parts.igem.org/Part:BBa_K1149021 BBa_K1149021].
Unfortunately, the pelB tag did not prove to be the best strategy for secreting our degradation enzymes in the MG1655 strain. Therefore, we are changing the strategy to use osmY.
References
- Economou A. Following the leader: bacterial protein export through the Sec pathway. Trends in microbiology 1999;7(8) 315-320.
- Thanassi DG, Hultgren SJ. Multiple pathways allow protein secretion across the bacterial outer membrane. Current opinion in cell biology 2000;12(4) 420-430.
- Sletta H, Tondervik A, Hakvag S, Aune TEV, Nedal A, Aune R, et al. The presence of N-terminal secretion signal sequences leads to strong stimulation of the total expression levels of three tested medically important proteins during high-cell-density cultivations of Escherichia coli. Applied and Environmental Microbiology 2007;73(3) 906-912.
- Qian Z, Xia X, Choi JH, Lee SY. Proteome-based identification of fusion partner for high-level extracellular production of recombinant proteins in Escherichia coli. Biotechnology and bioengineering 2008;101(3) 587-601.
- Prehna G, Zhang G, Gong X, Duszyk M, Okon M, McIntosh LP, et al. A Protein Export Pathway Involving Escherichia coil Porins. Structure 2012;20(7) 1154-1166.
- Binet R, Letoffe S, Ghigo JM, Delepelaire P, Wandersman C. Protein secretion by Gram-negative bacterial ABC exporters - A review. Gene 1997;192(1) 7-11.
- Chung CW, You J, Kim K, Moon Y, Kim H, Ahn JH. Export of recombinant proteins in Escherichia coli using ABC transporter with an attached lipase ABC transporter recognition domain (LARD). Microbial Cell Factories 2009;8 11.
- Francetic O, Pugsley AP. Towards the identification of type II secretion signals in a nonacylated variant of pullulanase from Klebsiella oxytoca. Journal of Bacteriology 2005;187(20) 7045-7055.
- Fu LL, Xu ZR, Li WF, Shuai JB, Lu P, hu CXH. Protein secretion pathways in Bacillus subtilis: Implication for optimization of heterologous protein secretion. Biotechnology Advances 2007;25(1) 1-12.
- Cho HY, Yukawa H, Inui M, Doi RH, Wong SL. Production of minicellulosomes from Clostridium cellulovorans in Bacillus subtilis WB800. Applied and Environmental Microbiology 2004;70(9) 5704-5707.
- Zhang XZ, Cui ZL, Hong Q, Li SP. High-level expression and secretion of methyl parathion hydrolase in Bacillus subtilis WB800. Applied and Environmental Microbiology 2005;71(7) 4101-4103.
Tolerance to waste
We chose the MG1655 E.coli strain as chassis because it constitutively expresses genes that make it resistant to the potentially toxic molecule. The [http://parts.igem.org/Part:BBa_K892010 AldA] and [http://parts.igem.org/Part:BBa_K892009 FucO] genes have an important role in decreasing the toxic effects of Ethylene-glycol by converting it into Glycolaldehyde which is a link to the cell`s central metabloism. We have received these genes from the registry and future work could be to express these in Bacillus or cellulose degrading organisms to make them tolerant as well.
PHB synthesis Design
We will first use the phaCAB biobrick [http://parts.igem.org/Part:BBa_K934001 BBa_K934001] to produce P3HB. Our aim is the industrial production of P3HB and this require high yields to be economically viable. The results from the metabolic model suggest that to do this the amount of phaB should be increased. To do this we designed constructs with stronger promoters to upregulate the expression of the operon.
The operon was original under the native promoter from Ralstonia eutropha. We designed two promoters to increase transcription. The first uses the constitutive promoter [http://parts.igem.org/Part:BBa_J23104 J23104]. The second was designed as a hybrid promoter incorporating BBa_J23104 and the original promoter due to recent results of high expression from a hybrid promoter[http://www.plosone.org/article/info%3Adoi%2F10.1371%2Fjournal.pone.0056321].

Assembly: Adding better promoter and RBS to phaCAB operon
We made two new improved constructs by modifying the native operon:
<p> The modellers in the drylab predicted that an increased level of phaB enzyme will increase the amount of PHB produced and therefore we decided to change the native Ralstonia eutropha promoter and RBS to a strong constitutive E.coli promoter (J23104) and RBS (0034) in front of the operon. We have succeeded with the swap and built the new biobrick [http://parts.igem.org/Part:BBa_K1149052 BBa_K1149052] which we refer to as constitutive phaCAB. In parallel, we have also assembled a different configuration of transcription initiation region: the "hybrid". Surprisingly, our results show that the "hybrid" phaCAB construct [http://parts.igem.org/Part:BBa_K1149051 BBa_K1149051] if highly efficient at producing bioplastic. Please read on to discover more.We tested the promoter and RBS we were going to use by cloning them in front of amilCP blue chromoprotein ([http://parts.igem.org/Part:BBa_K1149020 BBa_K1149020]). It was bright blue and we had some fun playing around with it as part of our communication work "E.coli Art".

In order to change the promoter, we designed a forward primer that binds to the beginning of the first gene in the operon and contains a Xba restriction site: Pha_Fw (cgcttctagagatggctactgggaaaggagccg). We used pha_Fw and the suffix primer G1005 primer pain to amplify the insert out of the backbone. The new promoter and RBS were J23104 and B0034 from the biobrick [http://parts.igem.org/Part:BBa_K608002 BBa_K608002] We digested the pSB1C3 backbone with this biobrick with SpeI and PstI.
Summary diagram of construction steps:

We performed DpnI digest on the gel purified PCR product (insert) in order to get rid of any contamination from the original plasmid. We did Alkaline Phosphatase treatment of the backbone to remove terminal phosphates in order to decrease self-ligation of plasmid. We transformed the ligation into NEB5 cells and we grew overnight cultures from single cell colonies. The next day, we purified the plasmids and digested 200 ng of them with Xba and PstI to screen for the right clones:

Colony #8 had the expected 4.2kB insert and therefore we sent this plasmid for sequencing. After having the sequenced it, we submitted the new part to registry as [http://parts.igem.org/Part:BBa_K1149051 BBa_K1149051]. At the sequencing step, we realised that it has double P+RBS since the native P+RBS stayed there in between the new P+RBS and the operon. Anyhow, this hybrid configuration should increase the amount of protein products from the genes in the operon and we are in the process characterizing and testing our new construct. We have identified a clone (from colony #6) that contains the new constitutive promoter and submitted it as [http://parts.igem.org/Part:BBa_K1149052 BBa_K1149052] biobrick. We are testing both the hybrid and normal constitutive constructs for PHB bioplastic production.
Partial sequence of the constitutive phaCAB construct ([http://parts.igem.org/Part:BBa_K1149052 BBa_K1149052]):

Partial sequence of the hybrid phaCAB construct ([http://parts.igem.org/Part:BBa_K1149051 BBa_K1149051]):

Results
E.coli MG1655 containing the PhaCAB construct accumulates the bioplastic PHB inside its cells as illustrated in the figure below. A control strain with a plasmid containing the BBa_J23104 promoter and BBa_B0034 ribosome binding site and the strain containing PhaCAB were grown on plates with Nile Red stain in the media. Nile Red binds to the membranes surrounding the PHB and fluoresces.

Figure x. More intense fluorescence is seen for J and S which contain phaCAB and phaCB respectively. These operons allow them to produce the bioplastic PHB. PHB is stained by Nile Red which fluoresces when the plate is imaged at 473nm.

The improved biobrick:
PUR Esterase enzyme activity
Since the PUR Esterases were not secreted, initially the cells were lysed to obtain crude cell extracts in order to test whether the enzymes were functional. The Western Blot results showed that the constructs EstC2 [http://parts.igem.org/Part:BBa_K1149002 BBa_K1149002], PueB [http://parts.igem.org/Part:BBa_K1149004 BBa_K1149004] and PulA [http://parts.igem.org/Part:BBa_K1149006 BBa_K1149006] were being expressed. The cultures expressing these three constructs were grown, resuspended in 100 mM potassium phosphate buffer, lysed by sonication and utilised in a colourimetric assay with the substrate analog para-Nitrophenyl butyrate. The data shows that PUR ESTC2 (linkBB) is definitely active.
para-Nitrophenyl butyrate (p-NP) is commonly used to indicate an enzyme’s esterase activity. The enzyme cleaves the ester bond and releases the 4-nitrophenol (4-NP), thus causing a colour change from colourless to yellow and an increased absorbance at wavelength 405 nm.

The assay was run in the [http://www.eppendorf.com/int/index.php?sitemap=2.1&action=products&contentid=1&catalognode=87236 Eppendorf BioSpectrometer] was used to automatically read the absorbance of the reaction mixture every 30 seconds. The concentration of 4-Nitrophenol produced from the reaction was calculated using the Beer-Lambert Law; the extinction coefficient of 4-NP is 18,000 M-1 cm-1 at 405 nm. [1]
The results below show the concentration of 4-NP produced by the three different PUR esterases and compare them to the Empty Vector and Substrate alone as negative controls.


The above graphs clearly show that PUR Esterase EstC2 is active and cleaving p-NP. The recorded concentrations of 4-NP, in the presence of this PUR Esterase, are much greater than with the Empty Vector or the Substrate alone. Is PUR Esterase EstC2 active? Yes!


The enzymes expressed by both PueB and PulA do not appear to have esterase activity for this substrate. There is a tiny increase in 4-NP concentration for PueB, PulA, Empty Vector and Substrate alone. This probably indicates that the substrate is slowly degrading by itself. Other constituents of the cell lysates are likely to be causing a slight increase in p-NP degradation, as PueB, PulA and Empty Vector show higher concentrations of 4-NP than the Substrate alone, but are all have very similar concentrations to each other.
Protocols

LB-Agar Plates containing Nile Red stain
Nile Red final concentration in media should be 0.5µg/ml
- After autoclaving 300ml of LB-Agar, add 600µl Nile Red solution(0.25mg/ml DMSO)
- Add 150µl chloramphenicol
- Pour plates in a clean fume cupboard
Nile Red Culture staining
Nile Red final concentration should be 20µg/ml media
Add 320µl to 4 ml overnight culture and incubate for 30mins at room temp.
Fluorescent Microscopy
Agar pads are first made
Extracting PHB
- Centrifuge settings: 4000RPM, 10mins.
- Scale as appropriate.
- After each centrifuge step the supernatant should be poured off.
- This should provide PHB with 99% purity and a high molecular weight.
- Centrifuge 50ml culture and resuspend in PBS.
- Resuspend pellet in 5ml Triton X-100(1% v/v in PBS) for 30mins at room temp.
- Centrifuge, resuspend in 5ml PBS.
- Centrifuge, add 5ml sodium hyperchlorite solution and incubate at 30˚C for 1 hour.
- Centrifuge, wash with 5ml distilled water and 70% EtOH several times.
- Allow powder to dry.
Relationship between OD and dry biomass
- Grow 3 large cultures in 3% glucose 1L/300ml LB - inoculate with 1ml OD 0.1 and grow for 24h.
- Calculate OD of original culture and dilute until there is a range of 0.2 - 1.0 OD(try to have large volumes for low OD).
- Weigh centrifuge containers.
- Transfer solutions to these containers, recording what volume of each OD is transferred. .
- Centrifuge these solutions down and dry the pellet out overnight in a 50°C oven.
- Dry cell mass = (container mass + dry cell mass)/container mass
- Plot OD against dry cell mass.
Measure OD of culture. If OD>0.4 then dilute by a dilution factor d. Divide new OD by d to give the corrected OD.
Either create a calibration curve or assume dry biomass is proportional.
- Weigh each container,then culture PHB producing microbes.
- Calculate the culture’s optical density(OD).
- Centrifuge culture and pour off supernatant.
- Weigh container and pellet.
- Heat in oven until weight is constant.
- Re-weigh container and pellet, subtracting container weight to calculate biomass dry weight.
Measure OD of cultures before extracting PHB to estimate dry biomass.
Safety
Dimethyl Sulfoxide(DMSO)
It has known carcinogenic effects and can permeate your skin, carrying other chemicals with it. Handle in a fume cupboard, wearing nitrile gloves and goggles.
- ANDERSON A, DAWES E. Occurrence, Metabolism, Metabolic Role, and Industrial Uses of Bacterial Polyhydroxyalkanoates. Microbiol Rev 1990 DEC;54(4):450-472.
- Harding KG, Dennis JS, von Blottnitz H, Harrison STL. Environmental analysis of plastic production processes: Comparing petroleum-based polypropylene and polyethylene with biologically-based poly-beta-hydroxybutyric acid using life cycle analysis. J Biotechnol 2007 MAY 31;130(1):57-66.
- Kim S, Dale BE. Energy and Greenhouse Gas Profiles of Polyhydroxybutyrates Derived from Corn Grain: A Life Cycle Perspective. Environ Sci Technol 2008 OCT 15;42(20):7690-7695.
- Jendrossek D, Handrick R. Microbial degradation of polyhydroxyalkanoates. Annu Rev Microbiol 2002;56:403-432.
- Philip S, Keshavarz T, Roy I. Polyhydroxyalkanoates: biodegradable polymers with a range of applications. Journal of Chemical Technology and Biotechnology 2007 MAR;82(3):233-247.