"
"
Team:TU-Eindhoven/IntegralModel
From 2013.igem.org
Pascalaldo (Talk | contribs) (→Results) |
Pascalaldo (Talk | contribs) |
||
| Line 28: | Line 28: | ||
{{:Team:TU-Eindhoven/Template:Float | position=left | size=6 }} | {{:Team:TU-Eindhoven/Template:Float | position=left | size=6 }} | ||
{{:Team:TU-Eindhoven/Template:Image | filename=DecoySitesOxygenSharp.png}} | {{:Team:TU-Eindhoven/Template:Image | filename=DecoySitesOxygenSharp.png}} | ||
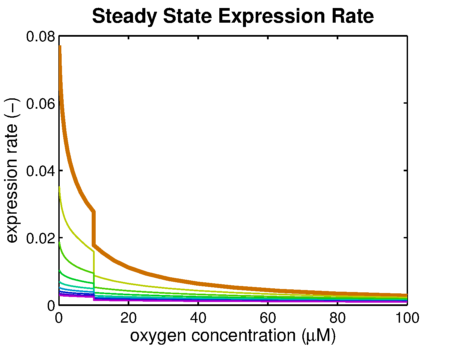
| - | {{:Team:TU-Eindhoven/Template:FloatEnd | caption=Correlation between the expression rate and the oxygen concentration for different amounts of decoy sites using a weaker promotor. | id=DecoySitesOxygen }} | + | {{:Team:TU-Eindhoven/Template:FloatEnd | caption=Correlation between the expression rate and the oxygen concentration for different amounts of decoy sites using a weaker promotor (colors have the same meaning as in {{:Team:TU-Eindhoven/Template:Figure | id=DecoySitesOxygen}}). | id=DecoySitesOxygen }} |
{{:Team:TU-Eindhoven/Template:Float | position=right | size=6 }} | {{:Team:TU-Eindhoven/Template:Float | position=right | size=6 }} | ||
{{:Team:TU-Eindhoven/Template:Image | filename=DecoySitesOxygenResponseSharp.png}} | {{:Team:TU-Eindhoven/Template:Image | filename=DecoySitesOxygenResponseSharp.png}} | ||
| - | {{:Team:TU-Eindhoven/Template:FloatEnd | caption=Reaction of the expression rate to a change in oxygen concentration using a weaker promotor. | id=DecoySitesOxygenResponse }} | + | {{:Team:TU-Eindhoven/Template:FloatEnd | caption=Reaction of the expression rate to a change in oxygen concentration using a weaker promotor (colors have the same meaning as in {{:Team:TU-Eindhoven/Template:Figure | id=DecoySitesOxygenResponse}}). | id=DecoySitesOxygenResponse }} |
Combining these observations, adding decoy sites to the construct appears to only have negative effects and the idea should based on the modeling be dismissed. | Combining these observations, adding decoy sites to the construct appears to only have negative effects and the idea should based on the modeling be dismissed. | ||
Revision as of 19:41, 4 October 2013


Contents |
Integral Model
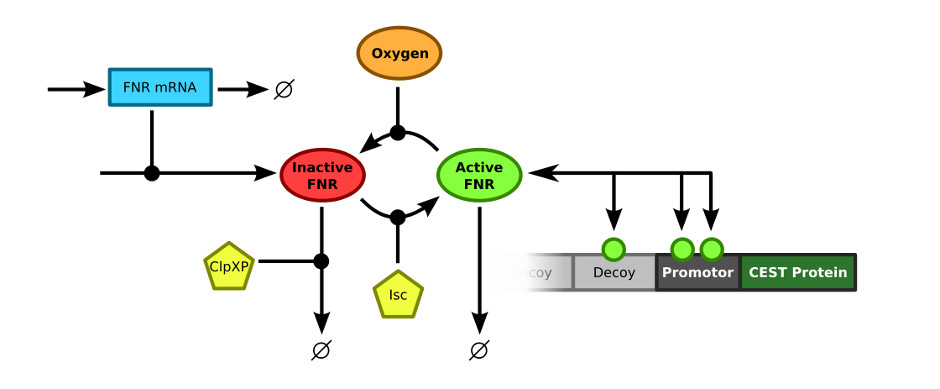
The last step in creating a comprehensive model of the contrast mechanism is merging all individual models. Previously the model to predict the FNR concentration in a cell was described. This model will be combined with the decoy sites model, which was extended to contain the specific promotor that was used in this research. Here, the properties of the merged model will be discussed.
Merging the Models
In order to merge the FNR model and the decoy sites model, the exact connection between the two models had to be defined. The FNR model describes the (active) FNR concentration in the bacterial cells. This active FNR species fulfills the role of transcription factor in the decoy sites model. Using this information, the models could simply be combined by merging the Active FNR species of the FNR model and the T (transcription factor) of the decoy sites model. The resulting model schematics are depicted in .
Results
This model was implemented as both a ODE and a stochastic model, various parameters were estimated as described on the FNR promotor page. One of the most interesting predictions that can be derived from the integral model is the influence of adding decoy sites to the DNA on the response to oxygen. and endeavour to visualise this prediction as clearly as possible.
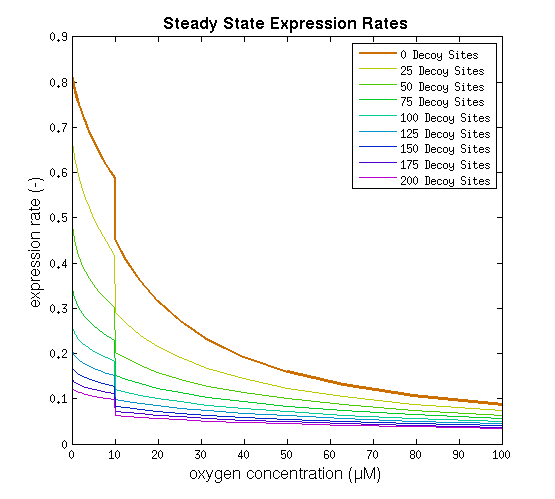
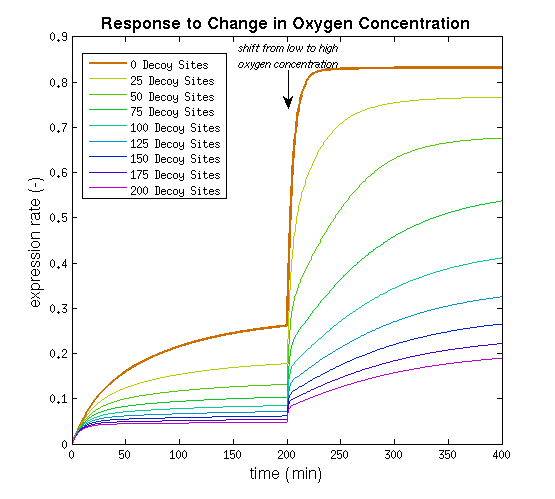
From it can be concluded that the sharpest response is realised using no decoy sites. Looking at it can be seen that adding decoy sites decreases the steady state expression rate, which is undesired. For a sharper response a weaker promotor would be needed in combination with stronger decoy sites, of which results are shown in and .
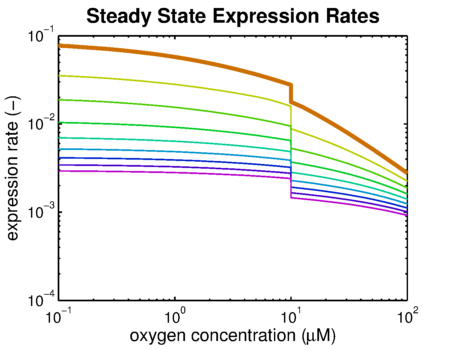
Combining these observations, adding decoy sites to the construct appears to only have negative effects and the idea should based on the modeling be dismissed.
Sensitivity Analysis
A sensitivity analysis is carried out over the integral model. It aims to see the effect of uncertainties in different parameters on the result curve. Therefore we know which parameters are crucial control points. In the sensitivity analysis, the parameters are added with a random error and put into the model. The method of Latin hypercube sampling is used to generate the error so that the error distribution is uniform over the region.