"
"
Team:TU-Eindhoven/MRIProcessing
From 2013.igem.org
Pascalaldo (Talk | contribs) (→Results) |
Pascalaldo (Talk | contribs) (→MRI Data Processing) |
||
| Line 48: | Line 48: | ||
{{:Team:TU-Eindhoven/Template:Image | filename=ArginineContrastPlot.jpg}} | {{:Team:TU-Eindhoven/Template:Image | filename=ArginineContrastPlot.jpg}} | ||
{{:Team:TU-Eindhoven/Template:FloatEnd | caption=Text needed. | id=ArginineContrastPlot }} | {{:Team:TU-Eindhoven/Template:FloatEnd | caption=Text needed. | id=ArginineContrastPlot }} | ||
| + | |||
| + | ==Conclusion== | ||
| + | All in all, the most promising candidate agent seems to be ''1PJN''. The lysine peak of this agent is very clearly distinguishable from the rest of the signal. As a arginine based compound, no clear results have been achieved and therefore no good recommendation can be given, except that the arginine based agents are less suitable for generating contrast in general. Therefore, it is recommended to use lysine based agents, such as ''1PJN'', only for multi-color MRI or imaging lysine rich areas arginine agents can be useful. | ||
==References== | ==References== | ||
Revision as of 20:35, 3 October 2013


Contents |
MRI Data Processing
Until recently, the most common way of generating MRI contrast was by using heavy metal based contrast agents. Examples of these substances are the commercial Gadolinium(III) based Magnevist and the Iron Oxide based Resovist. A very obvious downside of using heavy metals is the toxicity of the agents in the human body. Fortunately, a new type of MRI has been developed, which allows for the use of organic compounds as contrast agent.
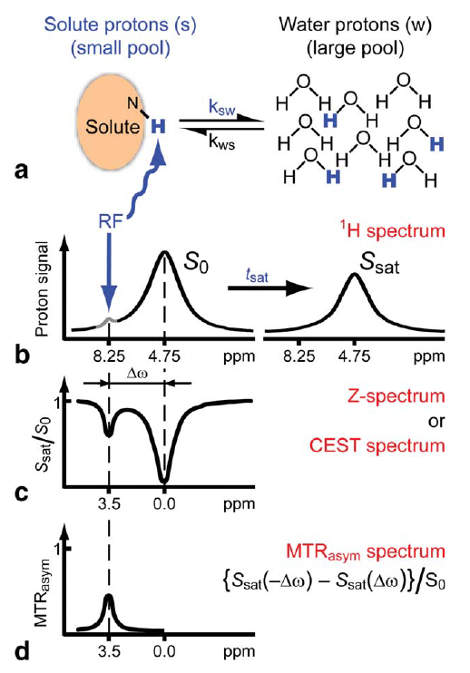
The Principle
This new type of MRI goes by the name Chemical Exchange Saturation Transfer MRI or CEST MRI. The principle behind this technique is based on compounds that contain pools of exchangeable protons that can be selectively saturated using radiofrequency irradiation. Upon proton exchange with bulk water, these compounds can be indirectly visualized by measuring the bulk water. The amino acids lysine, arginine, threonine and serine contain those exchangeable protons and polypeptides containing those amino acids in abundance are therefore potential contrast agents. An other advantage of CEST MRI is that different kind of protons (e.g. amide and hydroxide protons) can be distinguished, which allows for 'multi-color' imaging using multiple contrast agents simultaneously.
Processing
To detect these protons in bulk water some processing steps are required. First of all, the imaging should be taken at different frequencies of the saturation pulse. This way the signal at different chemical shifts can be measured. When bulk water is set to 0 ppm, the signal plot will be roughly symmetric around zero, since saturation pulses will excite the bulk water in a similar way when the absolute shift is equal. This also implies that when the signals with a negative shift from the bulk water are compared with the signals with a positive shift, asymmetry can be detected. The CEST effect is exactly what causes asymmetry in the signal plot, because the chemical shift of the CEST compounds is different from the chemical shift of water. Therefore, when the absolute shift from bulk water of two saturation pulses is equal, this does not mean the absolute shift from the CEST compound is equal and the CEST protons will in one case get barely saturated (depending on its shift from bulk water of course).
Putting this principle into practice requires some processing steps. First of all, the asymmetric comparison should be conducted as shown in . Where the MTRasym is the asymmetry in the z-spectrum. Furthermore, $S_{0}$ and $S_{w}^{\pm\Delta\omega_{sw}}$ are, respectively, the water signals without saturation and with saturation at $\Delta\omega_{sw}$ from bulk water. The PTR is the Proton Transfer Enhancement, which gives an indication of the sensitivity of an agent, independent of the concentration. In this research, the concentration was not measured accurately, but the mass of cell pellet was aimed to be kept constant, so the MTRasym plots can still be compared quite well.
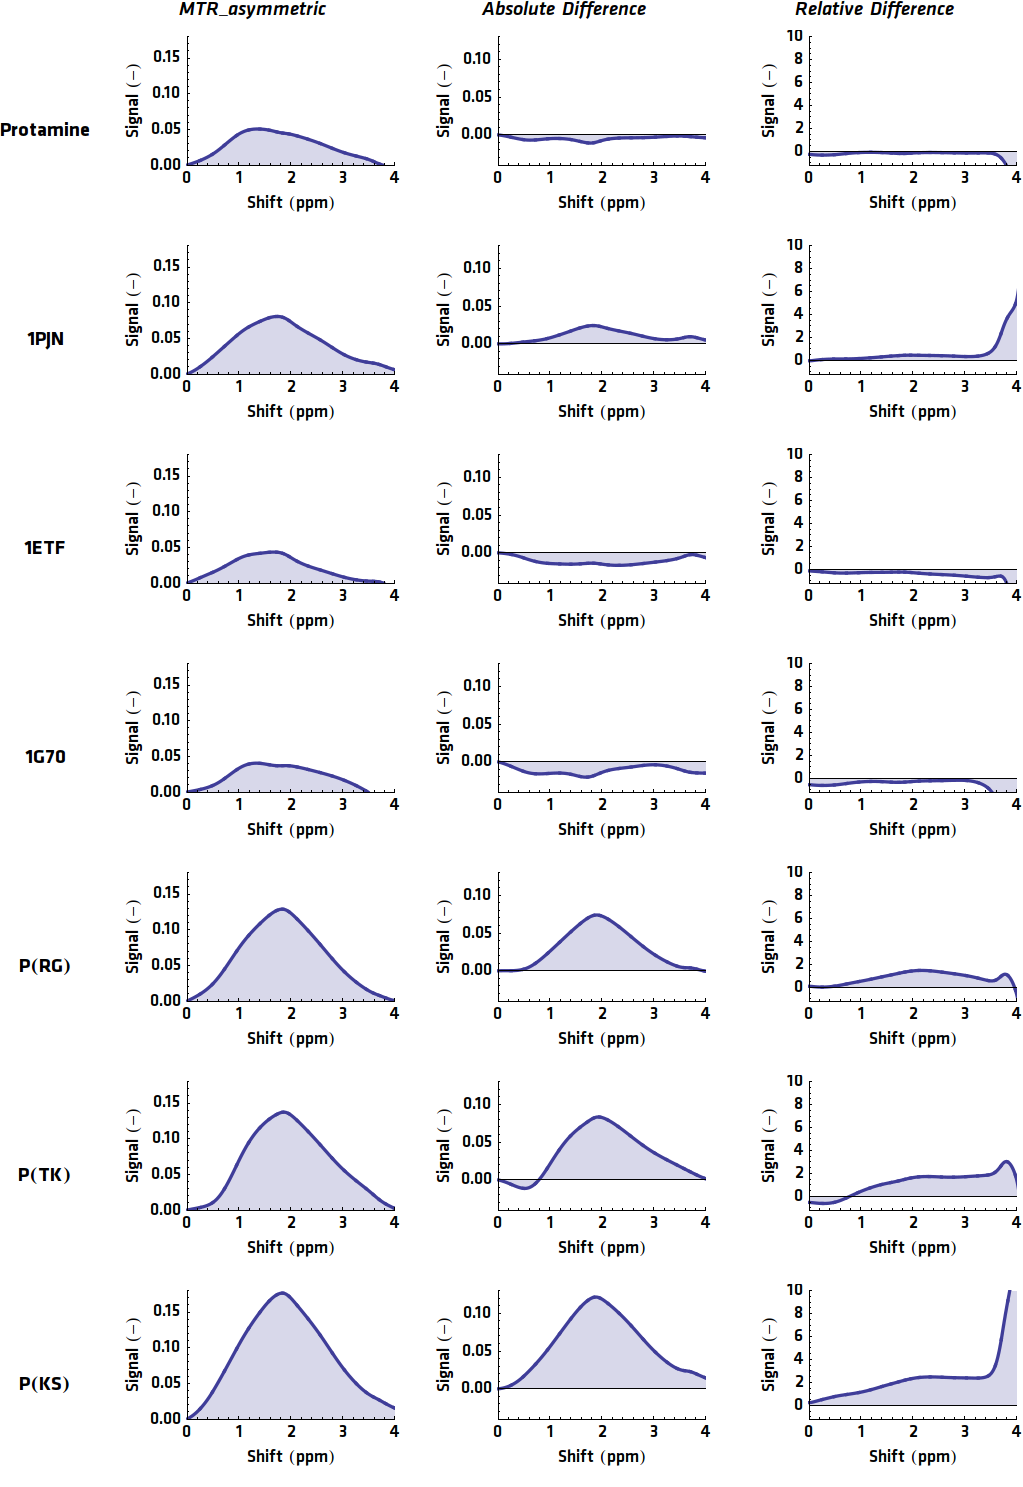
To eliminate the background signal of other lysine and arginine rich proteins, the asymmetric plots of the potential agents were compared to the asymmetric plots of the control sample, where no protein was overexpressed. In practice this can be compared to using an MRI image of human tissue without contrast agent as control for an image of tissue with contrast agent. This comparison was done in two different ways, one option results in the absolute difference compared to the control sample. The other method is relatively comparing the samples ().
Results
When these processing steps are applied to the MRI results of this research, the following graphs can be acquired. shows the MTRasym, $C_{abs}$ (Absolute Difference) and $C_{rel}$ (Relative Difference) graphs for all potential contrast agents that were tested.
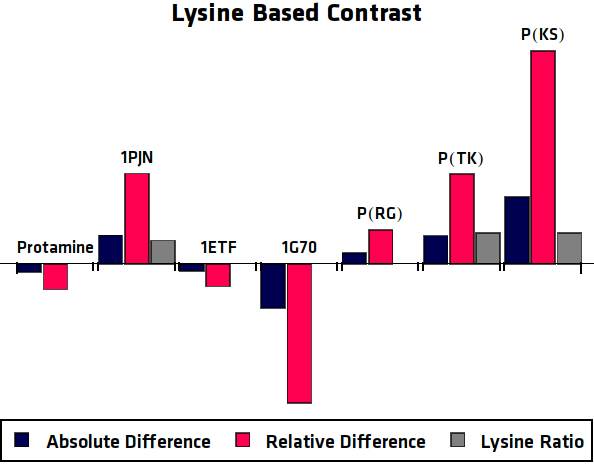
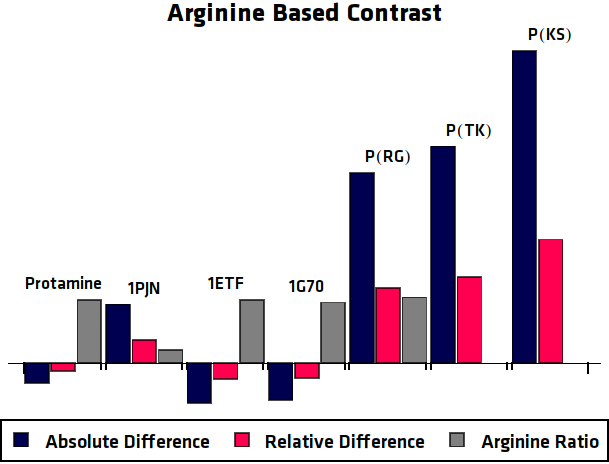
Conclusion
All in all, the most promising candidate agent seems to be 1PJN. The lysine peak of this agent is very clearly distinguishable from the rest of the signal. As a arginine based compound, no clear results have been achieved and therefore no good recommendation can be given, except that the arginine based agents are less suitable for generating contrast in general. Therefore, it is recommended to use lysine based agents, such as 1PJN, only for multi-color MRI or imaging lysine rich areas arginine agents can be useful.
References