 "
"
Team:TU-Eindhoven/ProteinSelection
From 2013.igem.org
Pascalaldo (Talk | contribs) (→Molecular Dynamics) |
Pascalaldo (Talk | contribs) (→Molecular Dynamics) |
||
| Line 228: | Line 228: | ||
| 1.7040 | | 1.7040 | ||
|} | |} | ||
| - | In this case a higher value is expected to give a better CEST contrast. Taking this into account a selection was made. For the contrast Guanidine (of Arginine) based contrast 1G70 and 1ETF were selected. Based on the simulations it is expected that 1G70 will give better contrast. 1PJN was also tested to see the result of a protein that is expected to give high contrast with saturation pulses at the chemical shifts of both characteristic groups (Guadine of Arginine and the primary Amide of Lysine). | + | In this case a higher value is expected to give a better CEST contrast. Taking this into account a selection was made. For the contrast Guanidine (of Arginine) based contrast '''1G70''' and '''1ETF''' were selected. Based on the simulations it is expected that 1G70 will give better contrast. '''1PJN''' was also tested to see the result of a protein that is expected to give high contrast with saturation pulses at the chemical shifts of both characteristic groups (Guadine of Arginine and the primary Amide of Lysine). |
==References== | ==References== | ||
Revision as of 19:56, 4 September 2013


Contents |
CEST Based Marker Proteins
To create bacteria with the ability to generate contrast on a CEST MRI scan, polypeptides that have that ability had to be found. Various solutions based on short Lysine, Arganine, Threonine or Serine rich sequences were proposed.McMahonDIACESTM.T. McMahon, New "Multicolor" Polypeptide Diamagnetic Chemical Exchange Saturation Transfer (DIACEST) Contrast Agents for MRI. Magnetic Resonance in Medicine 60, 803-812 (2008) However, it is hard to predict how well these sequences will express in bacteria and whether they are sufficiently stable in vivo. To avoid these problems a new approach was taken. The suitability as a CEST based marker was estimated for proteins of which the structure is already clarified.
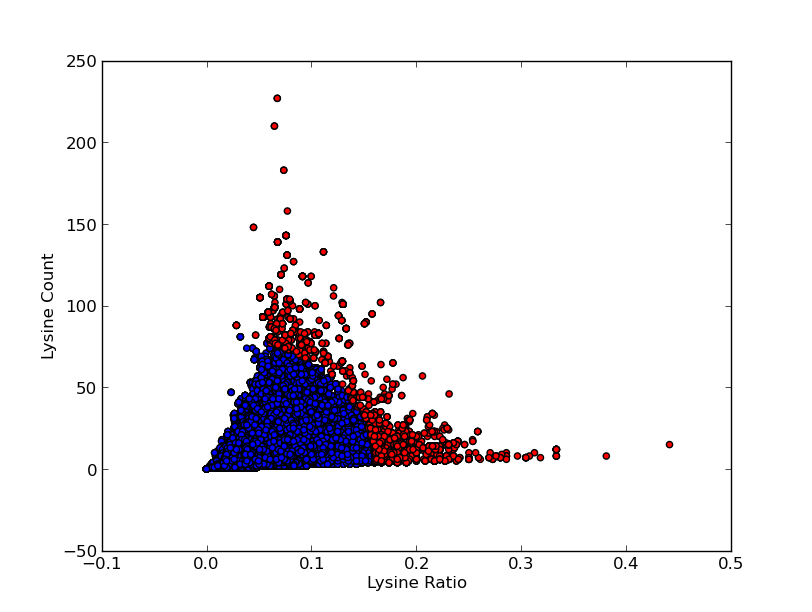
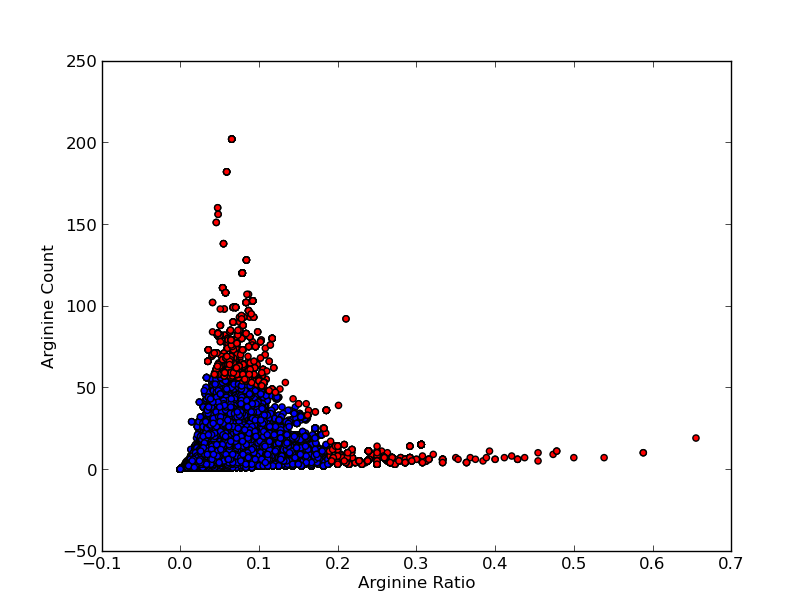
Scanning for Candidates
For good CEST contrast a protein should have a high Lysine or Arganine content.McMahonDIACESTGiladArtificialGeneA.A. Gilad, Artificial reporter gene providing MRI contrast based on proton exchange.. Nature biotechnology 25.2, 217-219 (2007) To find these suitable proteins the RCSB Protein Data Bank was queried for all entries containing proteins. This was done using the SEARCH Web Service of PDB.org, for the XML query used see query.xml. A Python program was written to analyse the obtained amino acid sequences and calculate the ratio of Lysine or Arginine to the total chain length (see PDB.py and queryPDB.py). The results are visualized in and .
| PDB ID | Frequent Amino Acid | Amount of Frequent Amino Acids (#) | Chain Length (#) | Ratio (-) |
|---|---|---|---|---|
| 1ETF | Arginine | 11 | 23 | 0.48 |
| 1IWQ | Lysine | 7 | 19 | 0.37 |
| 1PJN | Lysine | 8 | 21 | 0.38 |
| 2IGR | Lysine | 15 | 34 | 0.44 |
| 2KLW | Lysine | 10 | 32 | 0.31 |
| 2PCO | Lysine | 8 | 26 | 0.30 |
| 1G70 | Arginine | 10 | 22 | 0.46 |
| 1BY0 | Lysine | 8 | 27 | 0.30 |
| 1NWD | Lysine | 8 | 28 | 0.29 |
| 1PEH | Lysine | 10 | 35 | 0.29 |
| 2L9A | Lysine | 8 | 24 | 0.33 |
| 2L96 | Lysine | 8 | 24 | 0.33 |
| 2L99 | Lysine | 8 | 24 | 0.33 |
| 1LYP | Lysine | 9 | 32 | 0.28 |
| 1LQ7 | Lysine | 17 | 67 | 0.25 |
Molecular Dynamics
To refine the selection the accessibility of the various exchangable hydrogen atoms of the Lysines and Arginines was taken into account. Hereto Molecular Dynamics simulations of the proteins in water were carried out. Gromacs was used to run the sequence of simulations. For every protein a in vacuo energy minimization was carried out to stabilize the protein. Subsequently an energy minimization in water with ions (0.15 M KCl) was executed to stabilize the whole system. Further stabilization was done by running a NVT and NPT simulation with position restraints followed by a NPT simulation without the restraints. Then the final run, of which the data was used for further analysis, was carried out.
For the analysis of the data the g_dist utility provided with Gromacs was used in combination with self-made Matlab scripts. Using g_dist the number of water molecules within a 5 nm radius of certain characteristic groups was calculated for each protein. This value was divided by the runtime of the simulation, resulting in an indication of the accessibility of the characteristic group by water molecules. The results are shown in the table below, numbers should be interpreted as an index value.
| PDB ID | Backbone Secondary Amine | Arginine Guanidine | Arginine Secondary Amine | Secondary Amine | Lysine Primary Amine |
|---|---|---|---|---|---|
| 1ETF | 0.9935 | 1.0525 | 0.7954 | 0.8028 | X |
| 1IWQ | 5.2279 | 5.6850 | 4.6562 | 5.3046 | 5.1866 |
| 1PJN | 8.1621 | 4.2782 | 4.5149 | 8.5247 | 7.6893 |
| 2IGR | 4.7848 | X | X | 4.7848 | 3.2901 |
| 2KLW | |||||
| 2PCO | |||||
| 1G70 | 2.9608 | 2.2858 | 2.2338 | 2.7171 | X |
| 1BY0 | 5.5306 | 7.1884 | 6.7331 | 5.7483 | 1.9289 |
| 1NWD | 2.7855 | X | X | 2.7855 | 3.6024 |
| 1PEH | |||||
| 2L9A | 3.0711 | X | X | 3.0711 | 3.4460 |
| 2L96 | |||||
| 2L99 | |||||
| 1LYP | |||||
| 1LQ7 | 0.0814 | 0.7923 | 0.3797 | 0.0810 | 1.7040 |
In this case a higher value is expected to give a better CEST contrast. Taking this into account a selection was made. For the contrast Guanidine (of Arginine) based contrast 1G70 and 1ETF were selected. Based on the simulations it is expected that 1G70 will give better contrast. 1PJN was also tested to see the result of a protein that is expected to give high contrast with saturation pulses at the chemical shifts of both characteristic groups (Guadine of Arginine and the primary Amide of Lysine).
References