Team:TU-Eindhoven/StochasticModel
From 2013.igem.org
(→Decoy Sites) |
JacquesErnes (Talk | contribs) (→Simulation Result) |
||
| (70 intermediate revisions not shown) | |||
| Line 2: | Line 2: | ||
{{:Team:TU-Eindhoven/Template:MenuBar}} | {{:Team:TU-Eindhoven/Template:MenuBar}} | ||
| - | == | + | =Decoy Sites=<!-- To be improved, add info about our own promoters --> |
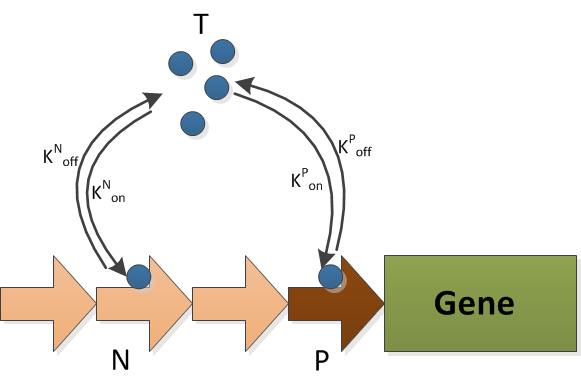
| - | {{:Team:TU-Eindhoven/Template:Lead}} | + | {{:Team:TU-Eindhoven/Template:Lead}}To tune the level of protein expression, we used decoy sites. Decoy sites are tandem repeats of DNA where transcriptional factor can bind to but don't promote gene expression. Therefore it competes with promoter sites and lowers the gene expression rate. |
| + | {{:Team:TU-Eindhoven/Template:Ref | id=LeeDecoy | author=Tek-Hyung Lee and Narendra Maheshri | title=A regulatory role for repeated decoy transcription factor binding sites in target gene expression | journal=Molecular Systems Biology | edition=8 | pages=576 | year=2012 }}{{:Team:TU-Eindhoven/Template:LeadEnd}} | ||
| - | ==Decoy Sites== | + | ==The Model== |
| - | + | ===Decoy Sites=== | |
| - | {{:Team:TU-Eindhoven/Template: | + | {{:Team:TU-Eindhoven/Template:Float | position=right | size=6 }} |
| + | {{:Team:TU-Eindhoven/Template:Image | filename=Decoy.png}} | ||
| + | {{:Team:TU-Eindhoven/Template:FloatEnd | caption=Schematic of the Decoy model | id=DecoyModelSchematics }} | ||
| + | The model of decoy sites consists of two reactions, i.e., the transcriptional factor binding to decoy sites and to promoter sites. The schematic graph of this model is illustrated in {{:Team:TU-Eindhoven/Template:Figure | id=DecoyModelSchematics }}. The reactions are:<br> | ||
| + | <html>$$ | ||
| + | \eqalignno{ | ||
| + | \ce{$T + N\,$ &<=>[\text{Kn-on}][\text{Kn-off}] $TN$} & (1) \\ | ||
| + | \ce{$T + P\,$ &<=>[\text{Kp-on}][\text{Kp-off}] $TP$} & (2) \\ | ||
| + | }$$ | ||
| + | </html> | ||
| - | {{:Team:TU-Eindhoven/Template: | + | |
| + | The T is the transcriptional factor, which is FNR. It can binds to either the decoy sites(N) or the promoter(P). The production and degradation of T is included in the FNR model. | ||
| + | |||
| + | ===Copy Number=== | ||
| + | The copy numbers refers to the number of certain plasmids in E.coli. In this project we used the derivative of pBR322. So the copy number is between 15 to 20.{{:Team:TU-Eindhoven/Template:Ref | id=CopyNr | author= | title=Growth of Bacterial Cultures | journal=www.qiagen.com/Knowledge-and-Support/Spotlight/Plasmid-Resource-Center/Growth%20of%20bacterial%20cultures/ | edition= | pages= | year= }} As the plasmid has a low copy number, we take the average of copy number and multiply it with the amount of promoter and decoy sites. | ||
| + | |||
| + | ===Protein Expression Rate=== | ||
| + | The protein expression rate was assumed to be linear to the promoter binding ratio in Tek-Hyung Lee and Narendra Maheshri{{:Team:TU-Eindhoven/Template:RefAgain | id=LeeDecoy}}. As we have only one promoter in each plasmid, we have either the 'on-state' plasmid or the 'off-state' plasmid. So we take the idea of linearity and convert the assumption to that <B> the protein expression rate is linear to the proportion of 'on-state' plasmid.</B> | ||
==Simulation Result== | ==Simulation Result== | ||
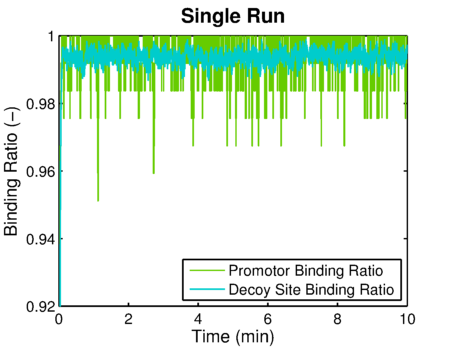
| - | The simulated result of | + | This model will later on be used for simulations of the complete system we designed. Some results of solely the decoy site model are shown below. {{:Team:TU-Eindhoven/Template:Figure | id=decoyBindingRatio}} and {{:Team:TU-Eindhoven/Template:Figure | id=decoyBindingRatioMultiple}} show the binding ratios calculated by either one or multiple stochastic simulations. |
| - | {{:Team:TU-Eindhoven/Template:Image | filename= | + | <!--{{:Team:TU-Eindhoven/Template:Image | filename=stochFNR.png }}--> |
| + | The simulated result of decoy site binding ratio: | ||
| + | |||
| + | {{:Team:TU-Eindhoven/Template:ImageList}} | ||
| + | {{:Team:TU-Eindhoven/Template:Float | position=left | size=6 }} | ||
| + | {{:Team:TU-Eindhoven/Template:Image | filename=decoyBindingRatio.png }} | ||
| + | {{:Team:TU-Eindhoven/Template:FloatEnd | caption=The decoy site and promotor site binding ratios simulated using the stochastic version of the decoy sites model. | id=decoyBindingRatio }} | ||
| + | {{:Team:TU-Eindhoven/Template:Float | position=right | size=6 }} | ||
| + | {{:Team:TU-Eindhoven/Template:Image | filename=decoyBindingRatioMultiple.png }} | ||
| + | {{:Team:TU-Eindhoven/Template:FloatEnd | caption=The decoy site binding ratio using simulated 50 times using the stochastic version of the decoy sites model. | id=decoyBindingRatioMultiple }} | ||
| + | {{:Team:TU-Eindhoven/Template:ImageListEnd}} | ||
| + | |||
| + | These simulation results comply with the original article, so we can go on adapting and extending this model. For these extended models see [[Team:TU-Eindhoven/FNRPromotor | the complex FNR promoter]] and [[Team:TU-Eindhoven/IntegralModel | the integral model]]. | ||
==References== | ==References== | ||
{{:Team:TU-Eindhoven/Template:RefList}} | {{:Team:TU-Eindhoven/Template:RefList}} | ||
| + | |||
| + | '''The source code of all models can be found [[Team:TU-Eindhoven/Code:Models | here]].''' | ||
{{:Team:TU-Eindhoven/Template:BaseFooter}} | {{:Team:TU-Eindhoven/Template:BaseFooter}} | ||
| - | {{:Team:TU-Eindhoven/Template:SetTitle | menu=drylab | page= | + | {{:Team:TU-Eindhoven/Template:Sponsors}} |
| + | {{:Team:TU-Eindhoven/Template:SetTitle | menu=drylab | page=Decoy Sites }} | ||
{{:Team:TU-Eindhoven/Template:UseReferencing}} | {{:Team:TU-Eindhoven/Template:UseReferencing}} | ||
{{:Team:TU-Eindhoven/Template:UseFigures}} | {{:Team:TU-Eindhoven/Template:UseFigures}} | ||
| - | + | {{:Team:TU-Eindhoven/Template:UseEquations}} | |
| - | + | {{:Team:TU-Eindhoven/Template:SetHeader | nr=4}} | |
| - | {{:Team:TU-Eindhoven/Template: | + | |
| - | + | ||
Latest revision as of 14:23, 26 October 2013


Contents |
Decoy Sites
To tune the level of protein expression, we used decoy sites. Decoy sites are tandem repeats of DNA where transcriptional factor can bind to but don't promote gene expression. Therefore it competes with promoter sites and lowers the gene expression rate. LeeDecoyTek-Hyung Lee and Narendra Maheshri, A regulatory role for repeated decoy transcription factor binding sites in target gene expression. Molecular Systems Biology 8, 576 (2012)
The Model
Decoy Sites

$$ \eqalignno{ \ce{$T + N\,$ &<=>[\text{Kn-on}][\text{Kn-off}] $TN$} & (1) \\ \ce{$T + P\,$ &<=>[\text{Kp-on}][\text{Kp-off}] $TP$} & (2) \\ }$$
The T is the transcriptional factor, which is FNR. It can binds to either the decoy sites(N) or the promoter(P). The production and degradation of T is included in the FNR model.
Copy Number
The copy numbers refers to the number of certain plasmids in E.coli. In this project we used the derivative of pBR322. So the copy number is between 15 to 20.CopyNr, Growth of Bacterial Cultures. www.qiagen.com/Knowledge-and-Support/Spotlight/Plasmid-Resource-Center/Growth%20of%20bacterial%20cultures/ , () As the plasmid has a low copy number, we take the average of copy number and multiply it with the amount of promoter and decoy sites.
Protein Expression Rate
The protein expression rate was assumed to be linear to the promoter binding ratio in Tek-Hyung Lee and Narendra MaheshriLeeDecoy. As we have only one promoter in each plasmid, we have either the 'on-state' plasmid or the 'off-state' plasmid. So we take the idea of linearity and convert the assumption to that the protein expression rate is linear to the proportion of 'on-state' plasmid.
Simulation Result
This model will later on be used for simulations of the complete system we designed. Some results of solely the decoy site model are shown below. and show the binding ratios calculated by either one or multiple stochastic simulations. The simulated result of decoy site binding ratio:


These simulation results comply with the original article, so we can go on adapting and extending this model. For these extended models see the complex FNR promoter and the integral model.
References
The source code of all models can be found here.
 "
"


