"
"
Team:TU-Eindhoven/StochasticModel
From 2013.igem.org
(→Simulation Result) |
|||
| Line 12: | Line 12: | ||
==Simulation Result== | ==Simulation Result== | ||
| + | The input is the concentration of FNR protein. This result is generated from the part of FNR protein. | ||
{{:Team:TU-Eindhoven/Template:Image | filename=stochFNR.png }} | {{:Team:TU-Eindhoven/Template:Image | filename=stochFNR.png }} | ||
{{:Team:TU-Eindhoven/Template:Image | filename=decoyBindingRatio.png }} | {{:Team:TU-Eindhoven/Template:Image | filename=decoyBindingRatio.png }} | ||
Revision as of 13:45, 6 August 2013


Contents |
Stochastic Model
The stochastic model is used to simulate the interactions of molecules in a small scale. In the ODE models, the assumptions are made that the molecule pool is very large and molecules are always evenly distributed, i.e., no transportation limit. However in the scope of promoter this is not applicable as promoter sites only exist in small numbers.
Decoy Sites
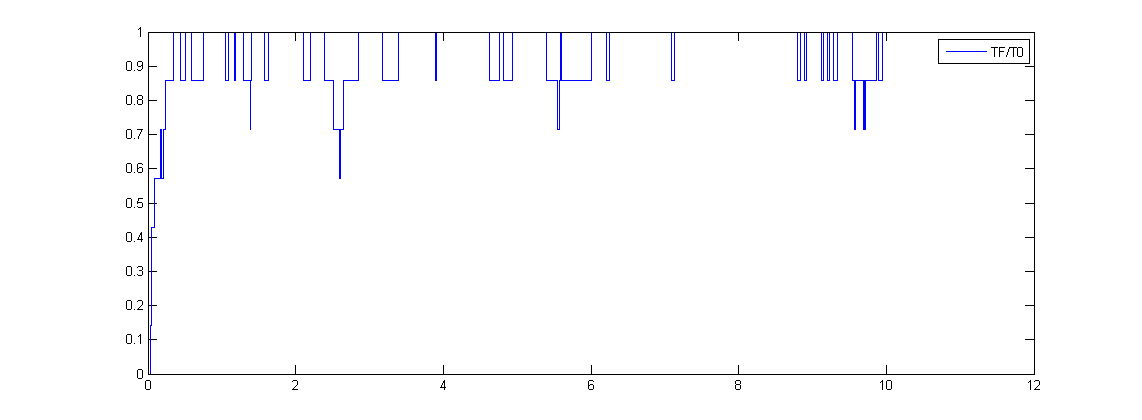
To tune the level of protein expression, we used decoy sites. Tandem repeats of transcription factor binding sites could compete with the fake binding sites and affect the target gene expression. LeeDecoyTek-Hyung Lee and Narendra Maheshri, A regulatory role for repeated decoy transcription factor binding sites in target gene expression. Molecular Systems Biology 8, 576 (2012) The T is a transcriptional activator, which in our model, is the active FNR. The N is the decoy site and the P is the promoter site. The protein expression rate is then assumed to be proportional to TF/ T0. The subscript 0 refers to the total amount.

Simulation Result
The input is the concentration of FNR protein. This result is generated from the part of FNR protein.

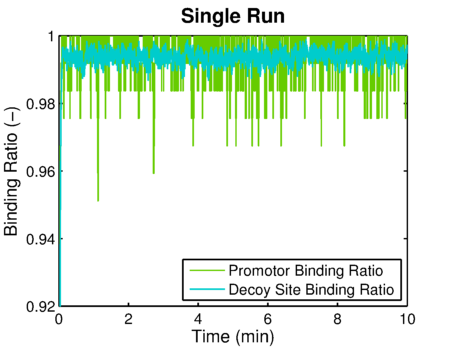 The simulated result of promoter binding ratio
References