"
"
Team:TU-Eindhoven/StochasticModel
From 2013.igem.org
Pascalaldo (Talk | contribs) |
|||
| Line 11: | Line 11: | ||
{{:Team:TU-Eindhoven/Template:Image | filename=Decoy.png}} | {{:Team:TU-Eindhoven/Template:Image | filename=Decoy.png}} | ||
{{:Team:TU-Eindhoven/Template:FloatEnd | caption=Schematic of the Decoy model | id=DecoyModelSchematics }} | {{:Team:TU-Eindhoven/Template:FloatEnd | caption=Schematic of the Decoy model | id=DecoyModelSchematics }} | ||
| - | The model of decoy sites consists of two reactions, i.e., the transcriptional factor binding to decoy sites and to promoter sites. The schematic graph of this model is illustrated in {{:Team:TU-Eindhoven/Template:Figure | id= | + | The model of decoy sites consists of two reactions, i.e., the transcriptional factor binding to decoy sites and to promoter sites. The schematic graph of this model is illustrated in {{:Team:TU-Eindhoven/Template:Figure | id=DecoyModelSchematics }}. The reactions are: |
{{:Team:TU-Eindhoven/Template:Image | filename=DecoyReactions.png}} | {{:Team:TU-Eindhoven/Template:Image | filename=DecoyReactions.png}} | ||
Revision as of 12:15, 13 August 2013


Contents |
Decoy Sites
To tune the level of protein expression, we used decoy sites. Decoy sites are tandem repeats of DNA where transcriptional factor can bind to but don't promote gene expression. Therefore it competes with promoter sites and lowers the gene expression rate. LeeDecoyTek-Hyung Lee and Narendra Maheshri, A regulatory role for repeated decoy transcription factor binding sites in target gene expression. Molecular Systems Biology 8, 576 (2012)
The Model
Decoy Sites
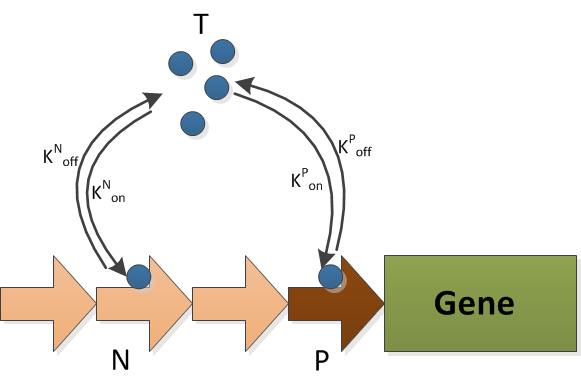

The T is the transcriptional factor, which is FNR. It can binds to either the decoy sites(N) or the promoter(P). The production and degradation of T is included in the FNR model.
Copy Number
Protein Expression Rate
Simulation Result
The input is the concentration of FNR protein. This result is taken from the part of FNR protein and converted from micro molar concentrations to number of molecules.

The simulated result of decoy site binding ratio
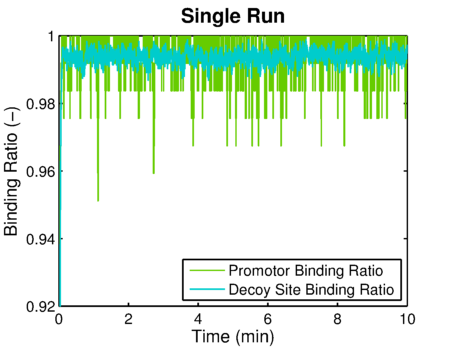 The simulated result of promoter binding ratio
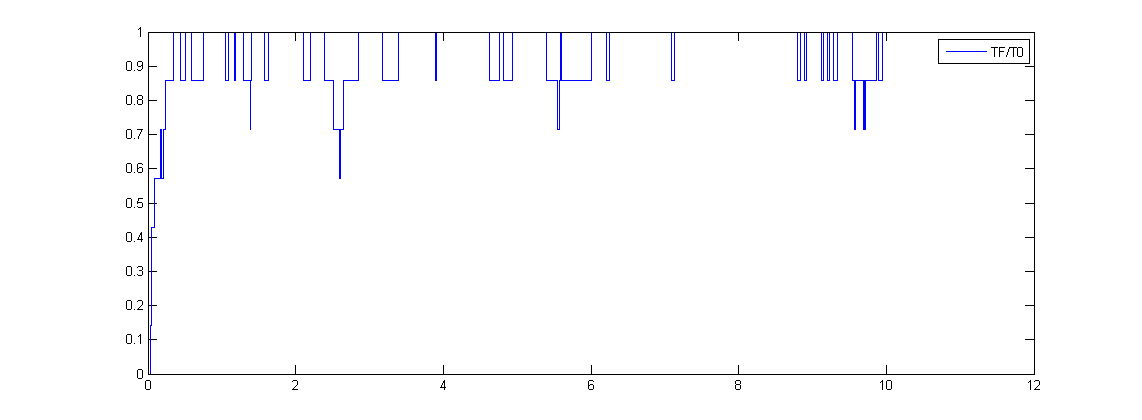 This would be the input for the modeling of protein generation. We assume the protein production rate is linear to the promoter binding ratio.LeeDecoy
References