Team:Bielefeld-Germany/Labjournal/September
From 2013.igem.org
September
Milestones
Week 18
Organization
- This week, we supported the CeBiTec pupil academy with supervising the ‘Synthetic Biology’ experiment. In addition we had a presentation about iGEM and the Bielefeld iGEM projects.
- Our team assigned the Track Food & Energy in this year, with the project title ‘Ecolectricity – currently available’. Project abstract, safety forms and team roster were added.
MFC
Mediators
- Glycerol dehydrogenase
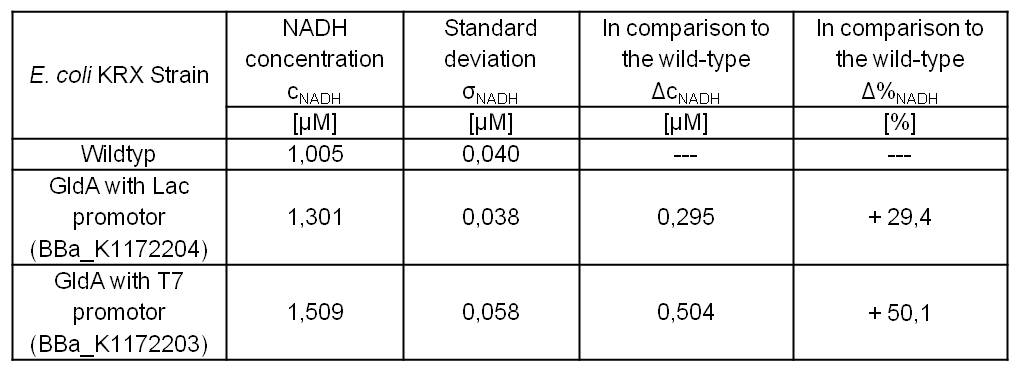
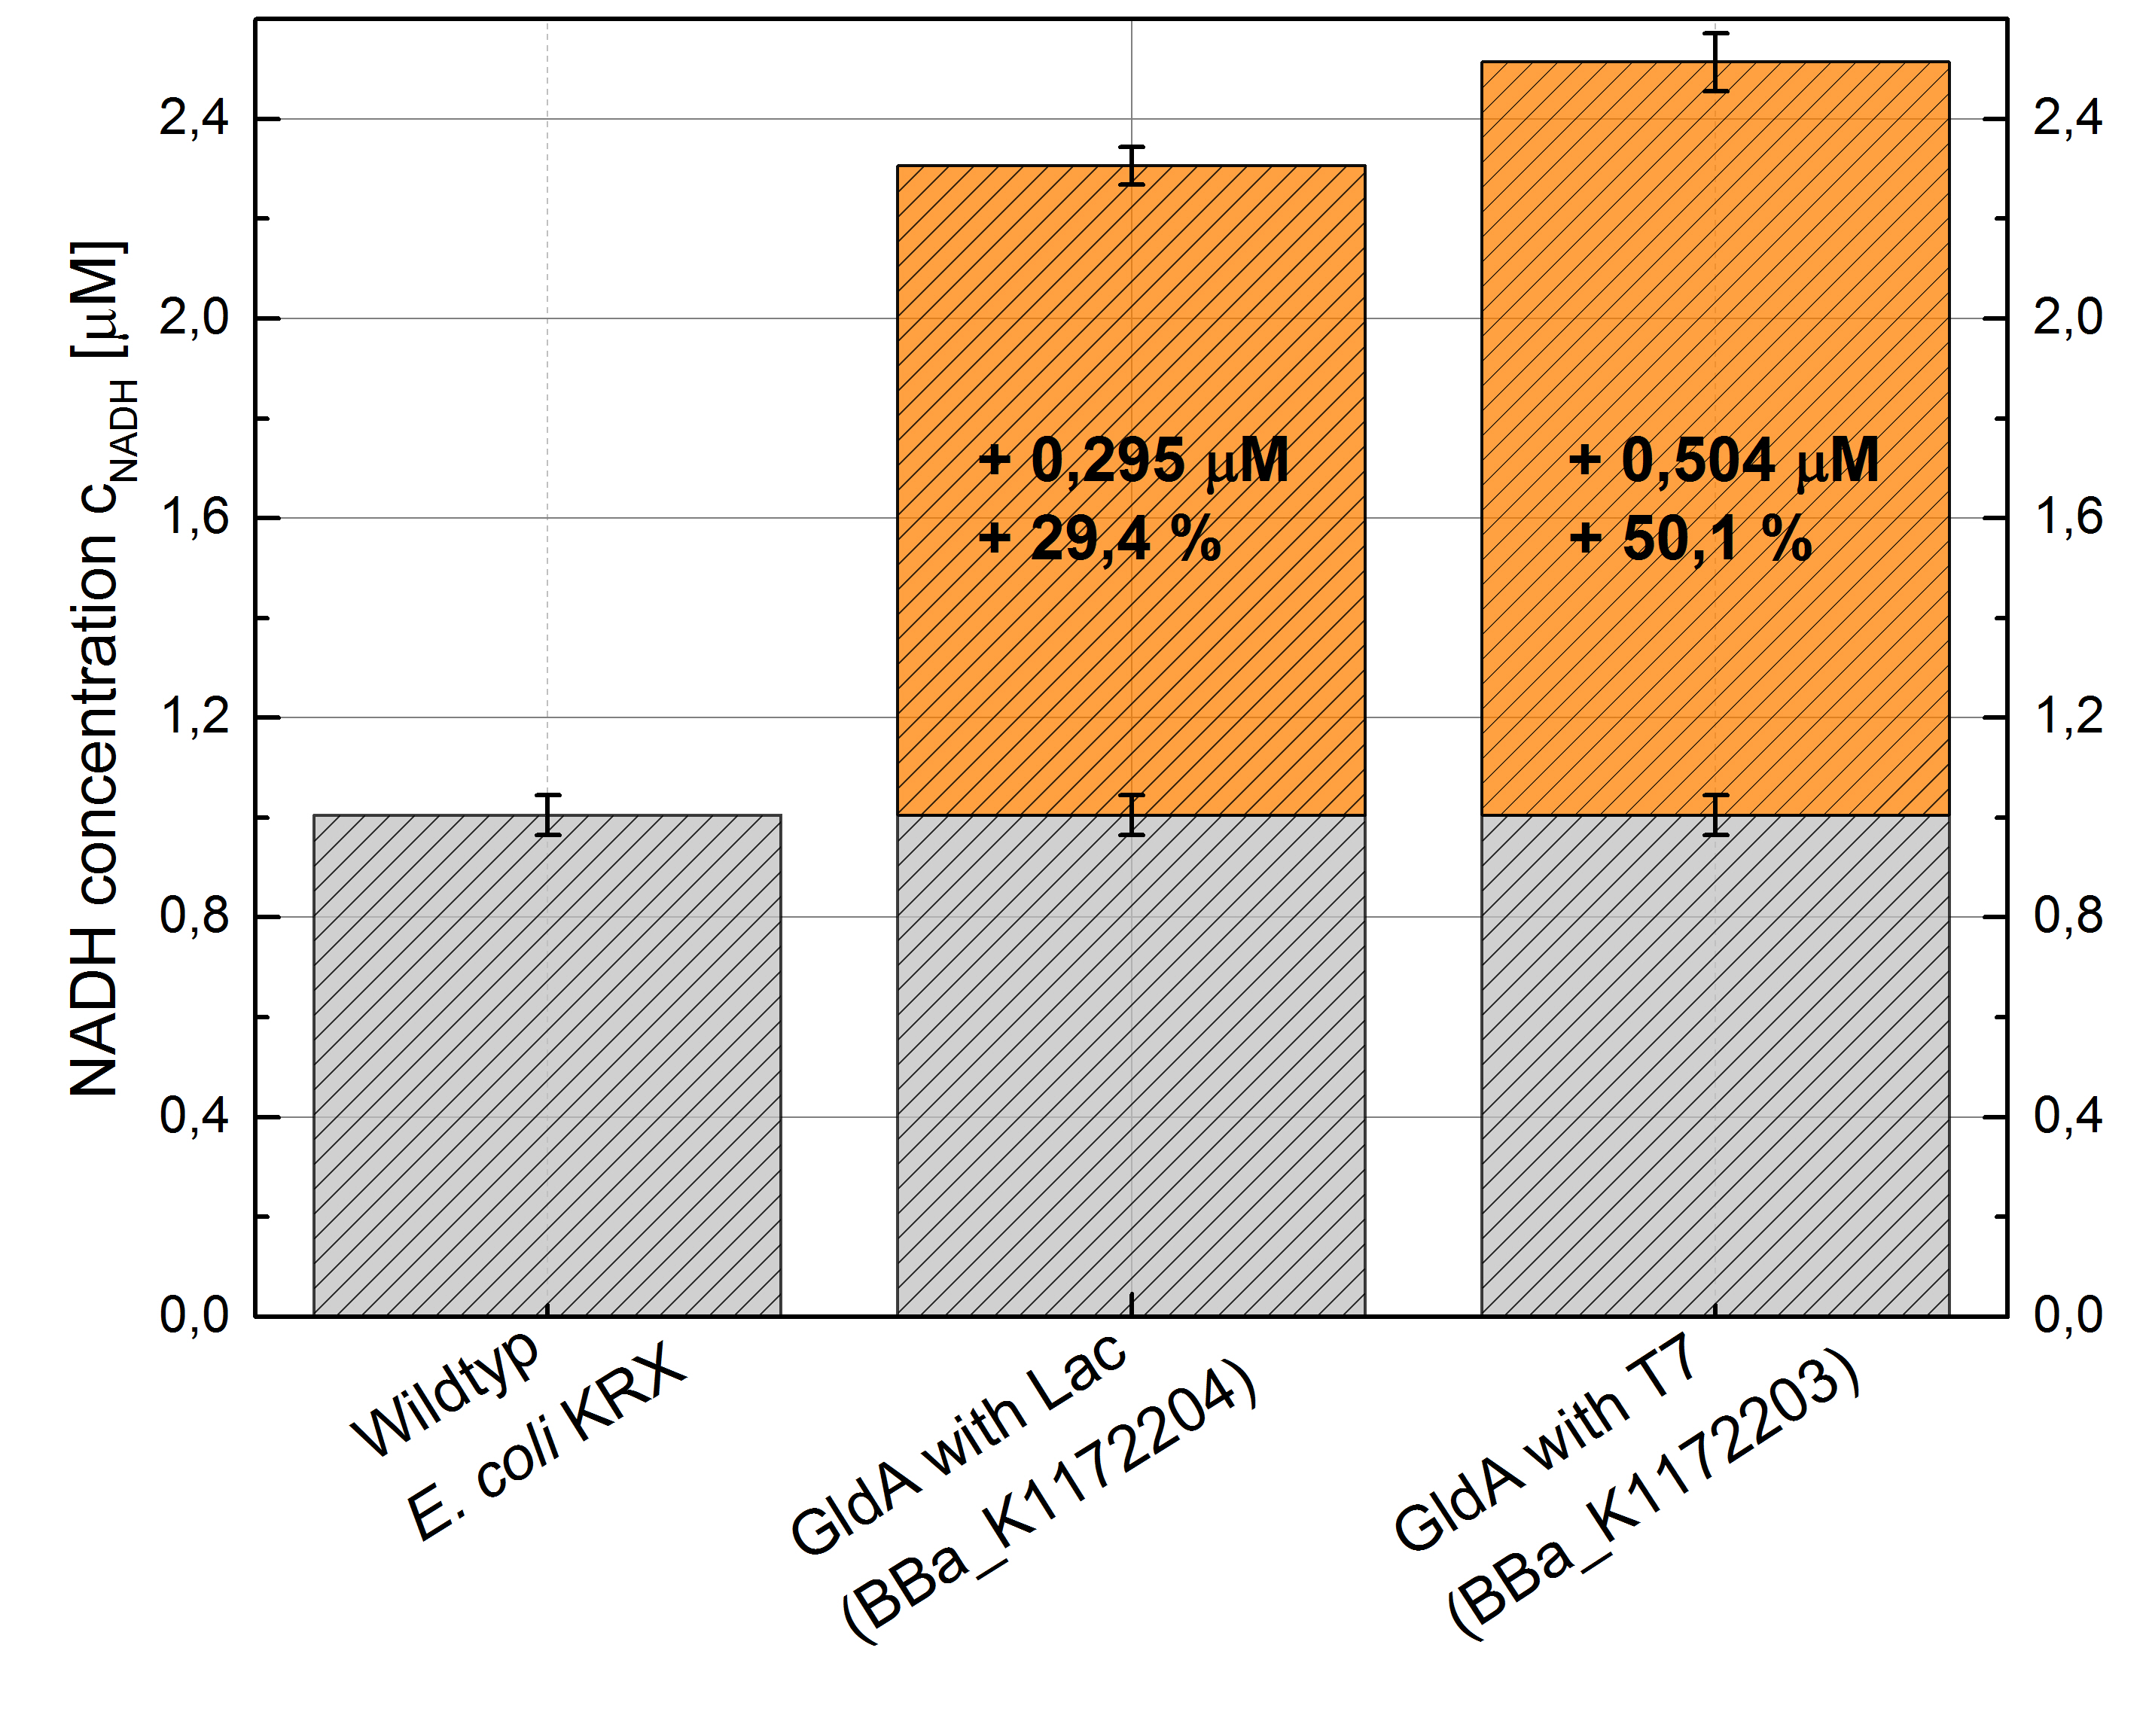
- Repeating NADH-Assay with three times PBS buffer washing step shows good results with better NADH production for E. coli KRX with pSB1C3 <bbpart>BBa_K1172203</bbpart> and <bbpart>BBa_K1172204</bbpart> compared with E. coli KRX wildtyp. GldA with T7 promotor (<bbpart>BBa_K1172203</bbpart>) shows 0,5 μM NADH overproduction and GldA with Lac promotor (<bbpart>BBa_K1172204</bbpart>) shows 0,3 μM NADH overproduction. The data refer to a culture with OD600 = 3.0.
- Second successful optimized NADH-Assay with Escherichia coli KRX Wildtyp strain and E. coli KRX with pSB1C3 and <bbpart>BBa_K1172203</bbpart>, <bbpart>BBa_K1172204</bbpart>, and <bbpart>BBa_K1172205</bbpart>.
- GldA with T7 promotor (<bbpart>BBa_K1172203</bbpart>) shows 1,7 μM NADH overproduction and GldA with Lac promotor (<bbpart>BBa_K1172204</bbpart>) shows 0,2 μM NADH overproduction. The GldA expression by the Anderson promotor (<bbpart>BBa_K1172205</bbpart>) is too weak for an efficient NADH overproduction. The data refer to a culture with OD600 = 5.0.
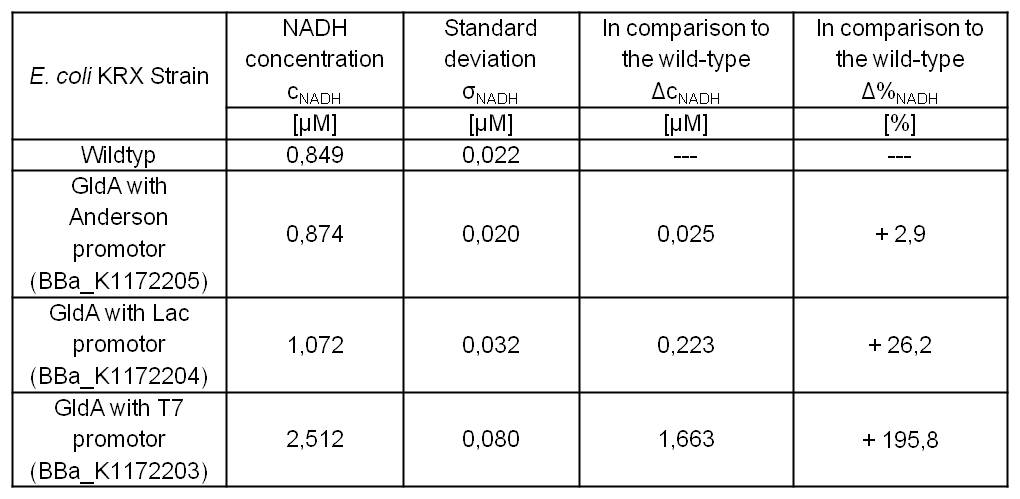
Table 2: Results of the NADH-Assay. Comparison between Escherichia coli KRX Wildtyp and Escherichia coli KRX with <bbpart>BBa_K1172205</bbpart>, <bbpart>BBa_K1172204</bbpart> and <bbpart>BBa_K1172203</bbpart>. NADH concentration with standard deviation and concentration in comparison to the wild-type is shown.
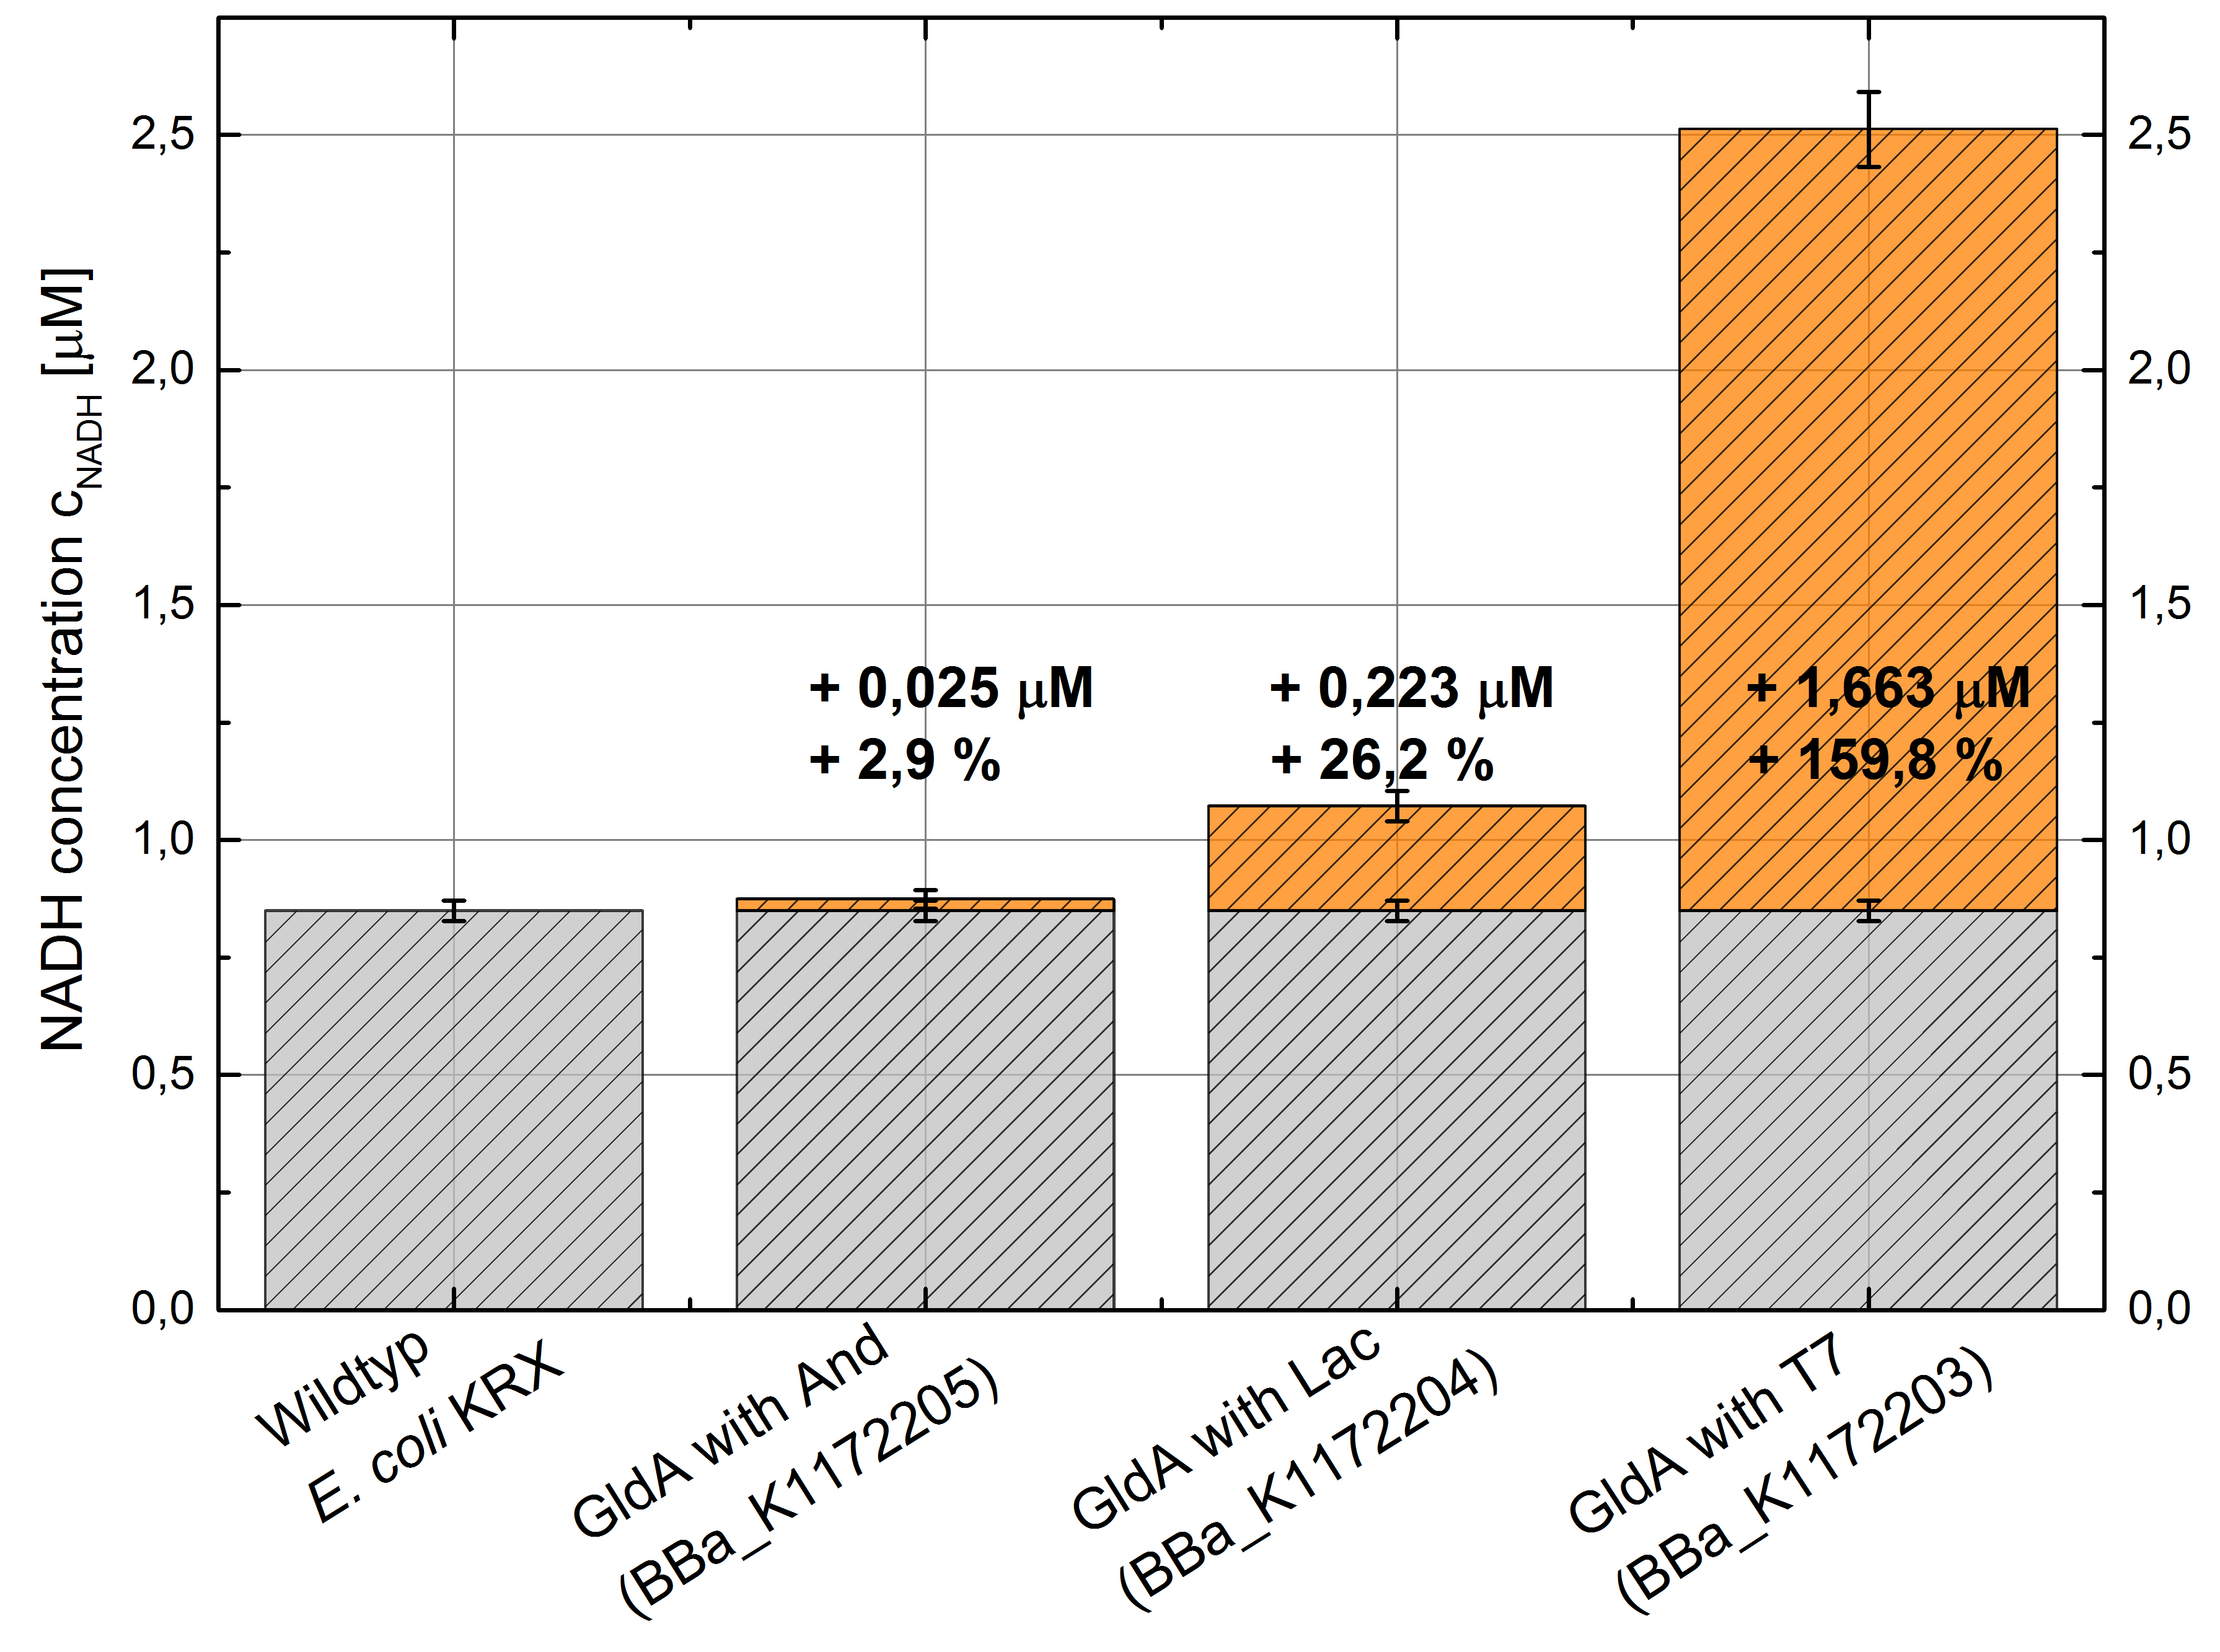
Figure 2: Column Chart with results of the NADH-Assay. Comparison between Escherichia coli KRX Wildtyp and Escherichia coli KRX with <bbpart>BBa_K1172205</bbpart>, <bbpart>BBa_K1172204</bbpart> and <bbpart>BBa_K1172203</bbpart>. NADH concentration with standard deviation and concentration in comparison to the wild-type is shown.
- Overexpressed glycerol dehydrogenase (Figure. 4 Week 17) should be examined by MALDI-TOF MS/MS.
- Tryptic digest of gel lanes for analysis with MALDI-TOF.
- Glycerol dehydrogenase was examined by MALDI-TOF MS/MS with a Mascot Score of 266 against Escherichia coli database.
- Overexpressed glycerol dehydrogenase (Figure. 4 Week 17) should be examined by MALDI-TOF MS/MS.
Cytochromes
Biosafety
Porines
- Successful Hexadecan-Assay for characterization of hydrophobicity of the outer membrane. Using Escherichia coli KRX Wildtyp and comparing it with:
- <bbpart>BBa_K1172502</bbpart>: <bbpart>BBa_K1172501</bbpart> + <bbpart>BBa_K525998</bbpart>
- <bbpart>BBa_K1172503</bbpart>: <bbpart>BBa_K1172501</bbpart> + <bbpart>BBa_J04500</bbpart>
- <bbpart>BBa_K1172504</bbpart>: <bbpart>BBa_K1172501</bbpart> + <bbpart>BBa_K608007</bbpart>
- <bbpart>BBa_K1172505</bbpart>: <bbpart>BBa_K1172501</bbpart> + <bbpart>BBa_K608006</bbpart>
- <bbpart>BBa_K1172507</bbpart>: <bbpart>BBa_K1172501</bbpart> + <bbpart>BBa_K608002</bbpart>
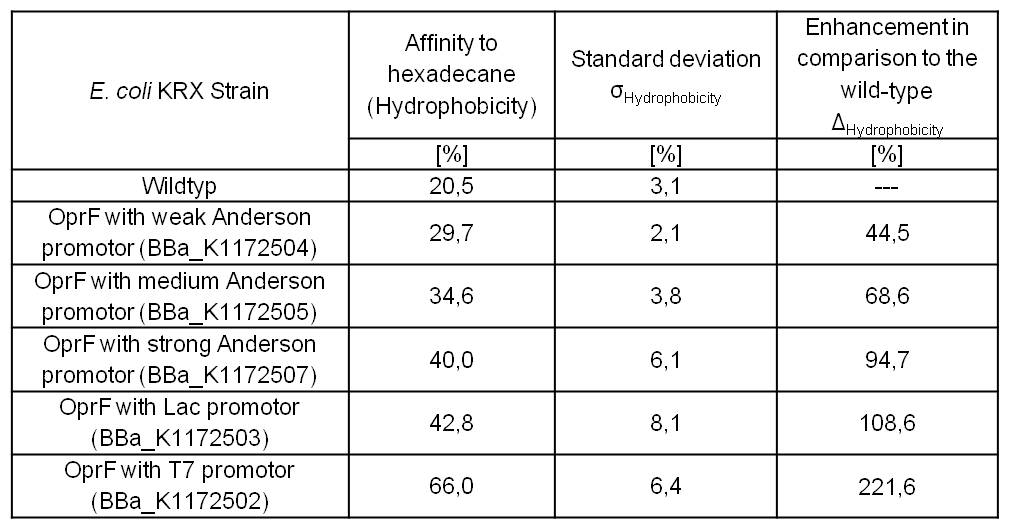
Table 3: Results of the Hexadecane-Hydrophobicity-Assay. Comparison of protein Hydrophobicity between Escherichia coli KRX wild type and Escherichia coli KRX with <bbpart>BBa_K1172502</bbpart>, <bbpart>BBa_K1172503</bbpart>, <bbpart>BBa_K1172504</bbpart>, <bbpart>BBa_K1172505</bbpart> and <bbpart>BBa_K1172507</bbpart>. Affinity to hexadecane (Hydrophobicity) with standard deviation and enhancement in comparison to the wild-type is shown.
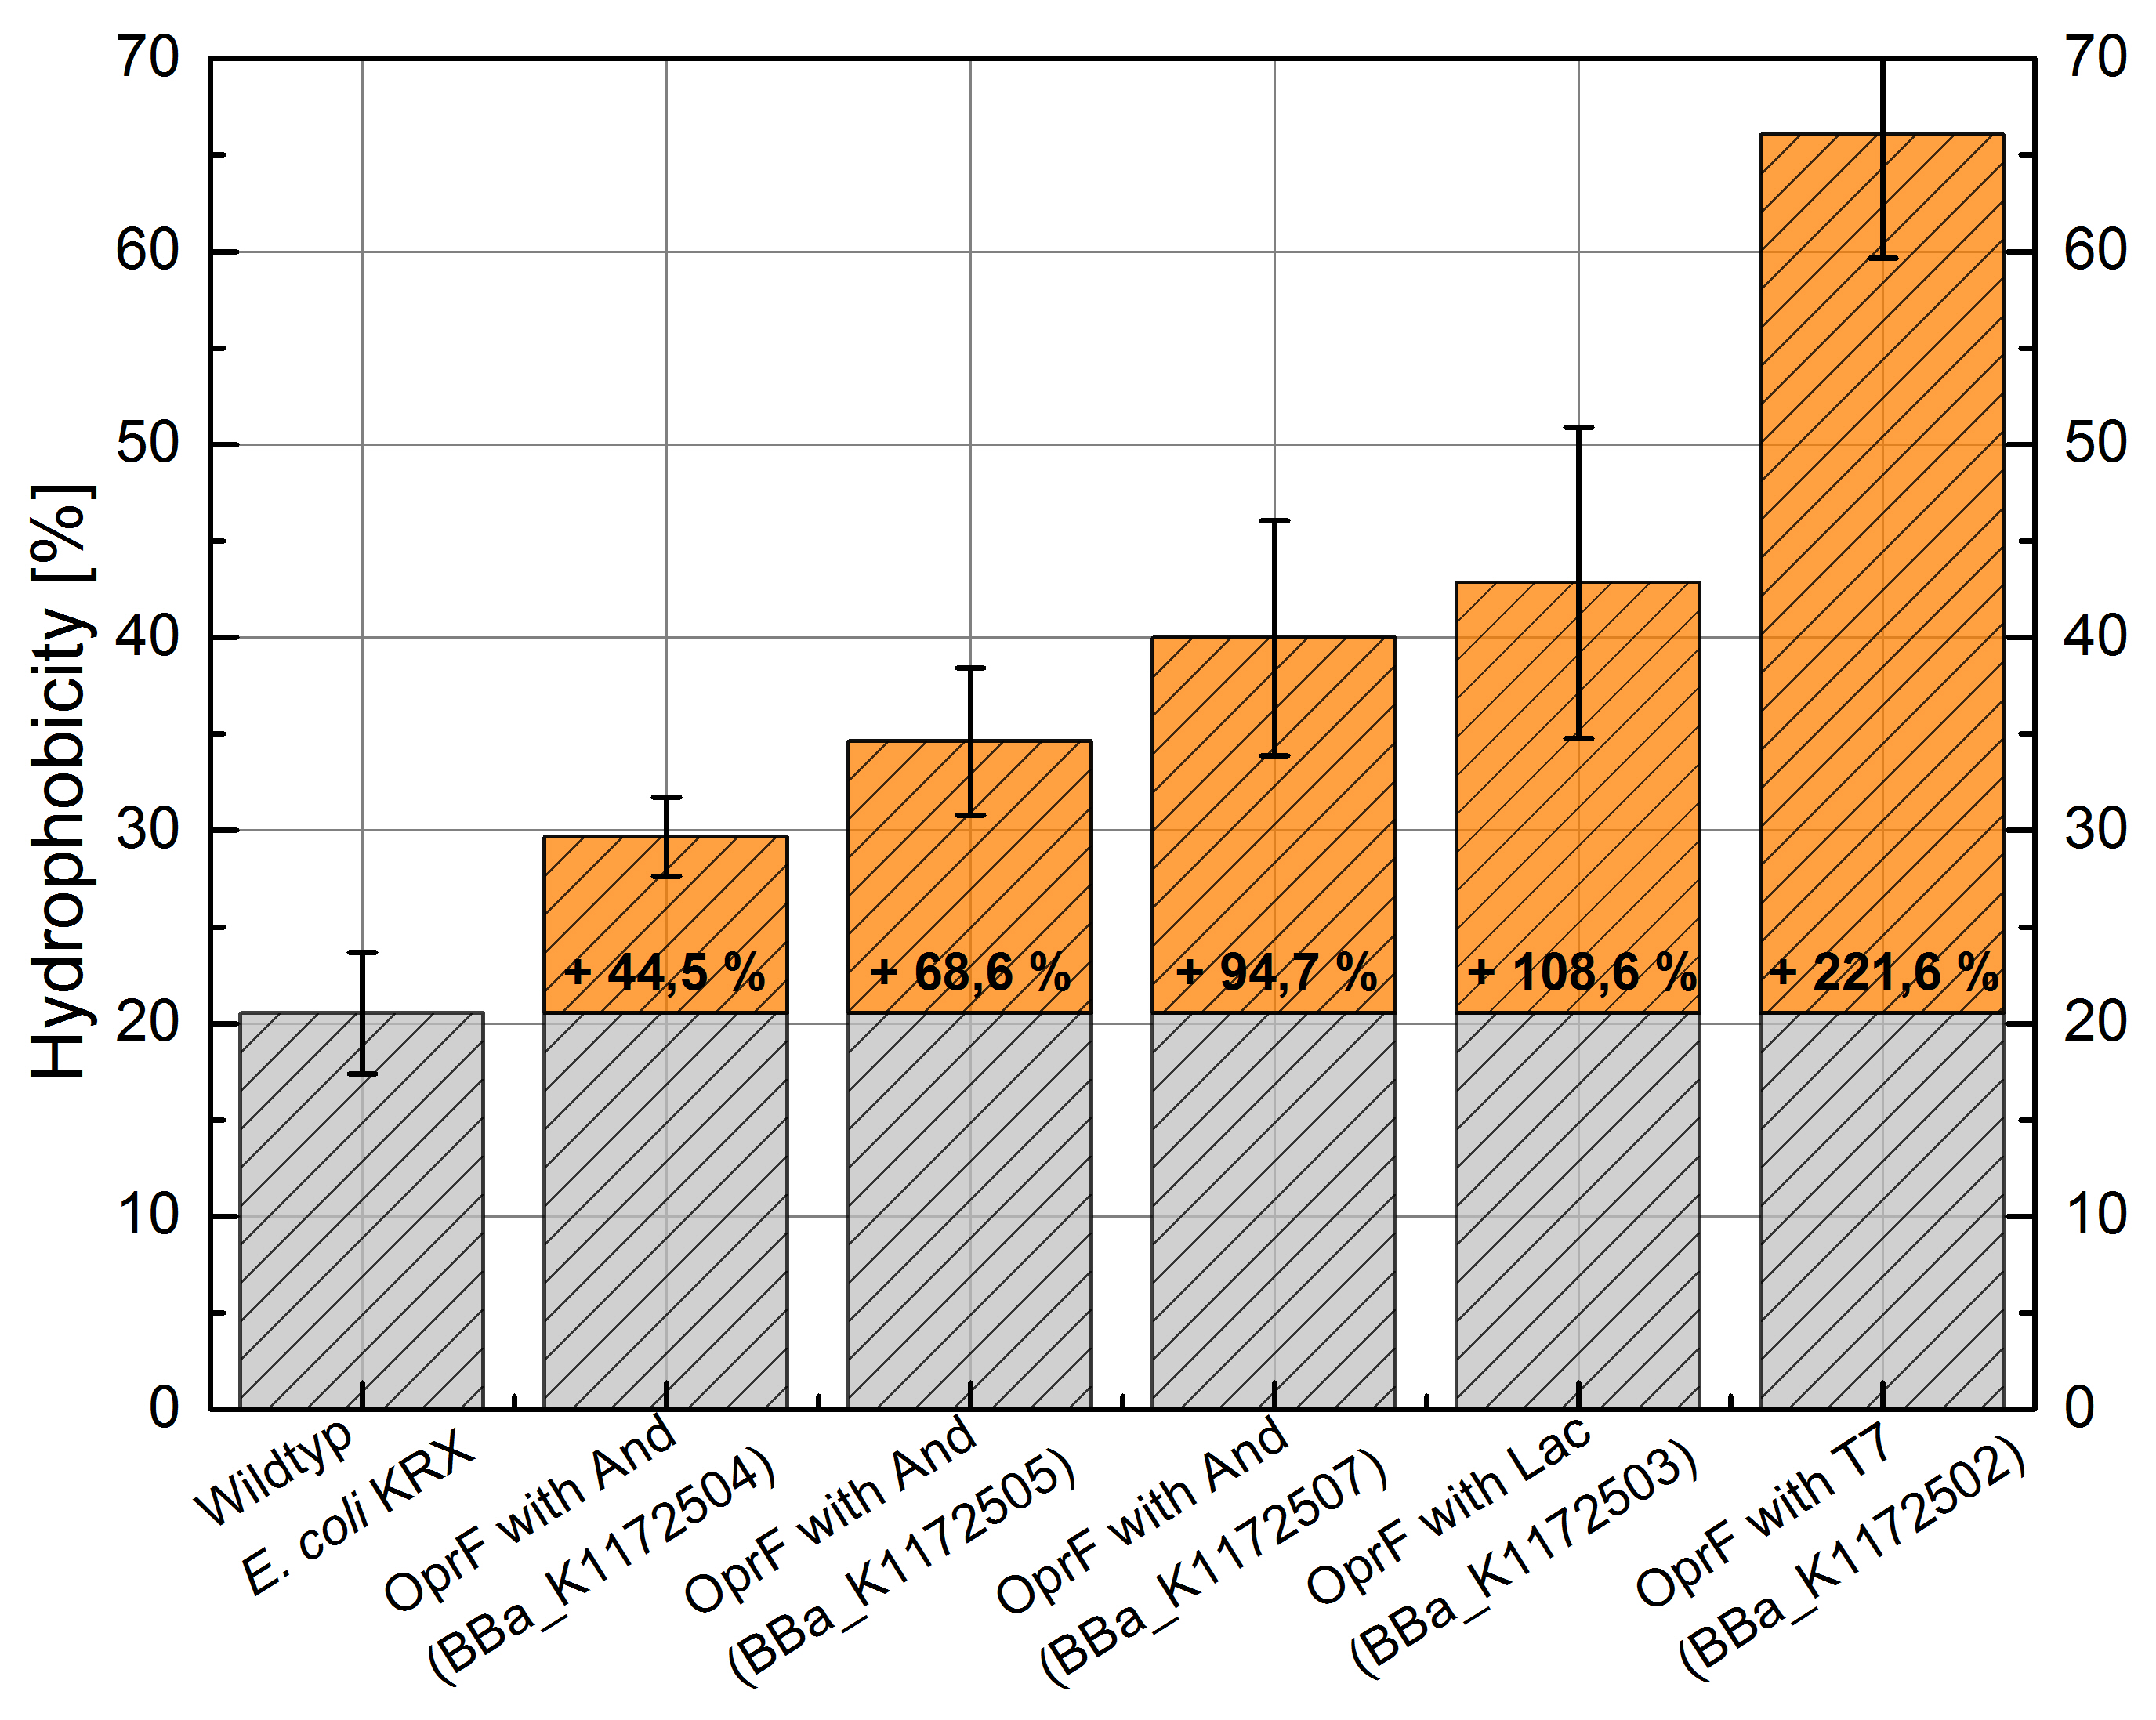
Figure 3: Results of the Hexadecane-Hydrophobicity-Assay. Comparison of protein Hydrophobicity between Escherichia coli KRX wild type and Escherichia coli KRX with <bbpart>BBa_K1172502</bbpart>, <bbpart>BBa_K1172503</bbpart>, <bbpart>BBa_K1172504</bbpart>, <bbpart>BBa_K1172505</bbpart> and <bbpart>BBa_K1172507</bbpart>. Affinity to hexadecane (Hydrophobicity) with standard deviation and enhancement in comparison to the wild-type is shown.
- The hydrophobicity increases continuously with increasing promoter strength up to 221% hydrophobizity in contrast to wildtyp strain.
- Successful ONPG and NPN uptake assays were performed. Membrane permeability is continuously increasing from weak to strong promoter strength.
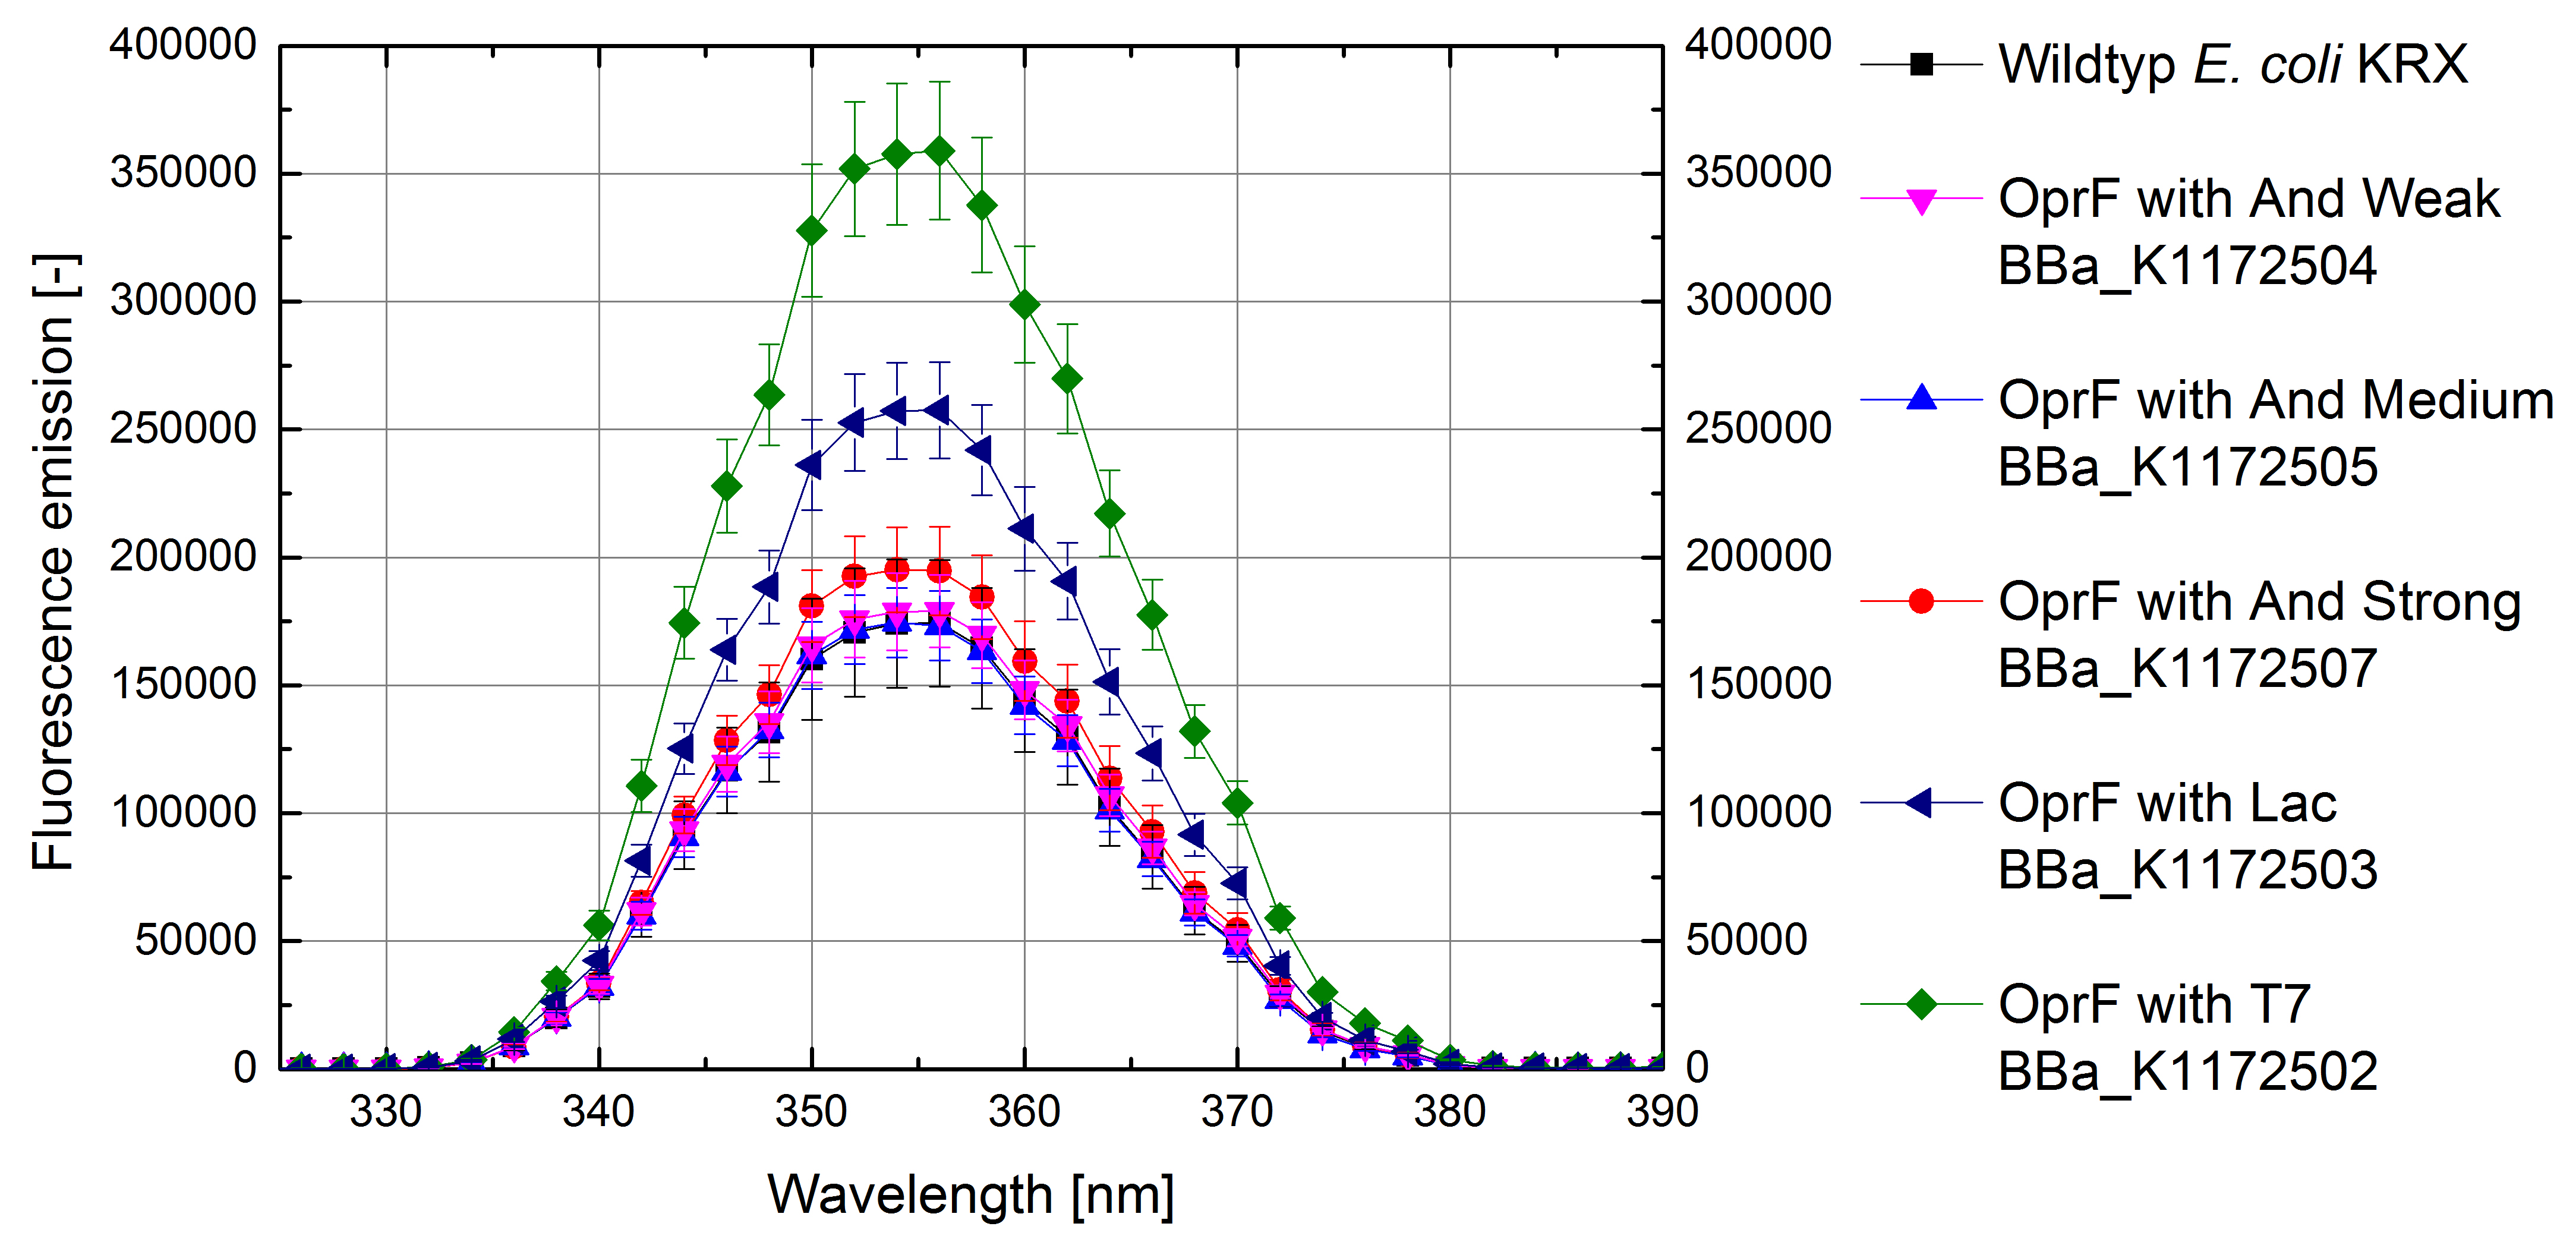
Figure 4: Results of the NPN-uptake-assay. Comparison of fluorescence emission between Escherichia coli KRX wild type and Escherichia coli KRX with <bbpart>BBa_K1172502</bbpart>, <bbpart>BBa_K1172503</bbpart>, <bbpart>BBa_K1172504</bbpart>, <bbpart>BBa_K1172505</bbpart> and <bbpart>BBa_K1172507</bbpart>. Fluorescence emission scan from 320 up to 390 nm wavelength with standard deviation is shown.
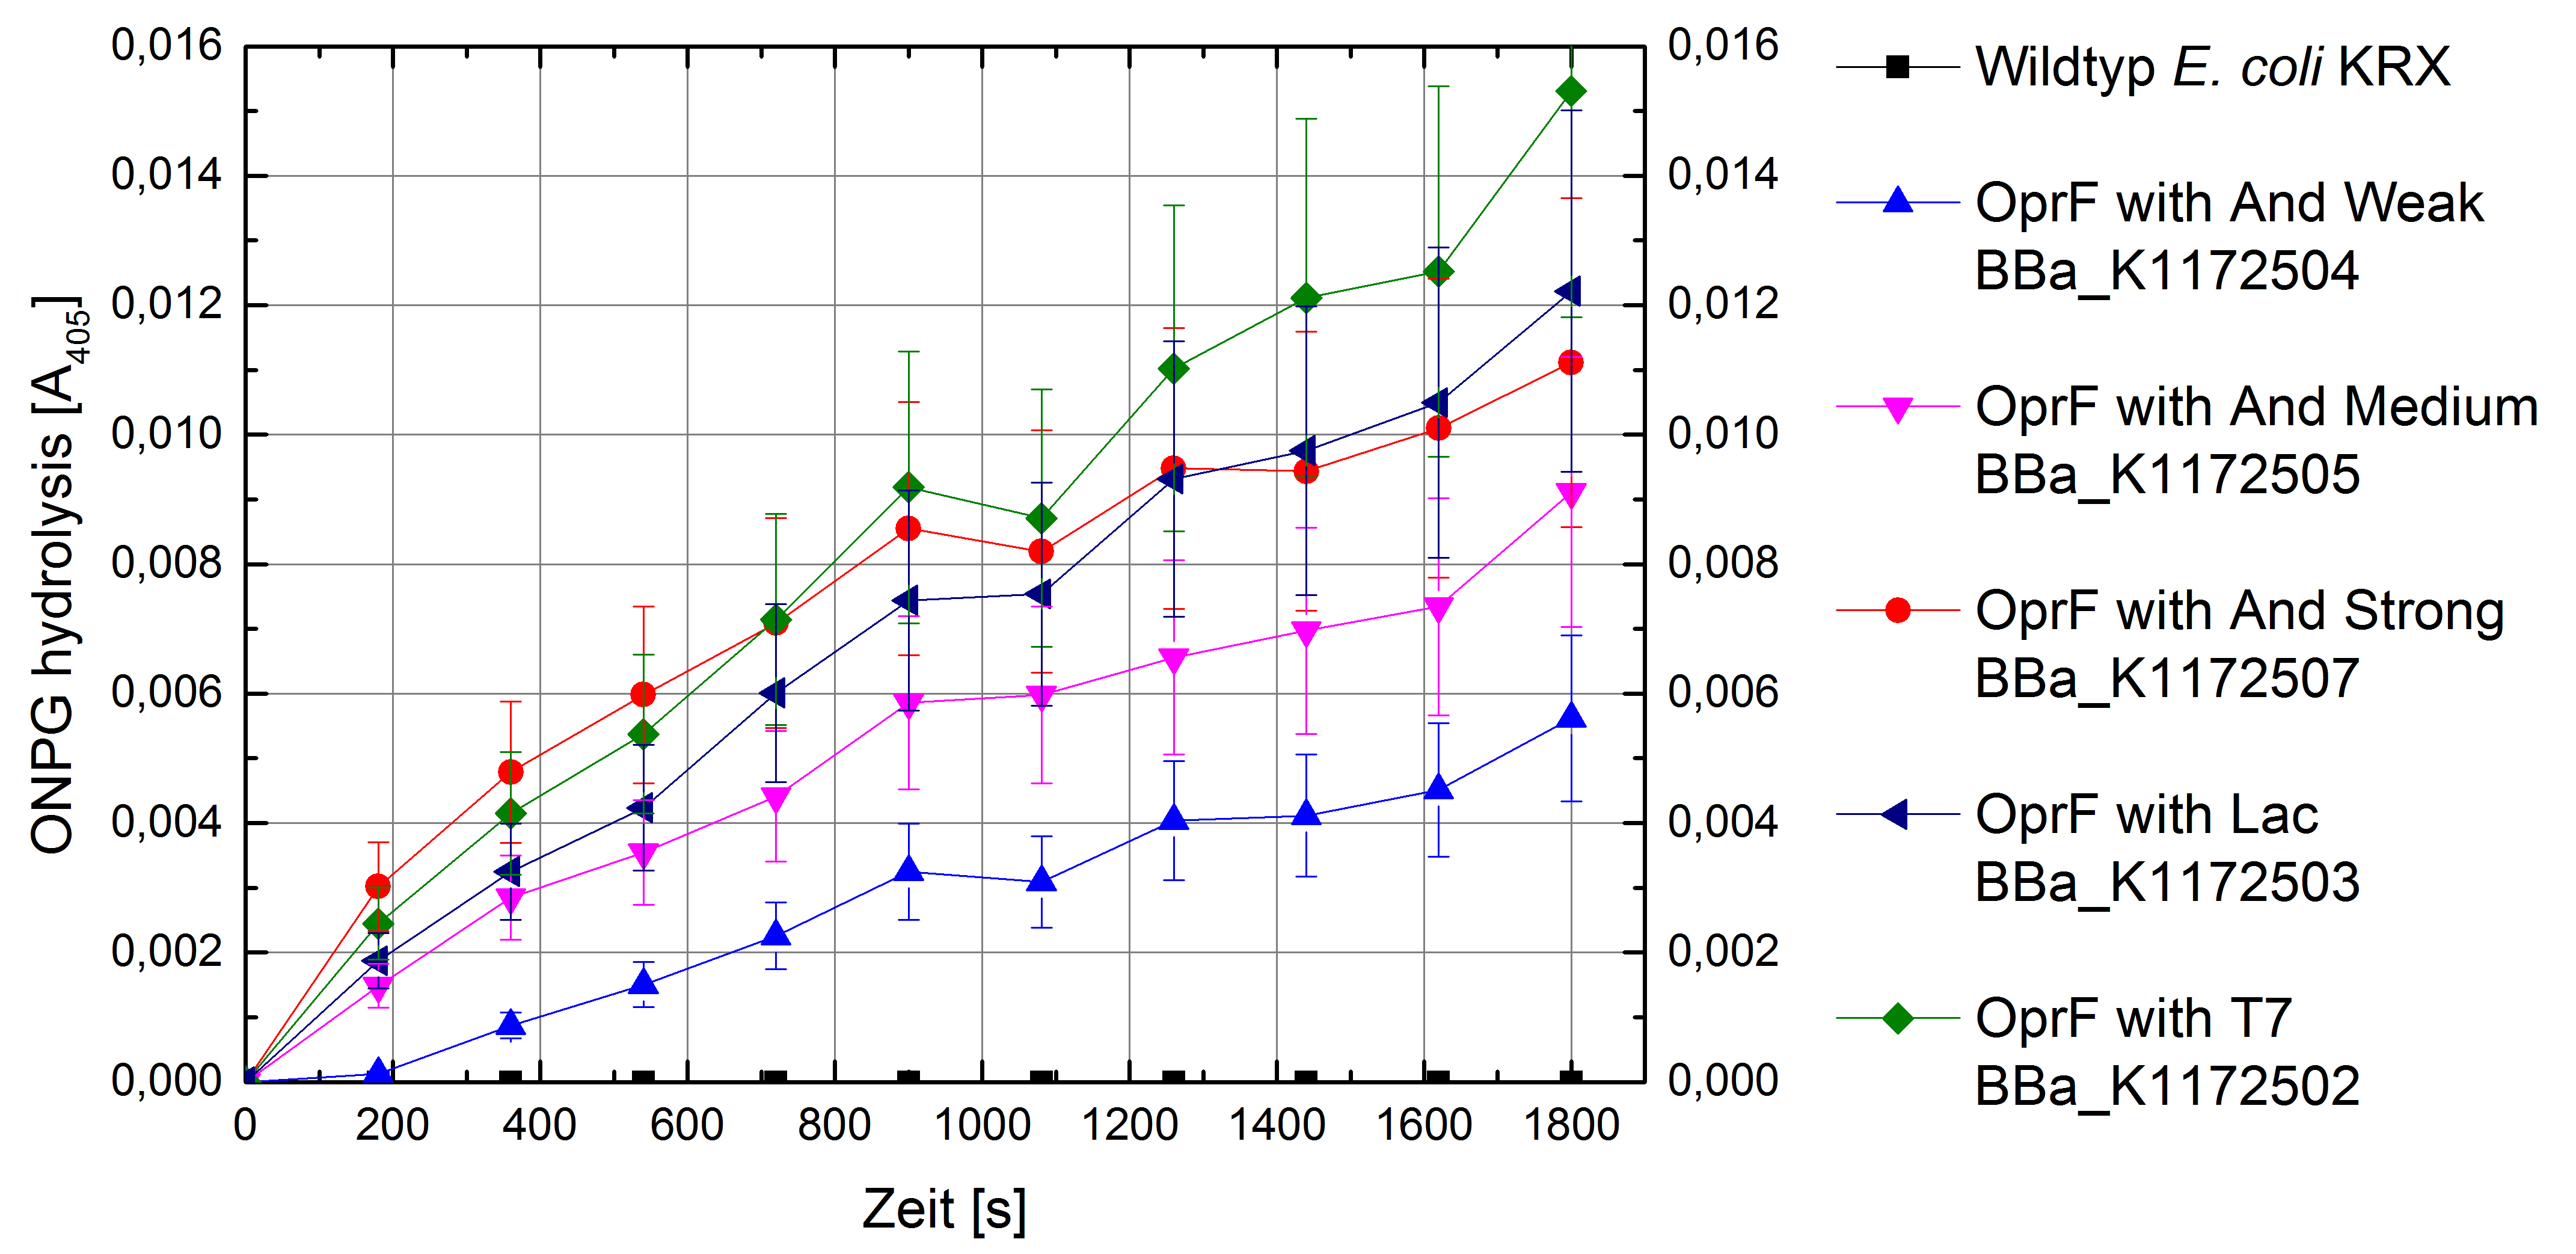
Figure 5: Results of the ONPG-uptake-assay. Comparison of ONPG hydrolysis between Escherichia coli KRX wild type and Escherichia coli KRX with <bbpart>BBa_K1172502</bbpart>, <bbpart>BBa_K1172503</bbpart>, <bbpart>BBa_K1172504</bbpart>, <bbpart>BBa_K1172505</bbpart> and <bbpart>BBa_K1172507</bbpart>. Absorbance at 405 nm wavelength with standard deviation is shown.
- Beside testing OprF Biobrick (<bbpart>BBa_K1172501</bbpart>) with different assays and SDS-PAGE, the membrane should be visually displayed. The technique of choice is atomic force microscopy.
- The glass slides were coated with Escherichia coli KRX wild type and Escherichia coli KRX with <bbpart>BBa_K1172502</bbpart> in order to compare the membrane differences. The AFM itself was performed with the help of the working group of Prof. Dr. Dario Anselmetti, with special help from Dr. Volker Walhorn.
Week 19
Organization
- Our WDR TV contribution could be seen in the ‘OWL local time’ and in the WDR library.
- We have successfully performed the day of synthetic biology in the city of Bielefeld. We were able to explain many people our project with the help of our poster and the kids had a lot of fun with performing different experiments for introducing them into scientific work. DNA isolation from fruit and vegetables, pipetting of bright colors, chromatography with markers, a potato battery and microscopy were on the program. All in all a very successful day.
MFC
Mediators
Cytochromes
Biosafety
Porines
- SDS-PAGE with improved protein isolation of outer membrane porin oprF by Release of periplasmic protein fraction from E. coli by cold osmotic shock using Cell fractionating buffer 2.2. There is a slight overexpression band for E.coli with T7 promoter (<bbpart>BBa_K1172502</bbpart>) at the expected size of OprF (36 kDa). But the gel is a little bit overloaded with protein. Maybe the SDS concentration in Cell fractionating buffer 2.2 was elected with 2% too high, which has led to partial cell lysis and total protein extraction.
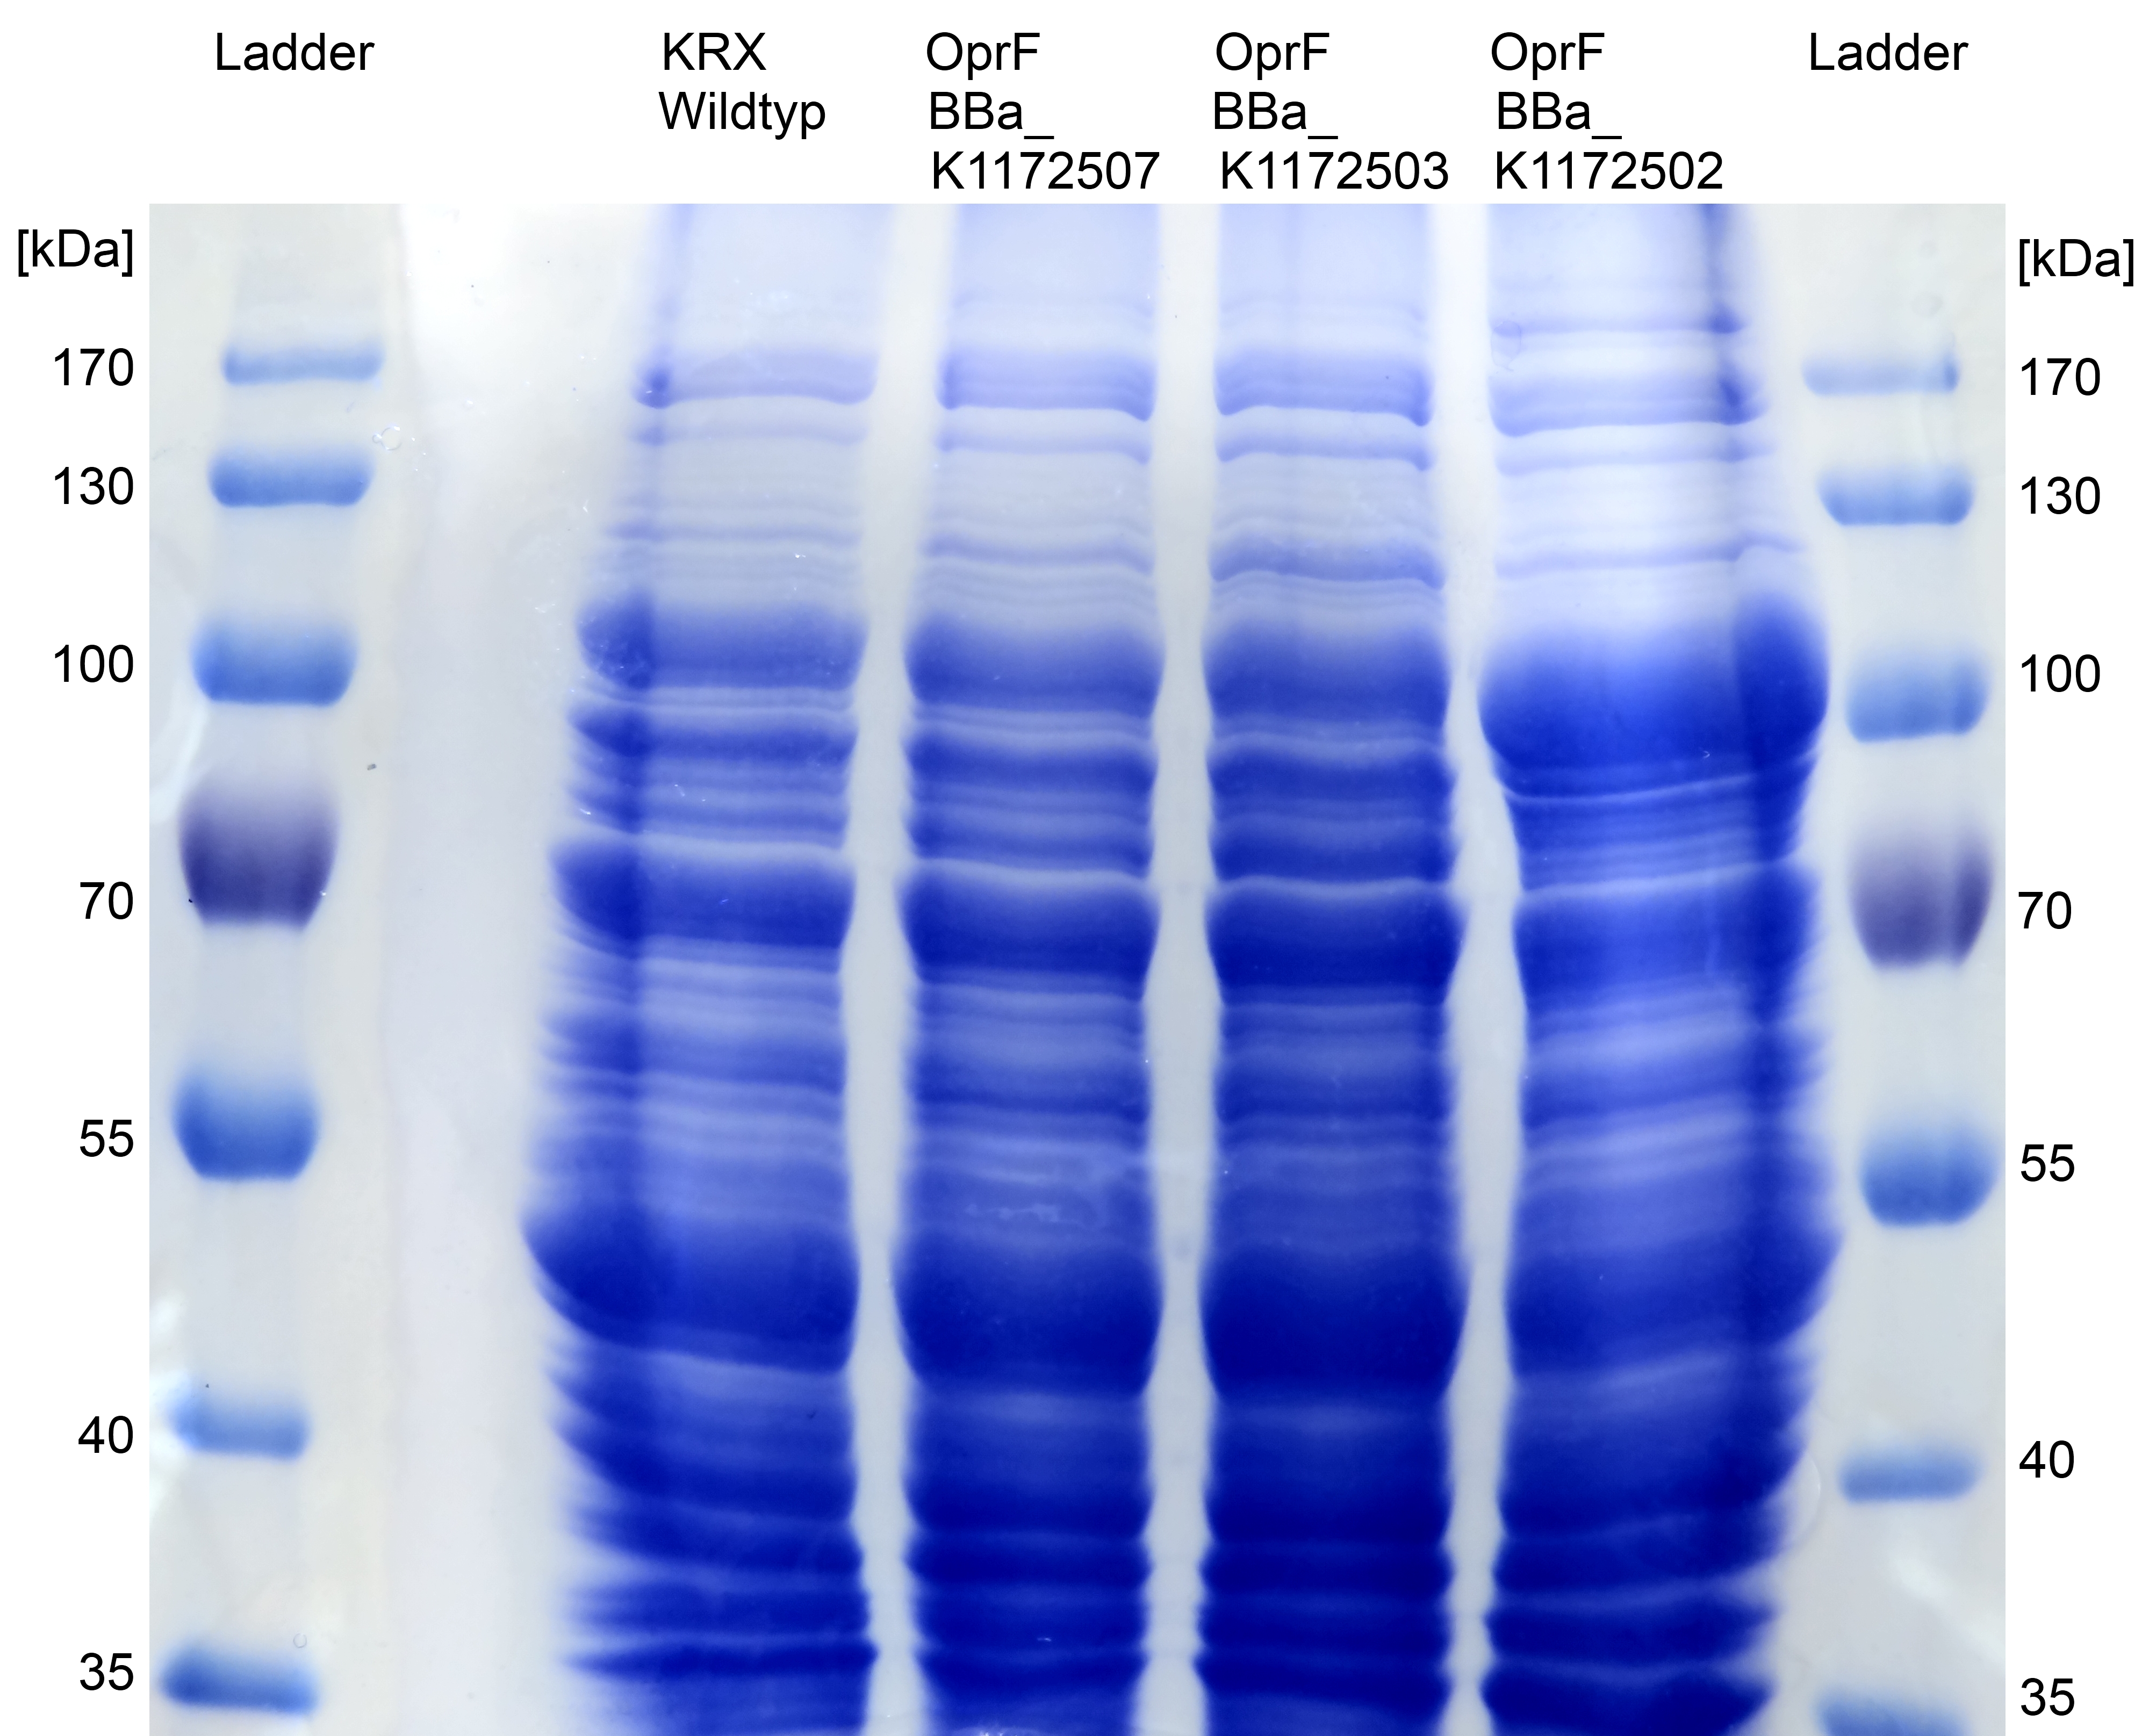
Figure 6: SDS-PAGE with Prestained Protein Ladder from Thermo Scientific as marker. Comparison of protein expression between Escherichia coli KRX wild type and Escherichia coli KRX with <bbpart>BBa_K1172502</bbpart>, <bbpart>BBa_K1172503</bbpart> and <bbpart>BBa_K1172507</bbpart> after periplasmic protein fractioning with Cell fractioning buffer 2.2.
- Further improving of cell fractioning for protein isolation of outer membrane porin oprF by Release of periplasmic protein fraction from E. coli by cold osmotic shock using Cell fractionating buffer 2.3.
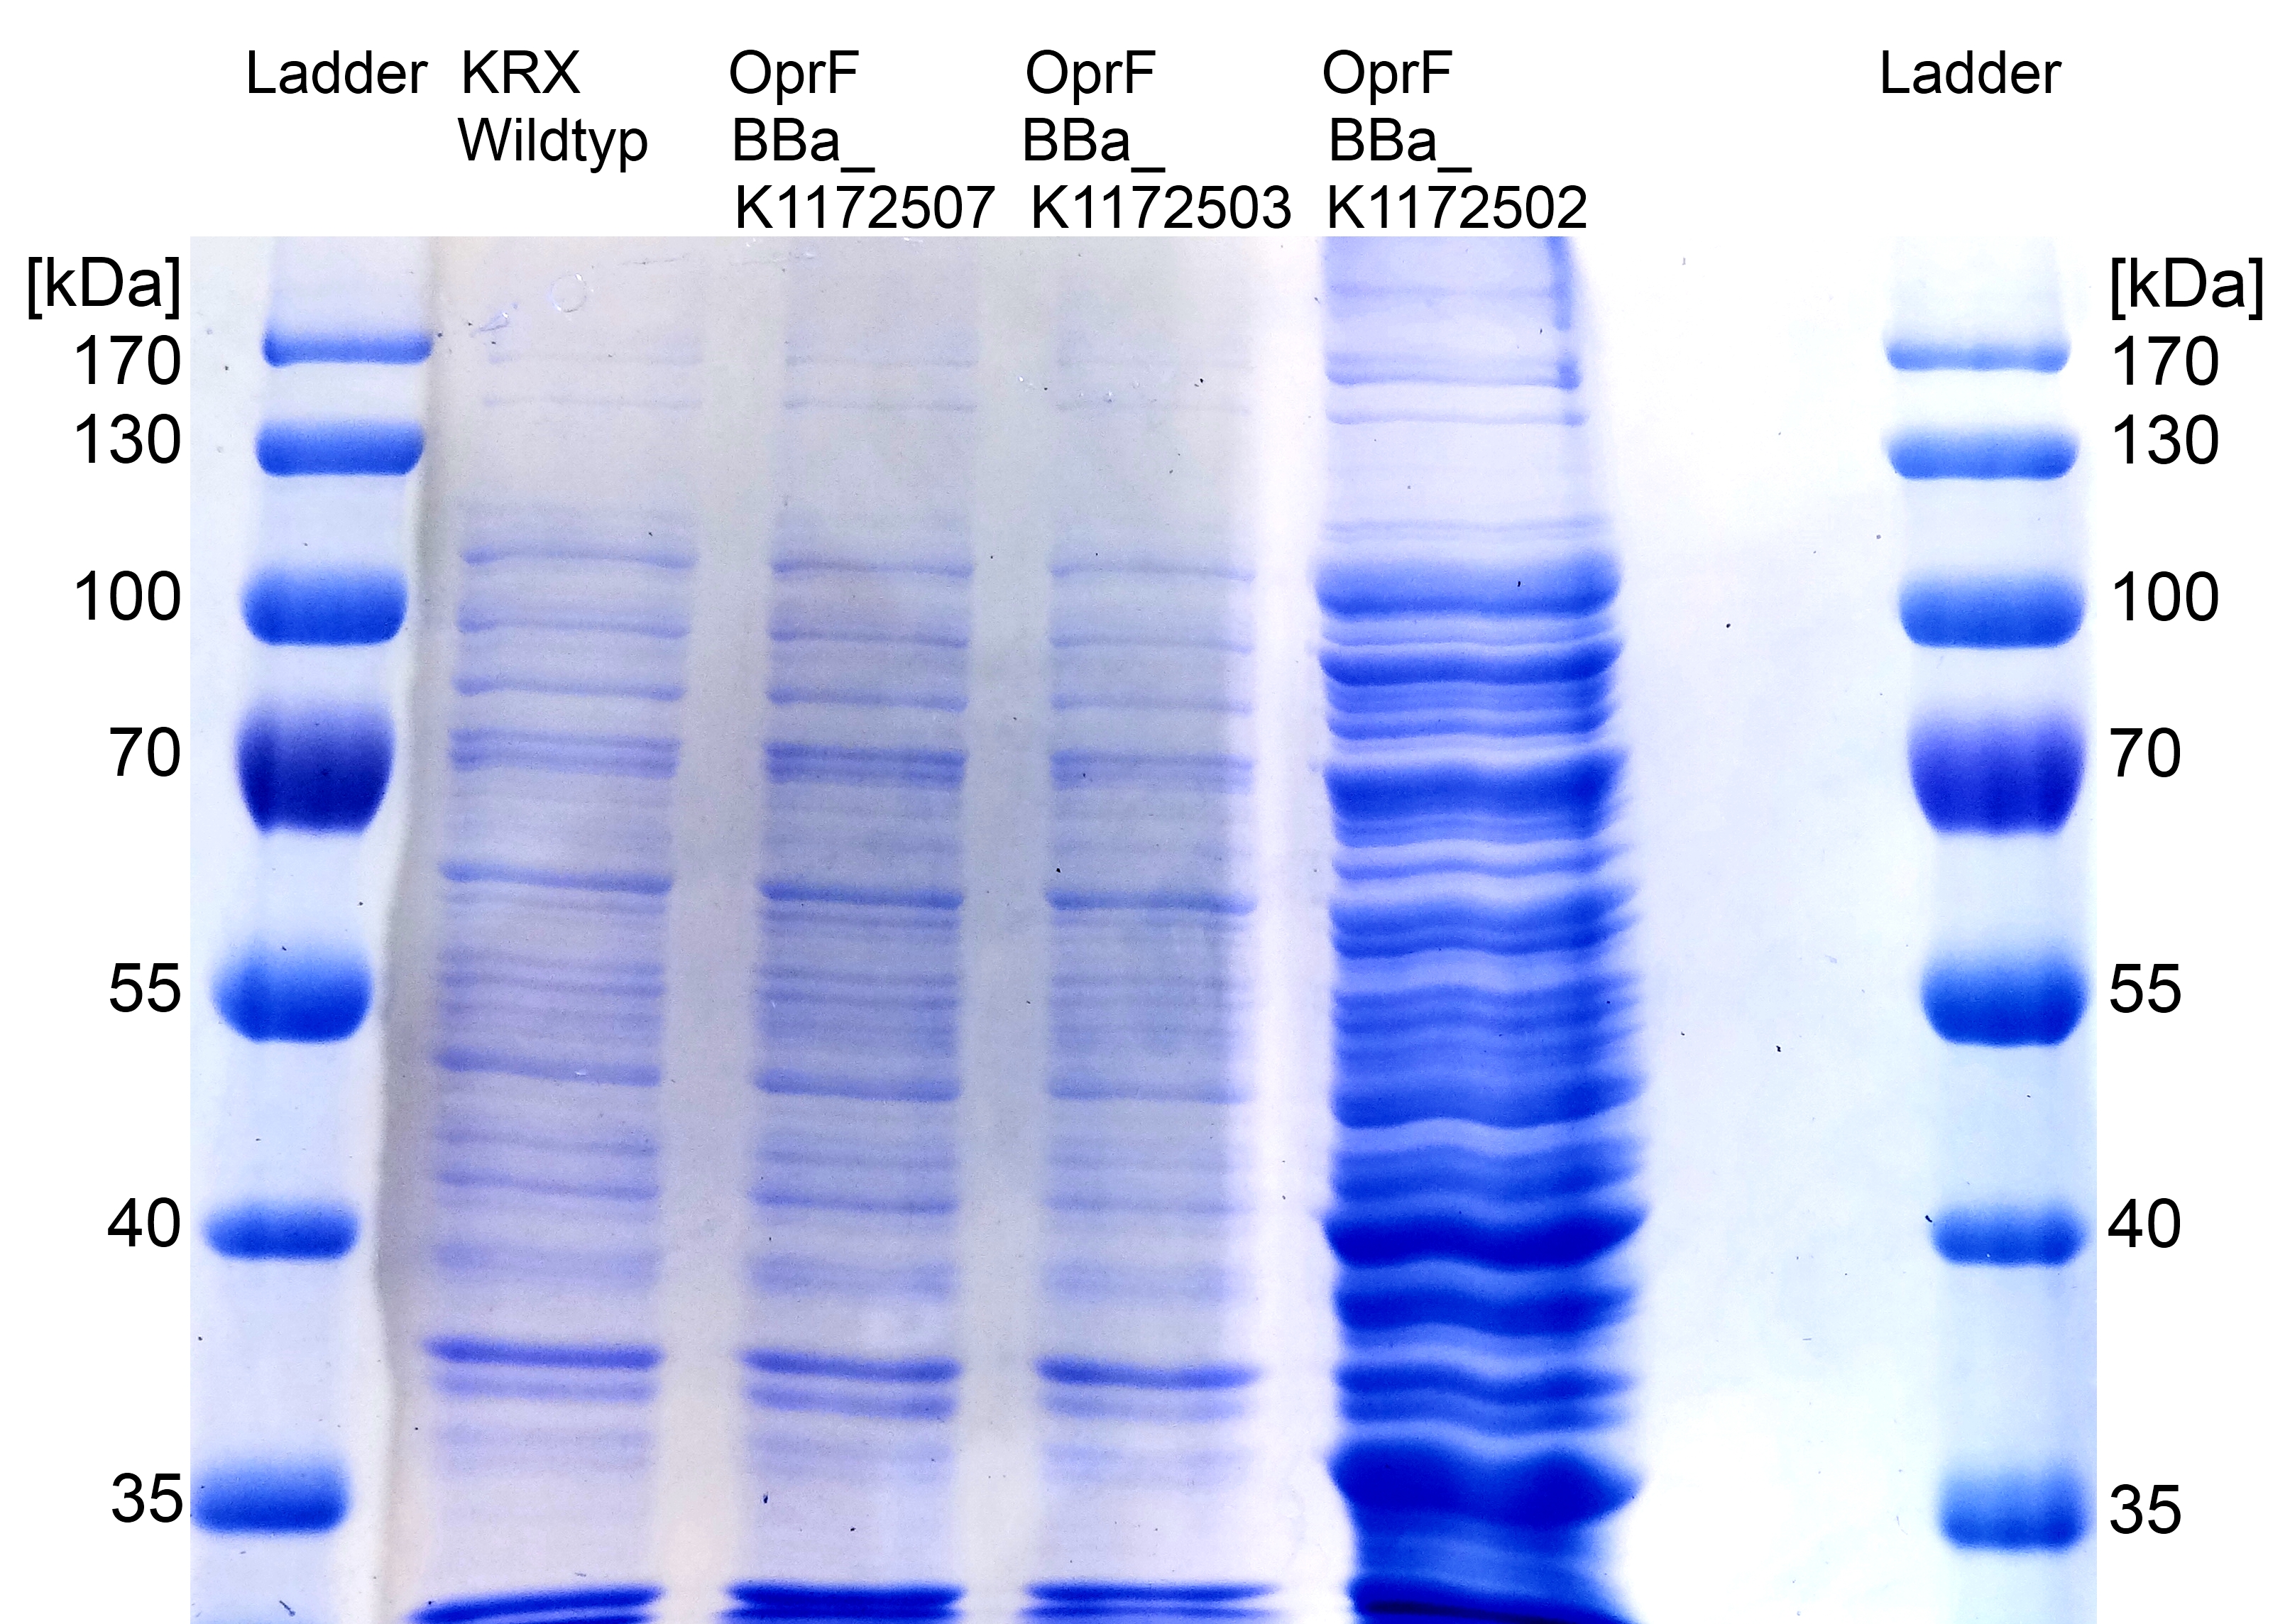
Figure 7: SDS-PAGE with Prestained Protein Ladder from Thermo Scientific as marker. Comparison of protein expression between Escherichia coli KRX wild type and Escherichia coli KRX with <bbpart>BBa_K1172502</bbpart>, <bbpart>BBa_K1172503</bbpart> and <bbpart>BBa_K1172507</bbpart> after periplasmic protein fractioning with Cell fractioning buffer 2.3.
- The SDS-PAGE shows a significantly higher protein concentration for E.coli with OprF and T7 promoter (<bbpart>BBa_K1172502</bbpart>). It seems to be that the higher membrane permeability allows a better release of membrane proteins by 0.2 % SDS. Nevertheless, we can see a strong overexpression band at the expected OprF size of about 36 kDa for <bbpart>BBa_K1172502</bbpart>, which is equated with a strong expression and overproduction of OprF.
- Overexpressed outer membrane porin (Figure. 5) should be examined by MALDI-TOF MS/MS.
- Tryptic digest of gel lanes for analysis with MALDI-TOF.
- Outer membrane porin was examined by MALDI-TOF MS/MS with a Mascot Score of 222 against bacteria database.
Week 20
Organization
- iGEM-Team Bielefeld 2013 T-shirts and hoodies were designed and are in production. Orange shirts with a great Ecolectricity logo. We are pleased to wear them in Lyon.
- As announced, we have participated at the conference '60 Years of DNA’ in Berlin at 14. September and received good reviews for our project.
MFC
Mediators
- Glycerol dehydrogenase
- Glycerol dependent NADH-Assay with Escherichia coli KRX Wildtyp strain and E. coli KRX with pSB1C3 and <bbpart>BBa_K1172203</bbpart> by testing supplementation of different glycerol concentrations to the LB-medium.
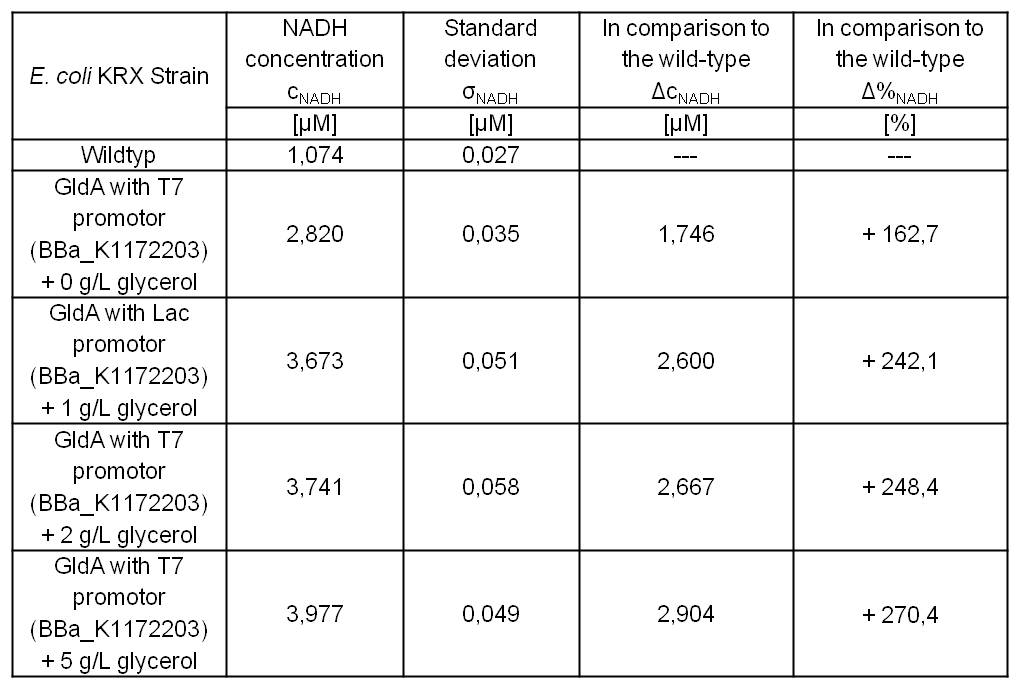
Table 5: Results of the NADH-Assay. Comparison between Escherichia coli KRX Wildtyp and Escherichia coli KRX with <bbpart>BBa_K1172203</bbpart> supplemented with different amounts of glycerol to LB-medium. NADH concentration with standard deviation and concentration in comparison to the wild-type is shown.
- NADH-Assay shows a quiet good NADH overproduction for <bbpart>BBa_K1172203</bbpart> with increasing glycerol concentration.
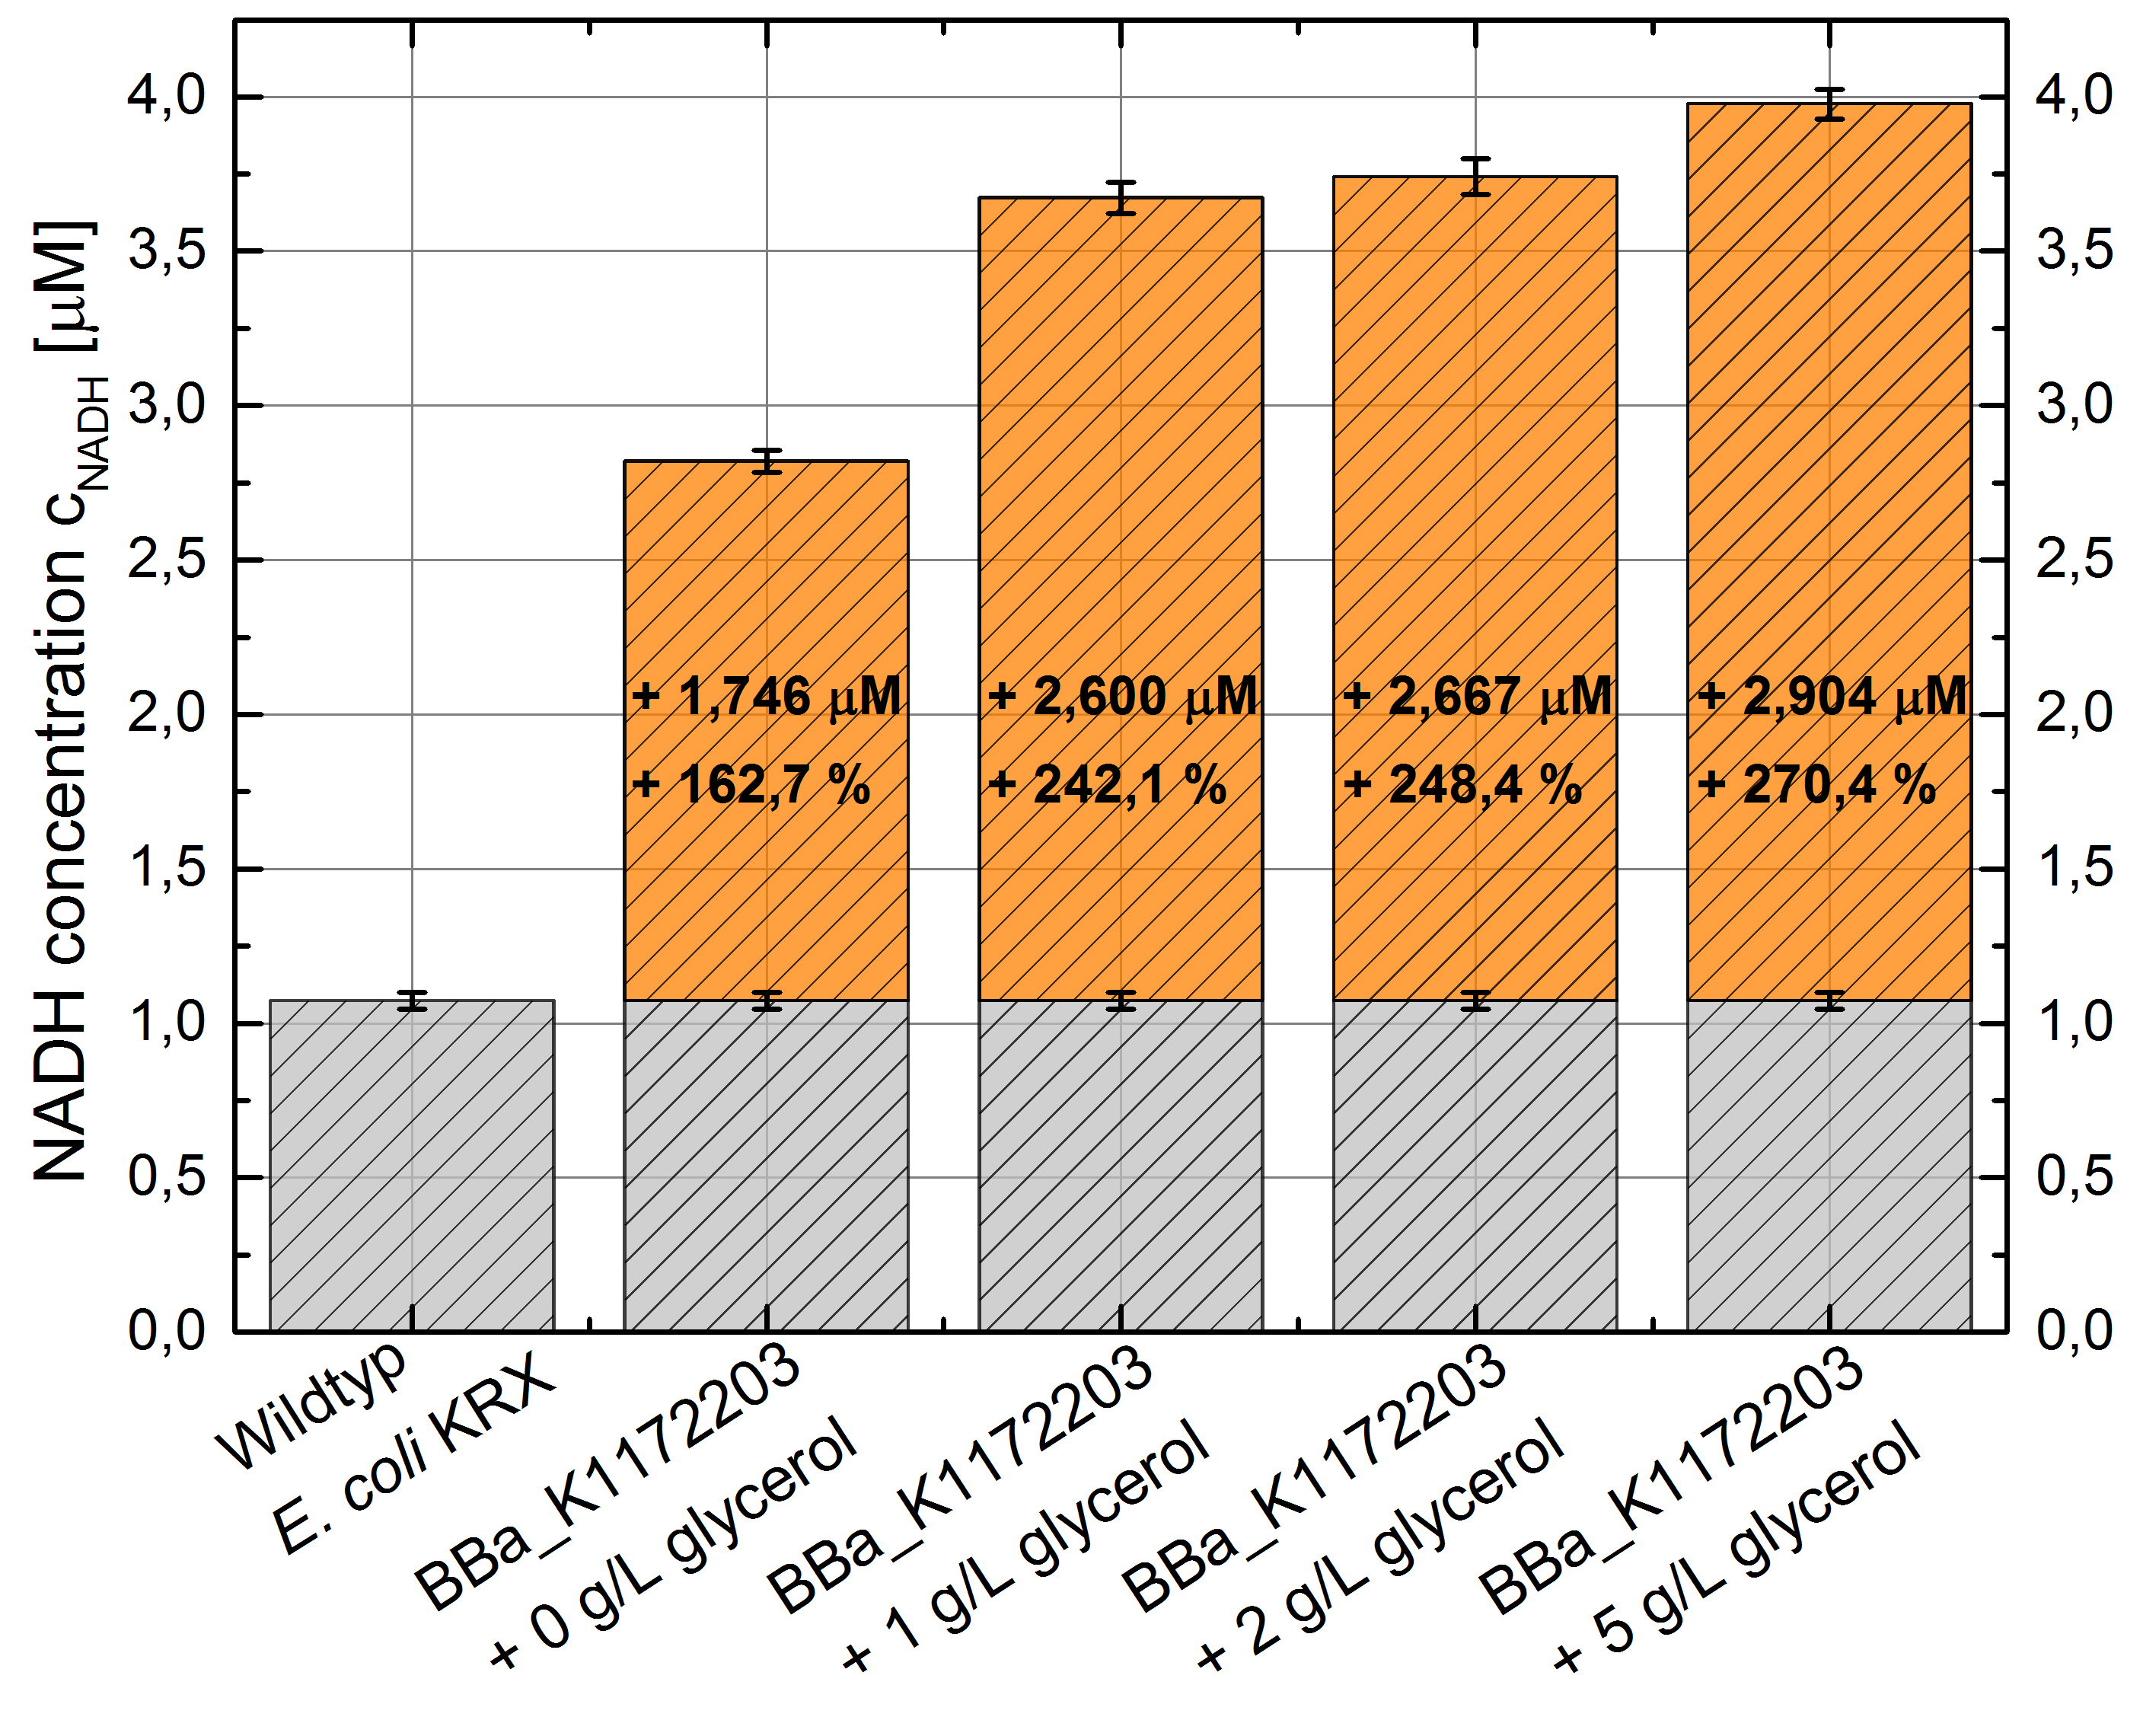
Figure 8: Column Chart with results of the NADH-Assay. Comparison between Escherichia coli KRX Wildtyp and Escherichia coli KRX with <bbpart>BBa_K1172203</bbpart> supplemented with different amounts of glycerol to LB-medium. NADH concentration with standard deviation and concentration in comparison to the wild-type is shown.
Cytochromes
Biosafety
Porines
Week 21
Organization
MFC
Mediators
- Glycerol dehydrogenase
- Glycerol dependent NADH-Assay with Escherichia coli KRX Wildtyp strain and E. coli KRX with pSB1C3 and <bbpart>BBa_K1172203</bbpart> by testing different glycerol concentrations of M9-medium.
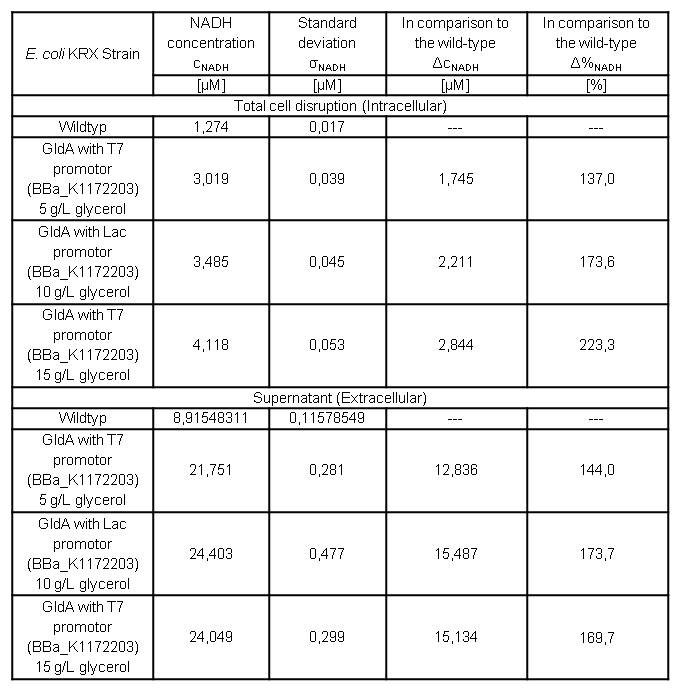
Table 7: Results of the NADH-Assay. Comparison between Escherichia coli KRX Wildtyp and Escherichia coli KRX with <bbpart>BBa_K1172203</bbpart> grown in M9-medium with different concentrations of glycerol. NADH concentration with standard deviation and concentration in comparison to the wild-type is shown for cell disruption and supernatant fraction.
- NADH-Assay shows an increasing intra- and extracellular NADH concentration for <bbpart>BBa_K1172203</bbpart> with increasing glycerol concentration in M9-medium.
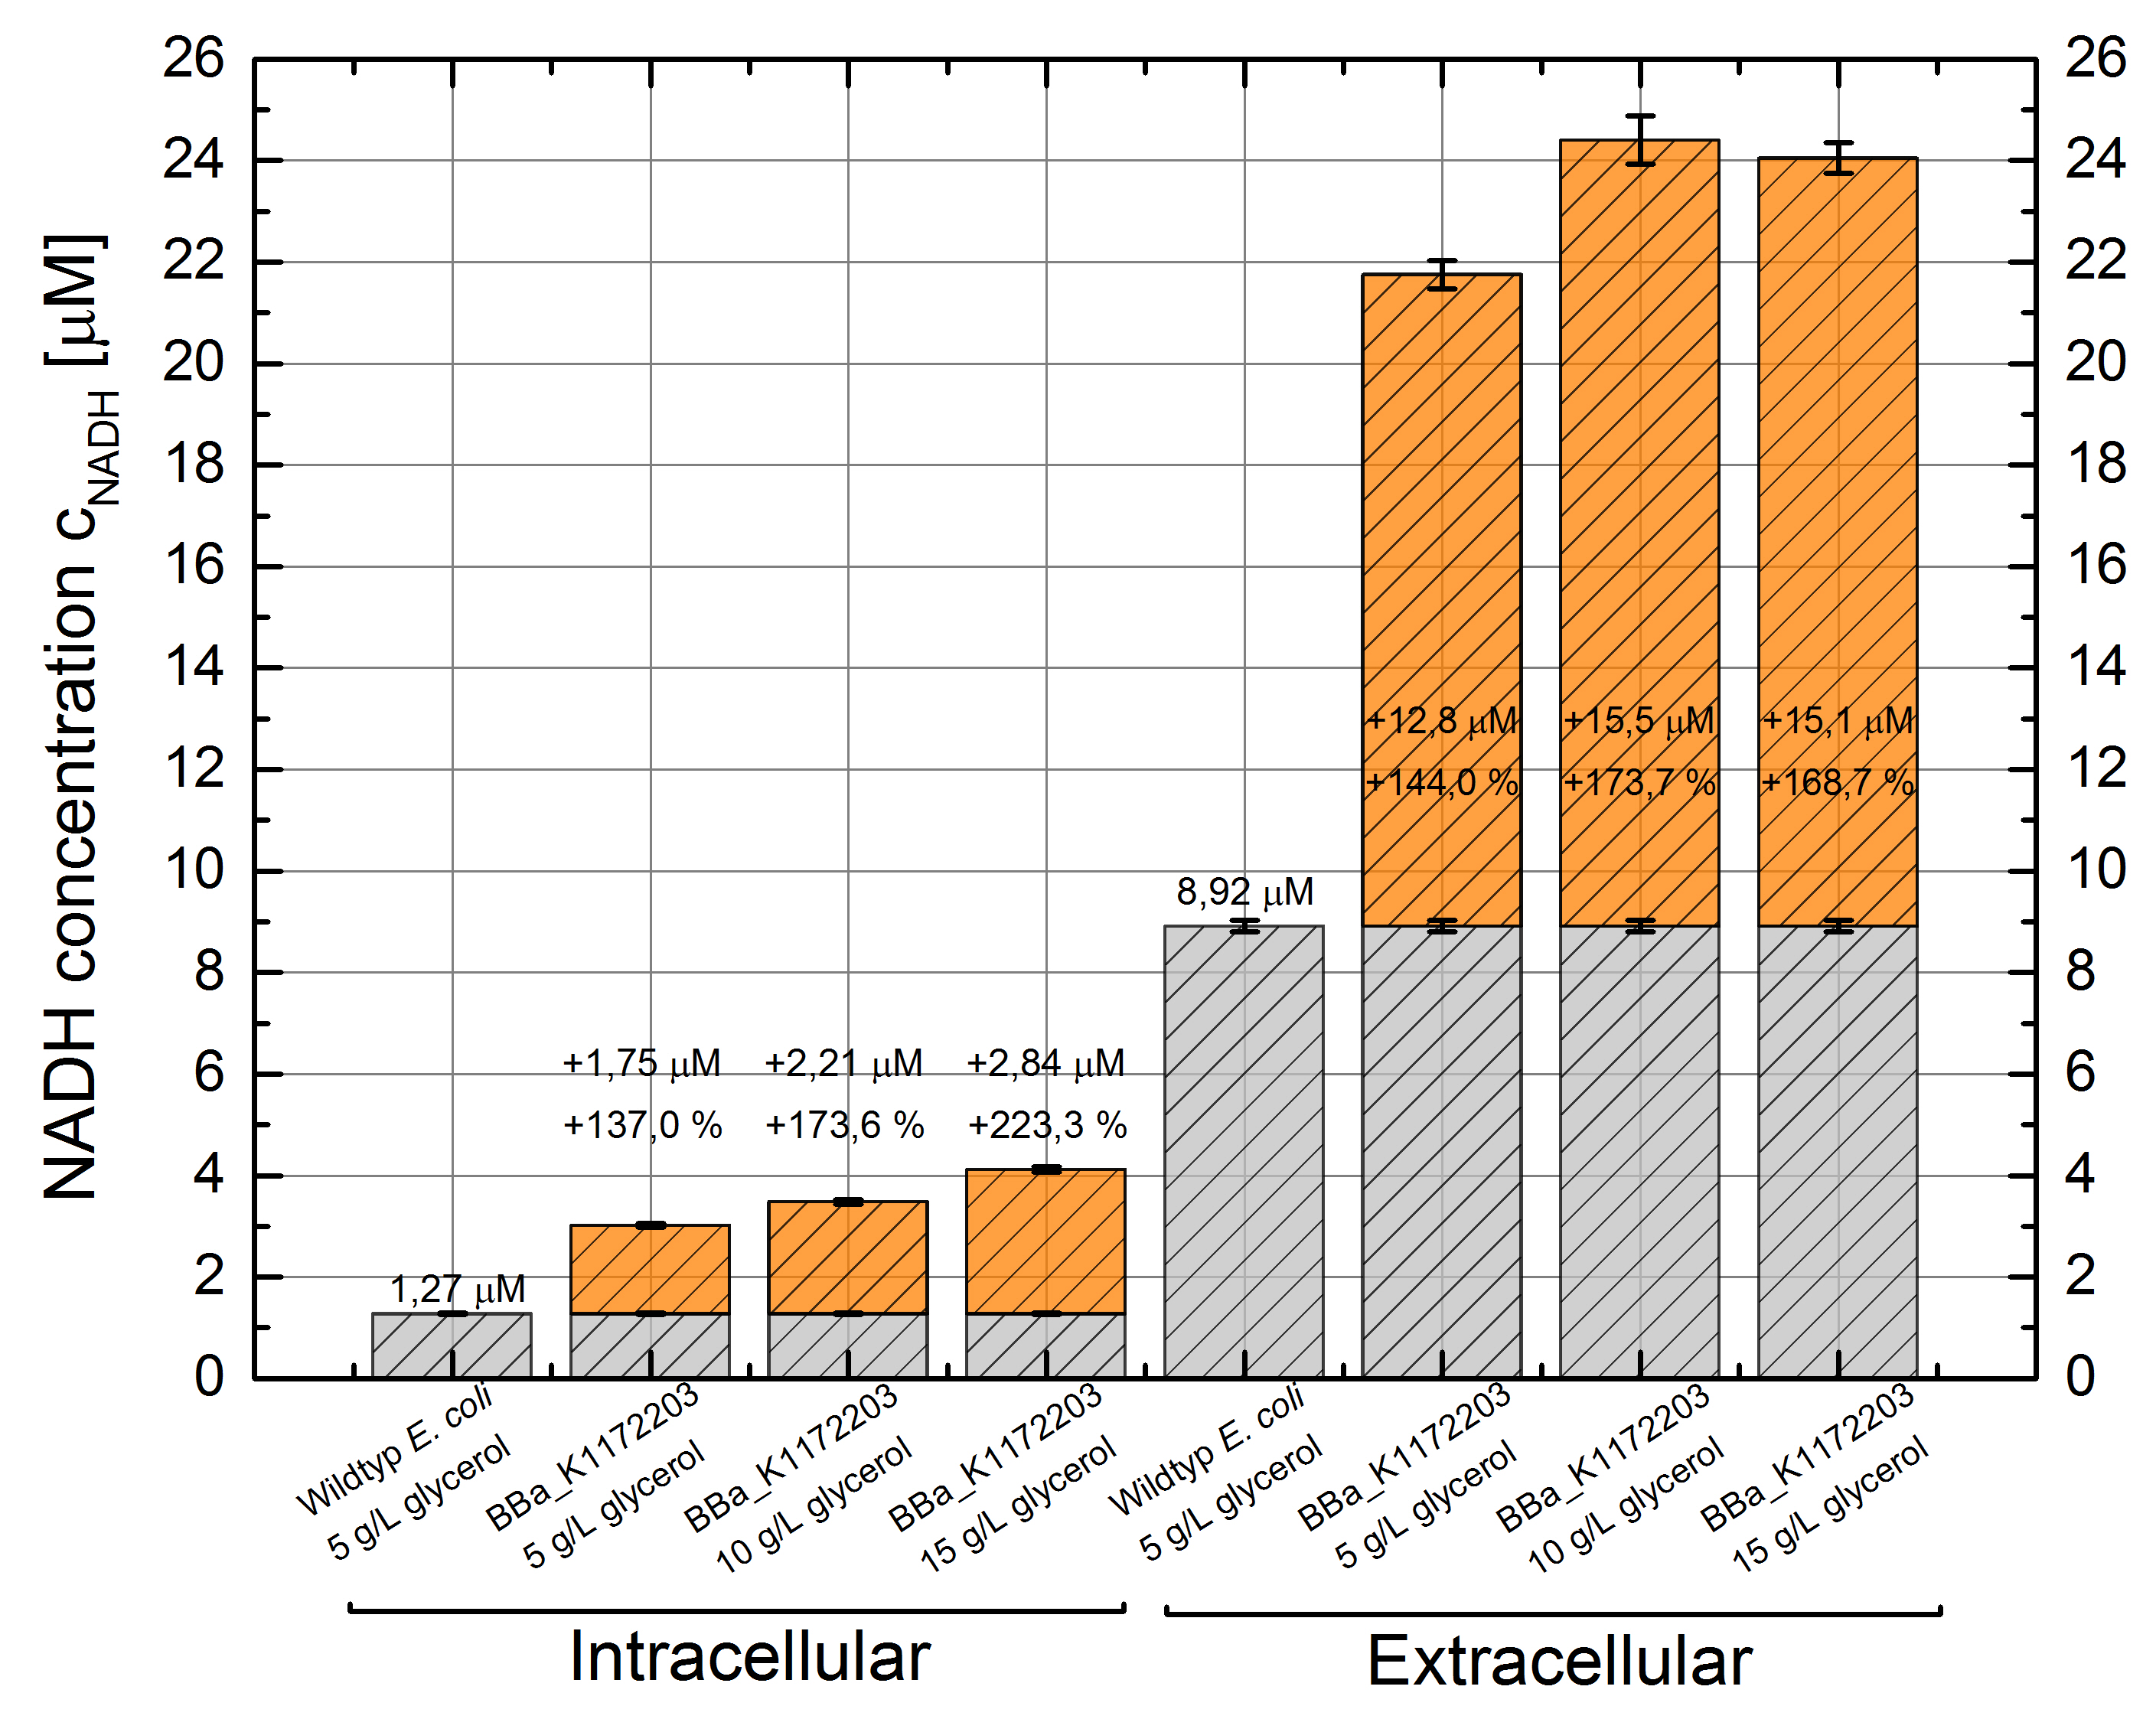
Figure 9: Column Chart with results of the NADH-Assay. Comparison between Escherichia coli KRX Wildtyp and Escherichia coli KRX with <bbpart>BBa_K1172203</bbpart> grown in M9-medium with different concentrations of glycerol. NADH concentration with standard deviation and concentration in comparison to the wild-type is shown for cell disruption (Intracellular) and supernatant (Extracellular) fraction.
Cytochromes
Biosafety
Porines
Contents |
 "
"

