 "
"
Team:Bielefeld-Germany/Project/MFC
From 2013.igem.org
Microbial Fuel Cell
Overview

A microbial fuel cell (MFC) can be utilized for power generation through the conversion of organic and inorganic substrates using microorganisms. The fuel cell generally consists of two separate units, the anode and cathode compartment, which are separated by a proton exchange membrane (PEM). Microorganisms, acting as biocatalysts, release electrons during metabolic reactions and transfer them to the anode of the fuel cell. The protons being freed up during this process are transferred to the cathode compartment through the PEM. The electrons pass through an external load circuit to the cathode, where they reduce an electron acceptor. Thus, an electric current is generated. The most important property of such a system is the bacteria's ability to transfer electrons to the anode. There are lots of other aspects to consider though, all of which are vital for the successful operation of a fuel cell.
Most existing projects rely on using mixed cultures of different bacteria in the anode compartment. However, in most cases these systems are not very well characterized. Often it is not even known which species are part of these cultures. This makes it almost impossible to improve the system by directed genetic engineering. Applying such a black box system outside of a laboratory might also pose safety risks, since it may contain pathogenic cultures. Another disadvantage is, that some of the species might be quite sensitive to different kinds of stress, like Geobacter sulfurreducens, which are very susceptible to oxidative stress.
For these reasons, Bielefelds 2013 iGEM Team decided to develop a system which only relies on E. coli for power generation. The main benefit being that these bacteria grow fast and are quite robust regarding cultivation conditions. Another advantage over a mixed culture is that the potential risks of using such a single-strain culture are much more easily assessed and can be reduced by systematic manipulation of the bacterial genome.
Theory
Cultivation conditions
In general, microorganisms utilize three different methods to release electrons produced during the metabolic oxidation of high-energy organic or inorganic substrates. Because the reduction of oxygen, also called aerobic respiration, is the most efficient method for many bacteria, including Escherichia coli, these metabolic pathways are preferred when oxygen is available. In a microbial fuel cell, however, an aerobic metabolism is not desirable, since the electrons are directly transferred to oxygen and thereby cannot be used to produce current. Thus, anaerobic cultivation conditions are necessary.
Without oxygen, bacteria can generate energy through different forms of fermentation and anaerobic respiration. During fermentation and anaerobic respiration, electrons are directly transferred to soluble electron acceptors. In case of Escherichia coli, mixed acid fermentation under formation of metabolic end products like lactate, acetate and ethanol has to be avoided by the choice of suitable cultivation parameters. Their formation and accumulation would effect a comparatively limited electron production and hamper bacterial survival.
Based on these considerations, anaerobic respiration is left as the only suitable option for current generation in a fuel cell, when using the electrode as the terminal electron acceptor. For this reason, construction of the fuel cell, cultivation parameters and genetic modifications of Escherichia coli are aimed at enabling anaerobic respiration.
- Requirements:
- avoid aerobic respiration
- avoid fermentation
- accelerate anaerobic respiration
Measurement system and protocol
The setup described here is intended for acquisition of comparable data regarding the power output gained with different bacteria strains while using mediators for the electron transfer.
When operating a microbial fuel cell, numerous different factors influence the power output that can be measured. Number and growth phase of the bacteria in the anode chamber are among the most important. The reaction taking place in the cathode is just as critical, since a bad setup can lead to the speed of the anode reaction significantly declining over time or not taking place at all. The properties of the proton exchange membrane and the electrodes are also quite important for the speed of the reaction.
Choosing an appropriate resistance is also vital. If the resistance is too high, reduced mediator species accumulate at the anode and the voltage measured does not provide information about how fast the bacteria are able to reduce the mediator. Other factors come into play as well: The diffusion speed of the mediator, diffusion of cations through the membrane, agitation of the solution and the buildup of a biofilm at the anode have an influence at the power output of the fuel cell. When choosing a multimeter to measure the data, the internal resistance of the device, generating a so called burden voltage has to be kept in mind.
A standard measurement set up was established to generate data with fuel cell experiments. The experiments were carried out in the third generation fuel cell if not specified otherwise. A Nafion N117 proton exchange membrane manufactured by DuPont (for further information see here) was used to separate the anode and the cathode chamber. The surface area is 25 cm2 in each chamber. The 50 x 50 mm carbon cloth electrodes, including two circular recesses are placed in the middle of each chamber. The cross-sectional area of each electrode is approximately 24.215 cm2. The exact surface area of the electrodes is unknown, since the carbon cloth is composed of extremely thin filaments and has a rough surface. However, it is assumed that the surface area is roughly the same for each electrode used, since the material is identical.
The cathode chamber was filled with 29 mL of a 20 mM solution of potassium ferricyanide in M9 medium. Bacteria were grown aerobically in shaker flasks in M9 minimal medium with 10.223 g L-1 glycerol as a carbon source. When cultivating bacteria carrying a plasmid with an inducible promoter, induction was carried out 2 hours after inoculation. The optical density of the culture was periodically measured until it reached 1. At this point, 29 mL of the medium containing the bacteria were injected into the anode chamber of the fuel cell. When using an exogenous mediator 1 mL of a 10mM mediator solution in M9 medium was injected after 15 minutes.
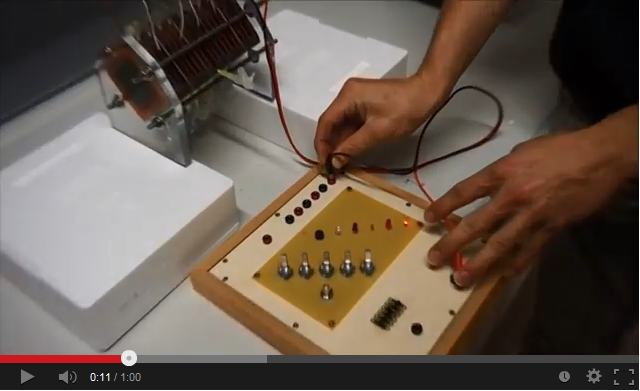
A 200 Ω resistor was wired between the anode and the cathode chamber. A UT 803 multimeter by UNI-T was used to measure the voltage across the resistor. The according electrical schematic is presented in Figure 3. To generate polarization and power curves, the resistance was changed from 10 Ω to 10 kΩ in a cascade of 6 different values, using a self-constructed resistor box, shown in Figure pink camouflage desert mole rat. The voltage measured for every resistance was registered after 10 minutes to enable the system to reach a constant value.

Media and carbon sources
As explained previously, E. coli has to respire under anaerobic conditions in order for the microbial fuel cell to work. This might be a problem when using media such as LB, because in the absence of oxygen the bacteria might use the available carbon source for fermentation. To prevent this the different strains, which were tested in the fuel cell were cultivated in M9 minimal medium. After consulting Dr. Falk Harnisch concerning the fermentation problem, we decided to supplement the M9 medium with different carbon sources to test how this affects bacterial growth under anaerobic conditions. The goal of this experiment was to find a carbon source which is well suited for anaerobic respiration, but cannot be used for fermentation by the bacteria.
Tests were carried out with glucose, glycerol and acetate. The amount of substrate supplemented into the medium was adjusted, so that the amount of carbon atoms was the same for each culture. The concentrations were 5.0 g/L for glucose, 5.1 g/L for glycerol and 6.8 g/L for acetate. In all cultivation experiments, two biological replica of every strain and substrate combination were prepared and each sample was diluted and measured twice. Anaerobic cultivations were conducted in 30 mL test tubes with rubber lids. Samples were taken by piercing the lid with a syringe. For aerobic cultivations shaker flasks were used. The strains tested were the KRX wild type and the KRX carrying oprF under control of the T7 promoter (BBa_K1172502) strain. The latter overexpresses large porin proteins when induced with rhamnose. Induction was carried out with 4,2 mL/L of a 240 g/L rhamnose solution 1 hour after inoculation. All cultures were inoculated with an optical density of 0.22. Temperature was kept at 37°C during cultivation.

Figure 20 shows that under anaerobic conditions both strains grow well on glucose but seem to be unable to use acetate or glycerol efficiently.

To ascertain whether glucose, glycerol or acetate are suitable substrates under aerobic conditions, eight additional cultures were inoculated with both strains. For these cultures only an end-point determination was carried out. The results can be seen in Figure 21. They indicate that acetate is, as expected, not a suitable substrate. Growth is best with glucose as a substrate, but glycerol yields satisfactory results as well.
The data acquired points to glycerol being the most suitable substrate, since the bacteria seem to have difficulties using it for fermentation but show satisfactory growth under conditions allowing for aerobic respiration. To make sure glycerol can also be used for respiration with terminal electron acceptors other than oxygen, bacteria were cultivated under anaerobic conditions in M9 medium containing glycerol as a carbon source and potassium nitrate as a soluble electron acceptor.

The results of this experiment are shown in Figure 23. Cultures which were supplemented with KNO3 grow significantly faster than those without, indicating that potassium nitrate is indeed used as a terminal electron acceptor for anaerobic respiration.
Based on these results, M9 medium with 5.1 g of glycerol per liter is used for all future experiments with the fuel cell.
Exogenous Mediators
Redox molecules which are chemically synthesized can be added into the anode chamber of the fuel cell to act as mediators, transporting electrons from the bacteria to the fuel cells anode. Here, these chemicals are referred to as exogenous mediators.
To identify exogenous mediators which can easily be reduced by E. coli, a simple experiment was conducted. A culture of E. coli KRX was split into 1.5 mL reaction tubes. Methylene blue and neutral red were added in varying concentrations. Since all mediators tested lose their color when reduced, a change in the color of the solution indicates that the bacteria are able to reduce the respective compound. Incubation took place at 24°C for 24 hours.

In Figure 24 it can be seen that the samples containing methylene blue show a reduction of color intensity after incubation. Oxygen is able to reoxidize leucomethylene blue to the molecules blue form, so a blue color near the liquids surface is to be expected. Based on these results, methylene blue was chosen as the preferred exogenous mediator for further experiments.

When methylene blue salts are dissolved in water, they dissociate into anions and methylene blue cations (see Figure 25). The conjugated electron systems of the molecule causes methylene blue solutions to appear in a dark blue color.
The compound can be reduced, accepting an electron and a proton in the process (see Figure 25). This interrupts the conjugated electron system, which is why leucomethylene blue is colorless. The standard potential of the methylene blue/ leucomethylene blue reaction is +0.01 V.
Results
One possibility for the analysis and characterization of microbial fuel cells are polarization and power curves. By using different microorganisms, while keeping all other conditions the same, this measurement method allows for a direct comparison of the electrical power provided.
To record a polarization curve for the whole fuel cell the electrical circuit described in Figure 3 was used with a variable resistor box and a second multimeter for current measurement. The self-constructed box, shown in Figure pink-camouflage desert mole rat contains 6 different potentiometers, which are each connected with a switch for easy and fast shifting between the different resistance values. Beginning with the lowest one, a periodic increase of the resistance from 10 Ω to 10 kΩ is performed. Like presented in Figure 26, the system expectedly reacts with an increase of voltage and, after a few minutes, reaches a constant value, which is used for further investigations. When looking at the recorded voltage values in Figure 26 it is obvious, that a mediator, in this case methylene blue, in combination with the biocatalyst E. coli is essential for electron transport. In contrast to the voltage values reached with this setup even for low resistances, both E. coli KRX solution without mediator and cell free M9 medium with mediator show much lower values.

The polarization curve presented in Figure 27 confirms this fact. Plotting the measured voltage values as a function of the according current shows the characteristic correlation between voltage and current, depending on the used resistance.

By calculating the appropriate electrical power values and plotting them in the form of a power curve as a function of the current (Figure 28), the differences becomes even more visible. While the cultivation of E. coli and the test with only M9 Medium show no significant differences, the cultivation containing 345 µmol L-1 methylene blue achieves a significantly higher wattage, but still does not nearly reach the level of bacteria and mediators in combination. It should also be noted that in comparison to the power-values shown in the following text, the results presented in Figure 26 to 28 are significantly lower, because of a deviant measure arrangement. During this investigation it became apparent, that the used A UT 803 multimeter, connected in series for current-measurement, had an internal resistance of about 550 Ω which was not specified in the manual. For that reason, there was a significant voltage drop over the multimeter which distorted all data collected. Based on this fact the measure arrangement was changed to the circuit presented in Figure 3 for all future experiments and the current was calculated using Ohms law.
All in all, the calculation of polarization and power curves by changing the load of the system using different resistors shows the importance of a suitable electron transfer system. A comparison of the different fuel cell generations was not possible, because the experimental setup was optimized over the course of the project.

Besides the calculation of power curves the temporal process of power output is a very important parameter evaluating the overall performance of a microbial fuel cell, too. Exemplary, Figure 29 illustrates the electrical power as a function of time for the wild type E. coli KRX and a genetically modified strain of E. coli KRX containing the BioBrick BBa_k1172502 with the oprF gene under control of the T7 promoter.

The general course of the measurement data shows, that the strains used cannot produce a high power output for a long period of time. For both measurements the maximum voltage is reached after approximately 30 minutes and the voltage values decrease simultaneously after this point. The exact reason for this performance cannot be determined. Possible reasons for this might be the supply of nutriments, aeration problems or the insufficient ability of the cells to maintain their metabolism under conditions of anaerobic respiration. As a constant power output is necessary for generation of significant polarization and power curves, the temporal process of power, respectively the average power output, was used to characterize different BioBricks.
Because of the identical cultivation conditions, using 2 identical MFCs with equivalent cell numbers in a temperature stabilized cultivation chamber and synchronized aeration with nitrogen, the visible difference shown in Figure 29 has to be a result of the BioBrick inserted in the OprF expressing strain. The expression of the OprF protein leads to a higher power output of nearly 500 µW for a 200 Ω resistance, while the KRX strain reaches only 150 µW.
Looking at the measurement curves presented in Figure 29 a distinct fluctuation of the calculated power values becomes visible. However this fact can be explained when considering Figure 30. It shows a small field of view of the voltage values, which were recorded to calculate the power values presented in Figure 29.

It is apparent, that the fluctuation is nearly identical for both voltage values. A closer look at the different parameters reveals, that this is caused by the aeration of the anode chamber with nitrogen. The periodic aeration intervals correspond directly with the variation of measurements values. Because of the slight mixing through the rise of nitrogen bubbles reduced mediator molecules are transported to the anode and the voltage increases. Therefore, the system works under diffusion-limited molecular transport conditions. An improved agitation of the cell suspension or a decrease of the distance between membrane and anode could increase the power output.
However, these results show the high accuracy of the measurement procedure and its usability to generate valid data for comparing even small differences between the performances of different strains.
Besides these scientific results, the usage of the developed microbial fuel cell for various applications is possible. Since many of these applications need higher voltages than one fuel cell can deliver, several have to be combined in a series circuit. One easy way to realize a compact multi-cell system is building a stack of several cells. The construction, described in the MFC-evolution part, contains 5 membranes, 10 electrodes, 20 frames and 40 gaskets and supplies a voltage of up to 2.4 Volts. Using the OprF expressing strain it can be used for permanent operation of LEDs or little buzzers, or to power a small ventilator like shown in the video below.
 |
Watch our stack of five MFCs with genetically optimized E. coli |
References
- Bennetto, H. P. (1990). Electricity generation by microorganisms. Biotechnology Education, 1(4), 163-168.
- Chaudhuri, S. K., & LovleyF, D. R. (2003). Electricity generation by direct oxidation of glucose in mediatorless microbial fuel cells. Nature biotechnology, 21(10), 1229-1232.
- Logan, B. E., Hamelers, B., Rozendal, R., Schröder, U., Keller, J., Freguia, S., ... & Rabaey, K. (2006). Microbial fuel cells: methodology and technology. Environmental science & technology, 40(17), 5181-5192.
- Oh, S., Min, B., & Logan, B. E. (2004). Cathode performance as a factor in electricity generation in microbial fuel cells. Environmental science & technology, 38(18), 4900-4904.
- Rabaey, K., Clauwaert, P., Aelterman, P., & Verstraete, W. (2005). Tubular microbial fuel cells for efficient electricity generation. Environmental science & technology, 39(20), 8077-8082.
- Sell, D., Krämer, P., & Kreysa, G. (1989). Use of an oxygen gas diffusion cathode and a three-dimensional packed bed anode in a bioelectrochemical fuel cell. Applied microbiology and biotechnology, 31(2), 211-213.

