 "
"
Team:Uppsala/results
From 2013.igem.org


Results and achievement
Achievements

Results
P-coumaric acid
We managed to clone out and biobrick tyrosine ammonia lyase and verify the biobrick by sequencing. Also we did succeful characterization on this part, showing that it works as expected. We managed to express our enzyme and detect it in a western blot, and also detect our metabolite in both spectrophotometry and hplc. The biobrick was characterized in e-coli d5halpha and e-coli nissle. For detailed information about the characterisation methods, see the protocol section.

2. TAL with Cp8 promotor
3. TAL with J23110 promotor
4. Negative control
Figure 1:SDS-page and western blot. Expression of Tyrosine ammonia lyase with constitutive promotors. The negative control is empty, showing that there is no natural protein in e-coli with the same attributes.
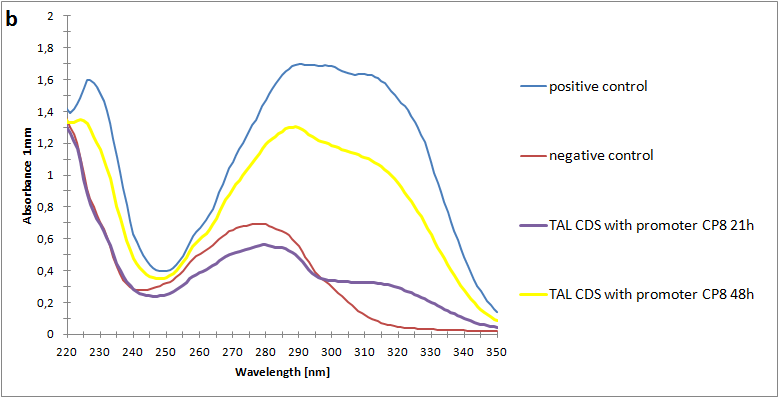
Figure 2:Absorbance spectra of extracts collected from bacterial cultures of strain pSB3K3-CP8-TAL. Samples were collected 21 h and 48 h after 30 °C incubation. Negative control is an extract from a strain with no TAL gene on the transformed plasmid. The positive control is an extract on a culture of the same strain as the negative control but with added p-coumaric acid to a concentration of 500 µM before extraction.
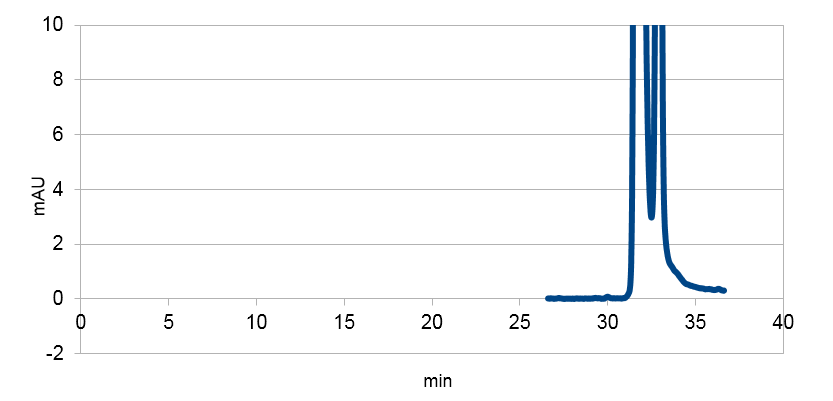
 | Figure 3. Graph showing the HPLC result of a sample prepared from e coli expressing tyrosine ammonia lyase. Reverse phase HPLC with a C18 matrix was used. The peak for p-coumaric acid can be seen ~9 min, as shown by the standard sample below. |
 | Figure 4. Graph showing the HPLC result of a sample standard with p-coumaric acid |
| Figure 5. E-coli culture injected to the hplc without our biobrick tyrosine ammonia lyase. Here we can see that there is originally no peak at 9 minutes. |
Read more about P-coumaric acid
Resveratrol
Although we managed to clone out and sequence verify the genes for resveratrol production, we have had some problems in the characterization. The results are unclear, and we did not have time for further investigations.For detailed information about the characterisation methods, see the protocol section

Positive control -> 1, Stilbene synthase -> 2
4Cl-STS translational fusion expressed in e-coli

Resveratrol standard

Resveratrol standard scaled
Lysed bacterial culture without plasmid of assembly
Shuttle vector
Promoters
Stephanie LÄGG DIN TEXT HÄR!!

Competition test
We grew our nissle containing the TAL biobrick together with wild type nissle (mixed 1:1) in antiobiotic free LB medium. The culture was maintaned by a thousandfold dilution in new medium every day, and letting it grow again overnight. To be able to track the fraction of each population over time, a dilution of the culture was plated on both selective, and non selective plates. The amount of colonies on the non selective plates gives us the total amount of cells, while the amount of colonies on the selective plates gives us the number of cells carrying the biobrick plasmid. The fraction of cells carrying the plasmid declined rapidly, and already after 5 days (approximately 50 generations of growth), we saw no trace of our e-coli nissle with TAL on the selective plates, while the wild type still grew on the non selective plates. This clearly shows that our genetically engineered probiotic have a hard time competing against the wild type, and if released into the environment, they would most likely be outcompeted by other bacteria within days.
Read more about the comptetition test