 "
"
Team:Uppsala/P-Coumaric-acid-pathway
From 2013.igem.org


Kinetic modeling of p-coumaric acid pathway
Why use modeling?
In the beginning of the project a lot of questions arose on which BioBricks and standardized parts to use in our assemblies. What promotor should we use? High or low copy plasmid? We wanted to pick parts that we knew would give a high production of our nutrients like p-coumaric acid and resveratrol and we wanted the model organism to achieve this production in a short period of time. To sum it up: we wanted our probiotic bacteria to produce sufficient amounts of our healthy antioxidants! But how could we achieve this?To answer all the questions we decided to turn to mathematical modeling! In this way we could predict in silico that our model organism would produce sufficient amounts of the metabolite of interest with the BioBricks we chose to work with.
Setting up the model
We chose to work with a deterministic model of ordinary differential equations that takes the basic concepts of molecular biology into consideration. The first part of the model is describing the gene expression within the model organism; transcription and translation to give an enzyme product from the DNA construct. Enzyme catalysis of the given substrate to the wanted metabolite product is then described as well as transport of substrate and product across the plasma membrane. The schematics of the model for production of p-coumaric acid can be seen in Figure 1 and the kinetic rates of the different reactions involved in the model are explained in Table 1.
Figure 1. Schematic figure of the components involved in the production of p-coumaric acid. The reactions considered in the kinetic ODE model are marked as as arrows. (1) Transcription of mRNA from DNA template. (2) Breakdown of mRNA due to natural decay and dilution due to cell growth (3) Translation of mRNA to the enzyme product TAL. (4) Breakdown of TAL due to natural decay and dilution due to cell growth. (5) Transport of tyrosine across the plasma membrane by the Aromatic amino acid transport protein (AroP) (6) TAL catalyzed conversion from tyrosine to p-coumaric acid. (7) Instant diffusion of p-coumaric acid through the plasma membrane. The rates of different reactions are explained in Table 1.
Table 1. The reaction rates in the model of p-coumaric acid production.

In a mathematical context, the model is a system of first order ordinary differential equations (ODE:s). The ODE:s for the production of p-coumaric acid are described in Figure 2. Solving this system of ODE:s enables determination of metabolite concentration in the cell medium as a function of time.

Figure 2. ODE model of the production of p-coumaric acid. The model considers E. coli cells growing in stationary phase, thus the cell/DNA concentration is considered to be constant. The compartment of the referred concentration is denoted in bottom right corner of the variable sign (cell, outside or tot, where cell+outside=tot). If no compartment is denoted it is the cell concentration that is referred to. The rates involved for each component are further explained in Table 1.
Determination of model parameters and initial values
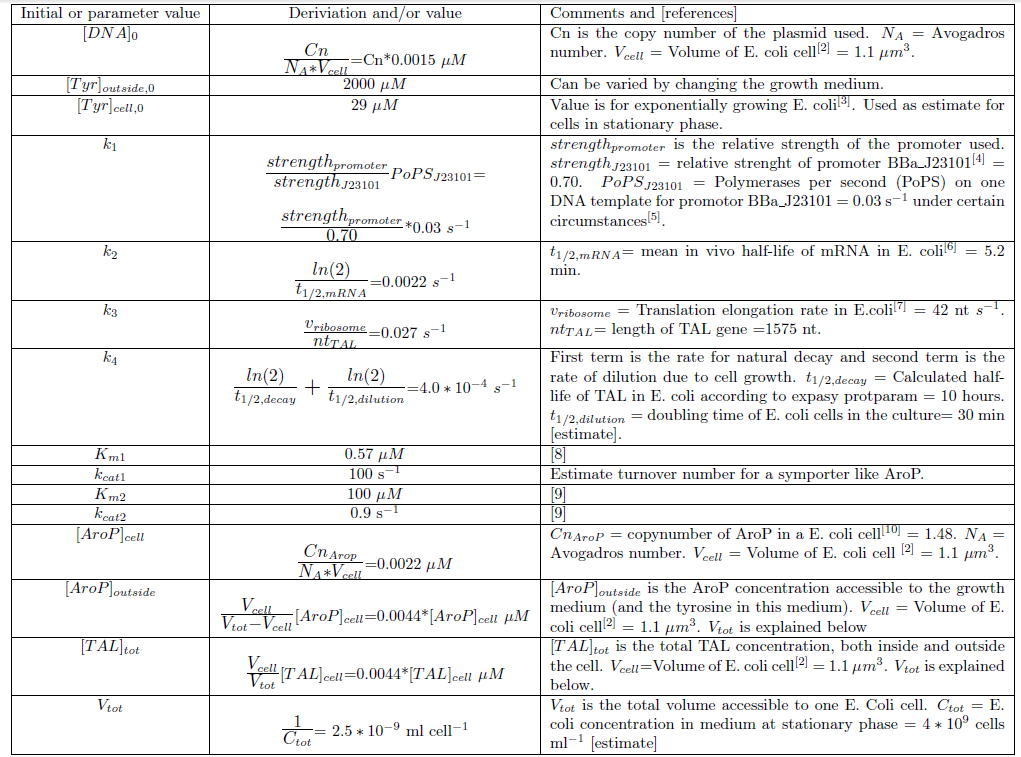
Since we planned to do initial assembly and characterization of our BioBricks in E. coli the model for metabolite production was set up up for this chassi. Since E. coli is such a extensively studied model organism all parameters needed in the ODE model could be determined or estimated from data found in literature. The values of the model parameters and explanations how they were determined can be found in Table 2. The only free parameters in the model after implementing the values in Table 2 is the copy number of the plasmid and the strength of the promoter.Table 2. Numerical values of parameters and initial values of the ODE model.Initial values are denoted with a 0 in the bottom right corner. All initial values not noted in this table are considered to be 0. Note that the relative promoter strength of J23101 in this Table (0.70) is NOT reported in RPUs. The strength reported is relative to J23100. Since it is the ratio (strengthpromoter/strenghtJ23101) that is used in the calculations it does not matter what standard/unit that is used in this ratio as long as the numerator and denominator has the same unit.
Implementation of the ODE model in MATLAB scripts
The ODE model was implemented in a number of MATLAB scripts. The system of ODE:s were solved using built in ODE solvers in MATLAB (ode45 and ode15s). For code simplicity, the entire system was solved in this numerical way even though the first part of the ODE model is linear and could be solved analytically.These MATLAB scripts were then used to simulate and estimate the p-coumaric acid concentration in the growth medium as a function of time. This was done for a number of values on the two free parameters of the model (copy number and promoter strength) to see how these two effect the p-coumaric acid concentration.
Results of simulations
Simulation were done with the ODE model to see if a satisfying concentration of p-coumaric acid could be achieved after 48 hours of stationary phase incubation. With a plasmid copy number of 25 (pSB3K3) and a promoter strength of 0.70 (BBa_J23101) the p-coumaric acid concentration increased at an approximately constant rate to 169.9 µM after 48 hours. A plot of this simulation can be seen in Figure 3.
Figure 3. Simulation of p-coumaric acid production. Copy number = 25, promoter strength = 0.70. Upper plot shows concentrations of plasmid DNA, mRNA transcript, and TAL as a function of time. Lower plot shows tyrosine concentrations (inside and outside the cell) and total p-coumaric acid concentration in the medium as a function of time. A simulation over 48 hours gives a p-coumaric acid concentration of 169.9 µM.
To see how copy number and promoter strength affected the behaviour of the model further simulations were done with different values on these two free parameters. Simulated values of p-coumaric acid concentration after 48 hours of stationary phase incubation for different values on the copy number and promoter strength can be seen in Table 3. Copy number of pSB3K3 and promoter strength of BBA_J23101 are used as reference values.
Table 3. Final p-coumaric acid concentration for different values on copy number and promoter strength. Note that the relative promoter strength of J23101 in this Table (0.70) is NOT reported in RPUs. The strength reported is relative to J23100. Since it is the ratio (strengthpromoter/strenghtJ23101) that is used in the calculations it does not matter what standard/unit that is used in this ratio as long as the numerator and denominator has the same unit.

The simulations show that the rate of p-coumaric acid production is almost independent of copy number and promoter strength when these parameters have biologically relevant values (of course one could lower the parameter values even further but then it would not represent represent an E. coli that you can construct in real life). The behaviour of the model suggests that it is the transport of tyrosine into the cell that is the rate limiting step in the p-coumaric acid production (tyrosine concentration inside the cell drops fast and limits the rate of later steps). An explanation to this is the very low copy number of the transport protein AroP (1.48 proteins per cell!). However, even for rather low values on copy number and promoter strength, the rate of production of p-coumaric acid is sufficient to a give a concentration in the 0.1 mM scale after 48 hours. This rather high concentration should be (and later proved would be ) detectable by spectrophotometry or HPLC.
This simulated concentration of 169.9 µM is also quite high in comparison to concentrations found in nature. For example, italian red wine have been found to have a p-coumaric acid concentration ranging from approximately 6 to 120 µM (1-20 mg/l) [11]. This should be considered as a very good sign. If our yoghurt product could “beat” red wine (which is known to have a high content of phenolic acids) in p-coumaric acid content we should consider it a great success!
Conclusions
The MATLAB simulations made us confident that the use of very strong promoters and especially high copy plasmids wouldn’t be necessary when building p-coumaric acid producing bacteria. The TAL gene was later assembled with different promoters with equivalent or lower strength compared to BBa_J23101 (along with some lactobacillus promoters with unknown strength in E. coli). Characterization was later done in the medium copy plasmid pSB3K3. The simulations had shown us that we didn’t have to stress the cell with a high copy plasmid, so of course we didn’t!Comparison with experimental data
Later, after assembling our BioBricks for p-coumaric acid production, characterization of the parts were done through spectrophotometric experiments. The absorbance data from these experiments gave us the opportunity to check how well the ODE model had simulated the p-coumaric acid production. The absorbance spectra of extracts from bacterial cultures grown at stationary phase for 48 hours were collected and the concentration of p-coumaric acid was calculated from the absorbance spectra in an ordinary least squares manner with a MATLAB script. The concentration of p-coumaric acid in the culture with pSB3K3-J23101-TAL was 228 µM and the concentration in the culture with pSB3K3-J23110-TAL was 158 µM.The measured p-coumaric acid concentrations shows that the ODE model predicted the concentration relatively well. The predicted 170 µM compared to 228 µM and 158 µM has to be considered very close when taking the simplicity of the model into consideration. However, the model did not predict a measurable difference in concentration when changing the promoter strength. BBa_J23101 is approximately twice as strong as BBa_J23110 ( 0.70 compared to 0.33 [4]) which gives a clear measurable difference in p-coumaric acid concentration. This suggests that the low copy number of AroP isn’t as dominating and rate limiting as the model suggests.
Even though the mathematical ODE model didn’t capture the full dynamics of the bacterial p-coumaric acid production it did a very good job by helping us setting up our assembly plans. It helped us rule out the “deadly” high copy plasmids when doing characterization experiments and correctly predicted a p-coumaric acid concentration in the 0.1 mM scale.
MATLAB scripts
AbsorbancetoConc_uppsala.mThis script demonstrates an intuitive and visualizing algorithm for determining metabolite concentration from absorbance data. Generally, concentration is determined from absorbance by linear regression from absorbance data at one wavelength. Our algorithm uses a whole spectrum of absorbance data to calculate the concentration value, giving a more accurate value of the concentration. An optimal concentration is calculated so that the calculated absorbance spectrum is fitted to the measured data using ordinary least squares.
PcoumProdSim_uppsala.m
Script that simulates the p-coumaric acid production using the ODE model. ODE:s are defined in PcoumRates_uppsala.m (both files have to be downloaded).
PcoumRates_uppsala.m
The ODE:s used by PcoumProdSim_uppsala.m.
References
[1]. Campos FM, Couto JA, Figueiredo AR, Tóth IV, Rangel AOSS, Hogg TA. Cell membrane damage induced by phenolic acids on wine lactic acid bacteria. Int. J. Food Microbiol. 2009 Oct 31;135(2):144–51.[2]. Kubitschek HE, Friske JA. Determination of bacterial cell volume with the Coulter Counter. J. Bacteriol. 1986 Dec;168(3):1466–7.
[3].Bennett BD, Kimball EH, Gao M, Osterhout R, Van Dien SJ, Rabinowitz JD. Absolute metabolite concentrations and implied enzyme active site occupancy in Escherichia coli. Nat. Chem. Biol. 2009 Aug;5(8):593–9.
[4]. Promoters/Catalog/Anderson. Available from: http://parts.igem.org/Promoters/Catalog/Anderson
[5]. Kelly JR, Rubin AJ, Davis JH, Ajo-Franklin CM, Cumbers J, Czar MJ, et al. Measuring the activity of BioBrick promoters using an in vivo reference standard. Journal of Biological Engineering. 2009 Mar 20;3(1):4.
[6]. Bernstein JA, Khodursky AB, Lin P-H, Lin-Chao S, Cohen SN. Global analysis of mRNA decay and abundance in Escherichia coli at single-gene resolution using two-color fluorescent DNA microarrays. Proc. Natl. Acad. Sci. U.S.A. 2002 Jul 23;99(15):9697–702.
[7].Proshkin S, Rahmouni AR, Mironov A, Nudler E. Cooperation between translating ribosomes and RNA polymerase in transcription elongation. Science. 2010 Apr 23;328(5977):504–8.
[8]. Brown KD. Formation of Aromatic Amino Acid Pools in Escherichia coli K-12. J. Bacteriol. 1970 Oct 1;104(1):177–88.
[9]. Bartsch S, Bornscheuer UT. A single residue influences the reaction mechanism of ammonia lyases and mutases. Angew. Chem. Int. Ed. Engl. 2009;48(18):3362–5.
[10]. Masuda T, Saito N, Tomita M, Ishihama Y. Unbiased quantitation of Escherichia coli membrane proteome using phase transfer surfactants. Mol. Cell Proteomics. 2009 Dec;8(12):2770–7.
[11]. Gambelli L, Santaroni G. Polyphenols content in some Italian red wines of different geographical origins. Journal of Food Composition and Analysis. 2004 Oct;17(5):613–8.