 "
"
Team:Calgary/Notebook/Journal/Reporter
From 2013.igem.org
Reporter Journal

Reporter Journal
Week 1: May 1 - May 3
This week we attended the appropriate safety courses required by our University to work in the lab. Besides that, the undergraduate supervisors presented about the principles of Genetics and Synthetic Biology to the new team members.
Week 2: May 6 - May 10
This week we participated in a general molecular biology workshop to refresh our memory of techniques used in molecular biology.
Week 3: May 13 - May 17
We continued the molecular biology workshop. This week we also divided up into our respective groups for the project and decided research priorities.
Week 4: May 20 - May 24
We examined three problems related to ferritin. Firstly, we investigated protein isolation of ferritin. We are considering the protocols created by Santambrogio et al. (1993), as they have been used by multiple other authors as well. This paper uses precipitation followed by column chromatography, and verification with spectroscopy, PAGE and SDS-PAGE (Levi et al., 1994). Alternatively, we may consider using His-tags for Ni-NTA column purification.
Secondly, we examined the feasibility of using magnetism to manipulate ferritin. Commercial horse spleen ferritin was tested on a magnetic Dynabead rack, and as expected, it did not move, as the core should not be magnetic. We must thus synthesize magnetoferritin wherein the native ferrihydrite core is converted to magnetite--a paramagnetic material which can be attracted to magnetic fields (Jordan et al., 2010 & Wong et al., 1998). We were able to attain some general knowledge of magnetism in nano-scale material, including a basic understanding of blocking temperatures, superparamagnetism and magnetic moments, all magnetism-related measurements. But we are ill-equipped to model this system theoretically in terms of calculated forces. We also explored the possibility of alternative magnetic particles, just in case ferritin is too small to exhibit magnetic forces significant enough to move proteins.
Magnetosomes were found to be much larger, but inviable due to the complexity of their creation. The cowpea chlorotic mottle virus (CCMV) may also be an option, although there is currently little known about it and therefore further research into this topic is required. (Lohsse et al. 2011).
Because we also intend to scaffold transcription activator like effector (TALE) DNA-binding proteins to ferritin, we looked into fusions to both C- and N-terminals of ferritin. The N- and C- termini of ferritin subunits are present on the outside and inside of the nanoparticle respectively, and therefore N-terminal fusions are an obvious choice to ensure TALEs are present on the exterior of the nanoparticles (Dörner et al., 1985).
Week 5: May 27 - May 31
While we are unsure of exactly how ferritin will be used in our project, any capacity in which we use it requires isolating recombinant ferritin from E. coli. We investigated which terminus to locate purification tags (eg, His tags) on ferritin subunits. Ingrassia et al. (2006) found that small amino acid additions to the C-terminus of either heavy or light chain ferritin are not deleterious to its function. Thus, we are contemplating fusing proteins to the N-terminal of ferritin as discussed last week, and using the C-terminus for tags to isolate recombinant subunits.
We also contemplated methods for controlling expression in terms of proportions of H and L subunits in completed ferritin. This could influence iron dynamics of completed ferritin. Lee et al. (2002) overcame this issue by fusing the heavy and light chains together to ensure that completed nanoparticles have a 1:1 ratio of each subunit. We are trying to determine pitfalls of this expression strategy. Finally, we investigated methods for validating nanoparticle formation. Namely, we considered fluorescence spectroscopy as tested by Parker et al. (2008), where 410nm output was indicative of iron incorporation as per assembled ferritins.
Apart from using magnetism to manipulate magnetoferritin to isolate pathogenic DNA, we developed a backup approach. Watt et al. (2012) constructed a nanoscale battery where ferritins with two different cores were oxidized and reduced on gold electrodes. We are contemplating using a split TALE capture system to bring ferritin into close association of an electrode. Current could then flow from ferritin into an electrode to indicate binding of pathogenic DNA.
Finally, we considered how we might construct a magnetic device to isolate ferritin. Bushart et al. (2006) discussed methodology for isolating metal chelating magnetoferritin for metal purification. However, the necessary magnetic field strengths, mesh density, or mass of isolated compounds in these systems were not explicit. Thus, we are still uncertain about the feasibility of using magnetism to isolate proteins attached to magnetoferritin.
Week 6: June 3 - June 7
The application of ferritin in our project has changed substantially. Due to uncertainties of using magnetism to isolate proteins attached to ferritin, our team proposes instead to use it as a nanoscale protein scaffold. Our team was inspired by the work of He et al. (2011) who used gold nanoparticles bound to ssDNA to detect DNA in a lateral flow strip assay.
We have decided to modify the aforementioned system. We’ll replace gold nano particles with ferritin and ssDNA with TALEs targeted to pathogenic E. coli markers. These nanoparticles will bind pathogenic DNA via TALEs, be drawn up through a strip via capillary action, and become immobilized with complementary TALEs affixed to other regions on the strip. A reporter marker will also be fused to the recombinant ferritins to allow visualization of the pathogenic DNA.
This system is unique since double stranded sample DNA could be detected without having to first melt the DNA. Cheap prototypes for such a system could be constructed and would be suitable for cost constraints in the beef industry. Moreover, this system is amenable to scale-up for the identification of multiple pathogenic markers on a single lateral flow strip. We are, however, unsure as to what to use as a reporter enzyme.
We also met with two U of C professors in nanoscience to discuss the feasibility of our magnetism idea. Dr. Max Anikovskiy, an instructor from the nanoscience program, allowed us to use a 50 lb. pull force rare earth magnet to manipulate native horse spleen ferritin. However, there were no changes over a three hour period. We also spoke to Dr. Simon Trudel from the nanomagnetism research group. He seemed to think our idea was feasible, but might require optimizing with respect to the solvent system in which the particles are dissolved. From both these meetings, it emerged that modelling the fluid dynamics is beyond our capabilities. Our best bet is to test these ideas experimentally, one step at a time, by first synthesizing and testing magnetoferritin.
Week 7: June 10 - June 14
We visited the Cargill Meat Solutions plant and discovered that our system would be most applicable in identifying cattle who are super shedders, which would require our system to be quantitative. One possible approach utilizes a fusion of TALE and a reporter protein, although this system may subtract from quantification due to binding of multiple DNA strands to the nanoparticle. An alternative approach utilizes a ferritin-TALE to immobilize target DNA, which can then be visualized through a second TALE fused to a reporter enzyme.
One question we currently have is the construction of the ferritin genes. Lee et al. (2002), and Huh and Kim (2003) have successfully created heavy-light chain ferritin subunit fusions, allowing better control of the subunit ratios. Therefore we intend to use a similar approach as it would halve the number of subunits involved, and in turn halve the number of bound TALEs, reducing our concerns about steric hindrance. E coils will be bound to the N-terminus due to its presence on the outside of the nanoparticle, ensuring exposure to the environment (Luzzago and Cesareni 1989).
Upon further investigation, we found that the creation of Prussian Blue ferritin nanoparticles involve the use of potassium ferrocyanide, a compound that has the potential to evolve hydrogen cyanide. These fears were abated upon contacting members in the nanoscience department, stating the conditions and concentrations involved in our experiment were too low to be of concern.
Week 8: June 17 - June 21
An issue we addressed this week was the assembly of gene constructs to test ferritin in our system. A tentative strategy plan has been proposed. Coordinating this plan with the TALE and linker teams is necessary to ensure compatibility among the many components of this project. Upon receiving commercially-synthesized genes, we will order primers to use the Golden Gate assembly method.
To test whether the synthesis of magnetoferritin is successful, we must first synthesize it using the method proposed in week 4, where the native ferrihydrite core is converted to apoferritin then magnetite. Using a magnet with a relatively strong pull force (about 50 lbs.), we hope to see the magnetoferritin respond in solution.
We must also confirm the applicability of using ferritin as the Prussian blue reporter system. After generating ferritin with a Prussian blue ferrihydrite core, we will manipulate the core type, pH, coloured substrate, and temperature to test the feasibility of this method. If these tests are futile, we may need to develop an enzymatic reporter that will function in parallel with our system. The necessary materials have been obtained for these experiments, and results will follow shortly.
Week 9: June 24 - June 28
In order to use β-lactamase as a potential reporter system it was necessary to use designed primers to PCR out the gene from the backbone of the pSB1A3 plasmid (it is present here as it conveys ampicillin resistance). Three primers were designed in order to retrieve the β-lactamase gene just by itself as well as having it with a His-tag in order to aid with protein purification. After the PCR was performed the resulting DNA was run on a gel to confirm the gene size (Figure 2). This PCR appeared to be successful based on size (900-bp and 927-bp for the β-lactamase and β-lactamase with His-tag respectively) but after sequencing it was determined one of the primers contained a design error resulting in a truncated gene. The primers will be redesigned in order to successfully achieve the extraction of the β-lactamase gene from the pSB1A3 plasmid.

Figure 2. PCR making use of custom primers to extract β-lactamase from the psB1A3 vector. 5 out of the 8 lanes for the β-lactamase extraction display bands at approximately 900-bp which is expected as the part should be 909-bp. All of the lanes for the extraction that includes the His-tag show bands that are a similar size compared to the normal β-lactamse extraction which is expected as the gene is 927-bp in size. Some unexpected amplification is seen for this PCR set. No contamination is observed in the NTCs (no template controls). The gel was 1% agarose and was run at 100 V for an hour.
Week 10: July 1 - July 5
Our team reviewed primer design for our Golden Gate Assembly with emphasis on ensuring proper ligation of our products. This involved matching melting temperatures, ensuring there were no palindromic sequences, and considering the other requirements. Primer design is integral to our overall project since we must successfully use Golden Gate Assembly to synthesize our parts. Much of our time has been spent towards this goal.
Week 11: July 8 - July 12
Both light and heavy ferritin chain gene sequences have arrived ( BBa_K1189019 , BBa_K1189020 ). We have transformed and miniprepped them and they are now ready as a template for the Golden Gate primers.
Also received this week were the redesigned primers for extracting β-lactamase from the pSB1A3 plasmid. These primers were used in three combinations to produce the β-lactamase gene by itself, the β-lactamase gene with a His-tag at the end and a β-lactamase gene with a flexible glycine linker (BBa_K157013) fused to the N-terminus of the protein. The gels of these PCRs indicated that the experiment was successful (Figures 3 and 4). These products were PCR purified in order to be used for future constructions.

Figure 3. PCR making use of custom primers to extract β-lactamase from the psB1A3 vector. Every lane for the β-lactamase extraction display bands at approximately 900-bp which is expected as the part should be 909-bp. All of the lanes for the extraction that includes the His-tag show bands at that are a similar size compared to the normal β-lactamase extraction which is expected as the gene is 927-bp in size. Some unexpected amplification is seen for this PCR set. No contamination is observed in the NTCs (no template controls). The gel was 1% agarose and was run at 100 V for an hour.

Figure 4. PCR making use of custom primers to extract β-lactamase from the psB1A3 vector. Expected band sizes were seen for all of the extractions at approximately 950-bp. Some unexpected amplification is seen for this PCR. No contamination is observed in the NTCs (no template controls). The gel was 1% agarose and was run at 100 V for an hour
A construction that was attempted this week consisted of placing the β-lactmase gene with a His-tag behind the promoter BBa_J04500 . Also attempted were plasmid switches of the three β-lactamase genes extracted via PCR. Colonies were seen for all of the transformed ligation mixtures for these constructions. Colony PCR of these transformed colonies only produced potentially viable results of J04500 + β-lactamase (with His-tag) construct.
Week 12: July 15 - July 19
The primers for golden gate assembly arrived this week and we conducted the PCRs required for our first attempt at the construct fusing the two ferritin subunits together ( BBa_K1189018 ). The final ligation product was run on a gel and appears promising, showing a 1500bp band, most likely representing our construct. Despite this, transformations have failed and therefore we have to look back at our primers and experimental design.
We now have a more set idea of how we are going to synthesize magnetoferritin. We will most likely be using a flask with a rubber stopper that will allow inflow and outflow of the nitrogen gas, which will be bubbled into the solution with an air stone. Nitrogen is free to exit a small port in the stopper and reagents can easily be added via injection through the rubber stopper. Safe handling of the thioglycollic acid is paramount, therefore equipment has been ordered, (elbow-length gloves, respirator, and aprons) and attempts at synthesis will be conducted as soon as we get the equipment.
The β-lactamase construction attempted last week proved to be unsuccessful, however, another construction from this week did produce a gene that appeared to be the J04500 + β-lactamase with a His-tag part. This construction was sent in for sequencing over the weekend.
Week 13: July 22 - July 26
The sequencing of the J04500 + β-lactamase with a His tag construction ( BBa_K1189007 ) from last week revealed that we had successfully completed this part. Mutagenesis primers were designed for this gene as a BsaI cut site is present in the sequence which could interfere with any Golden Gate assembly attempted with this part. Successful mutation of this part was completed and confirmed via gel electrophoresis and sequencing. A preliminary test was also attempted with this part in order to see if the leaky properties of the LacI ( BBa_J04500 ) promoter could successfully produce β-lactamase at levels large enough to allow the transformed cells to survive on plates containing ampicillin even though this part exists in a chloramphenicol resistant plasmid (pSB1C3). This test successfully displayed that active β-lactamase was being produced by our cells. Also produced this week was the plasmid switch of the β-lactamase gene with a His-tag at the C-terminus and the β-lactamase gene with a glycine linker at the N-terminus.
We setup the experimental apparatus we expect to use for the synthesis of apoferritin and magnetoferritin. The lack of equipment for real anoxic environments meant we had to Macgyver parts together to form a makeshift usable apparatus.
We also began the staining of ferritin with ferrocyanide, which will create a product that has the potential to act as a reporter, similar to horse radish peroxidase. Initially, we had concerns due to the production of hydrogen cyanide from one of our reagents, ferrocyanide. But this concern was relieved after talking to chemists that had experience with this compound, telling us our conditions were not harsh enough to evolve hydrogen cyanide. Production of prussian blue ferritin was simple and safe, producing a light blue solution.
We tried to use 280nm absorbance as a means to detect protein concentration of ferritin. The resulting absorbances are erratic and therefore this method was determined to be too unreliable to be feasible. Initial testing of the prussian blue ferritin was also done, by adding the reagents required for a colourimetric output, results look promising as we see the expected colour change (Figure 5).

Figure 5. Image of the colours of ABTS and TMB (10 mg/mL for both) after reacting with Prussian blue ferritin.
Week 14: July 29 - August 2
Realizing the time constraints we have for the submission of our parts, we reviewed our Golden Gate assembly experiment to ensure we can submit the parts to the registry. In case this method fails, we also began development of Gibson assembly primers to see if this assembly assembly method cooperates with us.
We began characterization of prussian blue ferritin through kinetics experiments. Our first goal was the construction of the Michaelis-Menten plot to determine the activity of our peroxidase-like catalyst with the 2,2'-azino-bis(3-ethylbenzthiazoline-6-sulphonic acid) (ABTS) substrate (Figure 6).
Figure 6. Measurements of the absorbance of the 415nm light by the substrate ABTS over a period of 600 seconds. 8 uL of 10 mg/mL substrate was used in a 242 uL reaction volume. Prussian blue ferritin ( 10 uL of 0.022 mg/mL sample) is represented by the blue data points. Orange data points are a negative control using standard ferritin (10 uL of 0.047 mg/mL sample). Negative controls are ABTS and hydrogen peroxide, and ABTS only. Standard error of the mean bars are based on a sample size where n=8.
These experiments then continued on to optimization experiments wherein we determined the optimal pH, temperature, and concentrations of ABTS and hydrogen peroxide. We intend to repeat these experiments with 3,3',5,5'-tetramethylbenzidine (TMB) so that we could compare the two substrates and determine the most viable one for our final system.
Week 15: August 5 - August 9
This week, we prepared the basic reagents for magnetoferritin synthesis, we attempted to create apoferritin this week. Apoferritin turned out to be a very light brown, suggesting that some of the iron cores were unloaded. We moved onto magnetoferritin synthesis, but the resulting product contained a lot of particles in it, we fear this may be due to synthesis of magnetite crystals in addition to magnetoferritin.
We did our tested heavy ferritin ( BBa_K1189019 ) as ordered from the synthesis company for expression on an SDS-PAGE. The LacI induced promoter ( BBa_J04500 ) was induced with 0.8mM IPTG for four hours at 0.6OD for the cultures. The protein was either not expressed or was too difficult to distinguish from the background proteins in the cell. Protein trials will be repeated once we assemble BBa_K1189018 in iGEM’s pSB1C3.
Also continued on with the ABTS kinetics experiments. We were able to create graphs showing the effectiveness of our catalyst under varying pH (Figure 6).

Figure 7. pH optimization of Prussian blue ferritin with ABTS. Data is presented as a relative activity based on the highest activity seen during the experiment. Absorbance readings were taken at 415 nm to detect the colourimetric change in a 242 uL solution. Standard error of the mean bars are based of a sample size where n=8.
Week 16: August 12 - August 16
Finished off the ABTS kinetics experiments for Prussian blue ferritin, which involved finding the optimal temperature for the reaction. But the spectrophotometer available to us is limited to 25-45C. This limitation is still within our expected prototype temperature and therefore it is not a big worry. We will then continue on with determining the kinetics for TMB and find out which substrate is better for our system.
Week 17: August 19 - August 23
Due to multiple failures of the plasmid switches of both ferritin and other parts, we conducted tests on multiple aspects of our procedures, including ligase, phosphatase and buffer. None of these parts were determined to be problematic, therefore we attempted higher DNA concentrations on controls, which worked. Therefore we will attempt the plasmid switch of the ferritin parts at some other time.
We also began initial tests with TMB, but realized our stock concentrations were at 1mg/mL. As these results would be incomparable to our ABTS experiments, which were at 10mg/mL, we remade the TMB stock solution to 10mg/mL and redid the experiments.
Week 18: August 26 - August 30
Our first attempts at observing one of our fusion proteins on SDS-PAGE were conducted, although the bands do not appear to contain the protein, which may be due to a large amount of background or low expression of our desired protein. We’ve read about a technique that can stain iron, which is essentially the same as the creation of Prussian Blue ferritin. Using this method we could exploit the iron core of ferritin by running a native PAGE and staining the iron core. This would then confirm the presence of our protein, therefore we ran initial tests of this method by running dilutions of the ordered ferritin solution in addition to other things. This method worked extremely well for staining ferritin controls, although the E. coli samples lack the bands, which is problematic as this indicates either there is no ferritin being produced, or this stain isn’t sensitive enough for the amount of ferritin produced.
On a happier note, our work with Gibson assembly has finally produced one of our constructs, the fusion of the heavy and light ferritin chains to an E coil ( BBa_K1189018 ). Because this method appears to be relatively successful, we intend to order more primers and use Gibson assembly for the construction of other parts as well.
Week 19: September 2 - September 6
We got more Gibson primers for the creation of the fusion proteins containing TALA and TALB connected to ferritin ( BBa_K1189021 ). The pieces were extracted with PCR and the Gibson reaction was attempted and subsequently transformed. All of the resulting colonies did not contain our desired part and this may be due to the presence of template vector originally used for the PCRs. Therefore we will attempt to treat the DNA with DPNI in order to chew up the original vector.
Week 20: September 9 - September 13
The western blots for β-lactamase and the TALE constructs ( BBa_K1189007 , BBa_K1189029 , BBa_K1189030 )appear to look good, despite the very faint bands seen on SDS-PAGE. Therefore it is possible ferritin is being expressed as well, but is too difficult to see due to background. We may attempt to try to clean up the sample through some crude purification techniques such as treating the sample at 75 degrees Celsius, exploiting the stability of ferritin. Alternatively, once we attach the His-tag to our main coil-ferritin construct, we can try to observe ferritin expression through western blots as well.
Week 21: September 16 - September 20
DNA submission time and a huge rush to plasmid switch everything in addition to participating in Beakerhead and aGEM.
Week 22: September 23 - September 27
This week we successfully converted our own recombinant ferritin (
Part:BBa_K1189018
and
Part:BBa_K1189021
) to have the Prussian blue surface modification. This is an important moment as it signals that we can now begin applying what we learned from characterizing commercial Prussian blue ferritin to the constructs that we built during the summer. We are excited to use the data we will gather from this protein to further develop our system. Our homemade Prussian blue ferritin was tested with the substrate TMB to confirm that our own Prussian blue ferritin has catalytic activity (Figure 7).
Figure 8. Measurements of the coloured substrate TMB (10 mg/mL) at 650 nm over a 600 second time period for our own Prussian blue ferritin and unmodified ferritin. Sample volume was 242 µL. Controls for this experiment include bovine serum albumin (1 mg/mL)and the substrate solution by itself. Due to limitations on the protein available only one replicate was performed. Zero time points do not have low absorbance as colour change was rapid and began before measurements started.
Also...Wiki Freeze!
Week 23: September 30 - October 4
Practice, practice, practice for our Regional Jamboree presentation!
Week 24: October 7 - October 11
In order to demonstrate that we can successfully capture target DNA with two TALEs we did a capture TALE assay. TALE B was incubated with DNA containing target sites for TALE A and TALE B and blotted on nitrocellulose. After blocking and washing, TALE A β-lactamase fusion (BBa_K1189031) was added to the nitrocellulose strips. The strips were transferred into a 96 well plate to which a benzylpenicillin substrate solution with phenol red was added. If the TALE A β-lactamase fusion bound to the target site for TALE A then the solution will change colour from pink to clear. If TALE A β-lactamase fusion was not present, the solution will remain pink. We can show that the first four samples which have TALE B with DNA for TALE A and TALE B show a colour change indicating that we are successfully capturing the target DNA and reporting it. Furthermore we can also show that when we add non-specific DNA we do not see a colour change demonstrating that we can successfully capture only specific DNA and report its presence with an easy visual colourimetric output.
Figure 9: TALE capture assay was done with TALE B ( ) BBa_K1189001 )and TALE A B-lac fusion ( BBa_K1189031 ) and DNA ( BBa_K1189006 ) with both target sequences. If capture is successful, the TALE A β-lactamase is present in the well giving a colour change from pink to yellow when subjected to benzylpenicillin substrate solution within 20 minutes. The only wells that change colour are the first four wells which contain TALE B, specific DNA, and TALE A β-lactamase fusion and our positive control wells which are the controls for our fusion TALE A β-lactamase protein and our positive recombinant β-lactamase. All our other controls including our test using a non-specific sequence of DNA remained pink . This preliminary characterization data demonstrates that the TALEs are able to bind to DNA with specificity. Additionally it also shows that our system of capturing DNA with two detector TALEs and then subsequent reporting of the DNA’s presence works.In order to alleviate concerns over the use efficacy of Phenol red as an indicator for the pH change created by the use of benzylpenicillin in our experiment we decided to investigate the use of bromothymol blue. This indicator covers a similar pH range however it produces a strong and distinct colour change from blue (pH > 7.6) to yellow (pH < 6.0). Additionally the change in colour can easily measured using spectroscopy. We can either measure the disappearance of blue colour at an absorbance wavelength of 616 nm or the appearance of the yellow colour at 453 nm.
Week 25: October 14 - October 18
In order to assist the modelling efforts of the team the dot assay of Prussian blue ferritin and TMB was repeated upon nitrocellulose. The goal of this assay was to determine the lowest amount of Prussian blue ferritin acting as a reporter with the naked eye. Based on the results of this assay it was determined that 2.5 ng of Prussian blue ferritin produced the minimum colourimetric output that could be detected with the naked eye. Additionally this week we tested β-lactamase using banzylpenicillin as a substrate in combination with bromothymol blue as a pH indicator. From this assay we could see that β-lactamase could be used as a reporter enzyme producing a visible colour change (Figure 9,10).

Figure 10.Change in pH catalyzed by β-lactamase using benzylpenicillin. Bromothymol blue was used to keep track of this colour change. Different amounts of β-lactamse were tested. Commercial β-lactamase was used as a positive control. Negative controls included were bovine serum albumin, β-lactamase without the substrate and the substrate by itself.
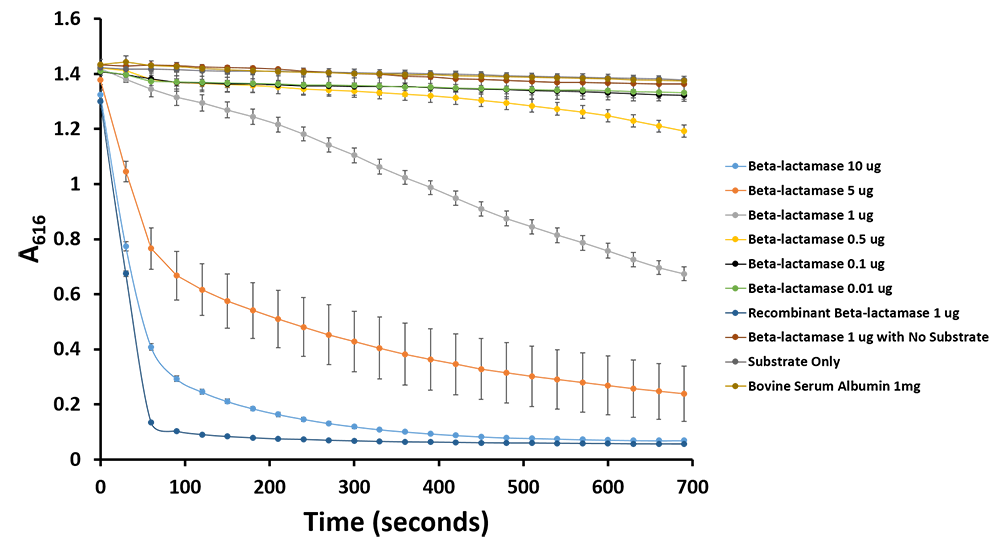
Figure 11.Change in pH catalyzed by β-lactamase using benzylpenicillin. Bromothymol blue was used to keep track of this colour change. Absorbance readings were taken at 616 nm every 30 seconds. Different amounts of β-lactamse were tested. Commercial β-lactamase was used as a positive control. Negative controls included were bovine serum albumin, β-lactamase without the substrate and the substrate by itself.
Week 26: October 21 - October 25
This week was spent converting our constructed ferritin into more Prussian blue ferritin for experiments. Additionally we performed an assay in order to determine whether having TALEs directly fused to ferritin or making use of coils was optimal for the assembly of ferritin and it's use as a reporter (Figure 11). Kinetic assays proved to be difficult to run this week as the spectrophotometer broke the deep bonds of trust that we had established in our relationship over the summer.

Figure 12. Samples of our parts that were converted to Prussian Blue ferritin were mole balanced in order to ensure that the same number of effective ferritin cores are present in every sample. Additionally the ferritin-coil fusion was incubated with the TALE-coil fusion part in order to allow their binding for a separate trial. Negative controls include unconverted recombinant ferritin, bovine serum albumin and a substrate only control. Samples were incubated with a TMB substrate solution for 10 minutes at a pH of 5.6. Absorbance readings were taken at the 10 minute time-point at a wavelength of 650 nm. An ANOVA (analysis of variants) was performed upon the values to determine that there was statistical difference in the data gathered (based off of three replicates). A t-test was then performed which determined that the * columns are significantly different from the ** column (p=0.0012). Neither * column is significantly different from each other (p=0.67).
Week 27: October 28 - November 1
It's our favourite time of the year; Wiki Freeze! See you in Boston.