 "
"
Team:Calgary/Project/PostRegionals
From 2013.igem.org
Final System

Final System
Our Sensor
The goal of our project this summer was to design a biosensor to rapidly identify cattle known as super-shedders. We are building a DNA-based biosensor as it is more reliable and cheaper than a protein-based sensor; antibodies would raise the cost of our system and the proteins that they target can get degraded during the sample preparation, whereas DNA is much more stable. A DNA-based sensor also enabled us to target a broader range of harmful E.coli (EHEC). Over the span of our project, the design of our system was influenced by our conversations with industry stakeholders . Their feedback revealed three design considerations which we would have to incorporate into our prototype. First, it would have to be cheap so that it could be scaled-up to entire feedlot or processing operation. Second, it would have to be easy to use by non-laboratory employees in the field. And third, it would have to provide a definitive measure of E.coli shedding levels within an hour to be used during routine check-up procedures or pre-processing. Our solution is the

Figure 1. Our system is composed of both an immobile detector element on the strip that will capture our target DNA and a mobile Ferri-TALE element that will report the presence of our target DNA. The Ferri-TALE is linked by the E/K coiled coils
Can we detect DNA with specificity?
We ordered 60mer FAM-labeled [A] (target sequence for TALEA) and FAM-labeled [B] (target sequence for TALEB) oligos and hybridized them with their reverse complement oligo to make double stranded pieces of DNA containing the target sequence of our TALEs. Using these target sequences and following the TALE Nitrocellulose Functionality Assay, we showed that TALEs bind their target sequence. We incubated Ferritin fused to an E coil to TALE fused to a K coil to make the ferriTALE complex. The complex was then blotted on strips of nitrocellulose paper. The strips were then blocked with milk and soaked in the appropriate DNA solution. Finally, the strips were washed and imaged. We showed that not only TALEs bind DNA (figure 24 and 25), they are also specific for their own target site (Figure 26).
Figure 24. (A) Dot blot of ferriTALE A exposed to FAM labeled DNA containing the A target sequence (protocol). 1.5 µg of TALEA+K coil and 1 µg of ferritin with E coil were incubated for 1 hour to make the ferriTALE complex and the complex was blotted on a strip. The blots were then exposed to 1.66 mM FAM-labeled [A] (TALEA target site) for 1 to 90 minutes as indicated on the strips. "x" is a ferriTALE that was exposed to FAM labeled DNA prior to being blotted onto the nitrocellulose. The kinetics from the densitometry is shown in section B of the figure. The Kd from this plot was determined to be 293nM Figure 25. (A) Dot blot of ferriTALE B exposed to FAM labeled DNA containing the B target sequence (protocol). 1 µg of ferritin fused to E coil was incubated with 2 µg of TALEB fused to k coil for 1hour to make the FerriTALEB complex. Subsequently the complex was blotted on the nitrocellulose strip. The blots were then exposed to 1.66 mM FAM labeled DNA for 1 to 90 minutes as indicated on the strips. The controls are to the right, with "ftn" being ferritin only, "np" being no protein, and "D-" being no DNA exposure. The kinetics from the densitometry is shown in section B of the figure. The Kd from this plot was determined to be 66nM. Figure 26. (A) A Dot blot of TALEA on nitrocellulose paper (protocol). A6 is TALEA soaked in 1.66mM FAM-labeled [B]. A7 is TALEA soaked in 1.66mM FAM-labeled [A]. A2 is TALEA soaked in 1mM FAM-labeled [B]. A3 is TALEA soaked in 1mM FAM-labeled [A]. On the A- strip no protein was blotted and it was soaked in 1.66mM [A]. All strips were soaked in DNA solution for 90 minutes. (B) 1uL of the DNA solutions used for soaking were blotted on nitrocellulose and a picture was taken instantly, to indicate that both [A] and [B] fluoresce to the same extent.


Can our coils bind?
After putting in gratuitous effort to build parts containing our coils and successfully purifying these proteins we wanted to determine if the E and K coils interacted with each other. In order to characterize coil-coil interaction we performed an immunoprecipitation (IP) assay. We built a GFP with an E coil ( BBa_K1189014) and we also built TALE-B with a K-coil (BBa_K1189030). To characterize the binding of the coils we pulled down with either an immunoglobulin G antibody (IgG) that serves as a negative control or with GFP antibody. The idea behind this experiment is to pull down the E coil which is fused to GFP with a GFP antibody and then probe with a anti-his antibody which recognizes the his tag on the TALE fused to the K coil. Upon interaction between the E and K coils we will see an output at approximately 86 kDa when probed with a His-antibody as seen in Figure 7. Our test groups included the coils by themselves and both the E and K coils put together in solution. As seen in Figure 7 a band appears only when we pull E and K coil with a GFP and probe with an anti-his antibody indicating the presence of both GFP and TALE in the elution solution indicating that the coils interact with each other.

How does the use of Coils versus Direct Fusions of TALEs Affect our Prussian Blue reporter?
After successfully confirming that we could convert our own ferritin proteins that were produced from the parts we constructed (BBa_K1189018, BBa_K1189021) into Prussian blue ferritin the next step was to evaluate how the design of our parts could potentially affect the reporter activity of our Prussian blue ferritin. Based on the spatial modelling performed by our team it was suggested that assembly of the ferritin nanoparticle with TALE proteins directly fused was highly unlikely. This is because the TALE proteins are significantly larger than the ferritin subunits. Their size would likely result in steric hindrance and prevent the assembly of the full ferritin protein. In order to test the predictions put forward by our modelling we ensured that our protein samples were balanced in order to have the same number ferritin cores in each sample. The catalytic activity of these proteins was then compared. From the data gathered we saw that the Prussian blue ferritin with fused coils (even if TALES are additionally bound to the ferritin via coils) was more effective as a reporter than having the TALE proteins directly fused to the ferritin nanoparticle (Figure 19). The results from this experiment suggest that the predictions made by our model were correct. Using coils however alleviates this issue as these coils are small and would not interfere in the ferritin self-assembly but can be used to attach our TALES to create the FerriTALE.

Figure 19. Samples of our parts that were converted to Prussian Blue ferritin were mole balanced in order to ensure that the same number of effective ferritin cores are present in every sample. Additionally the ferritin-coil fusion was incubated with the TALE-coil fusion part in order to allow their binding for a separate trial. Negative controls include unconverted recombinant ferritin, bovine serum albumin and a substrate only control. Samples were incubated with a TMB substrate solution for 10 minutes at a pH of 5.6. Absorbance readings were taken at the 10 minute time-point at a wavelength of 650 nm. An ANOVA (analysis of variance) was performed upon the values to determine that there was statistical difference in the data gathered (based off of three replicates). A t-test was then performed which determined that the * columns are significantly different from the ** column (p=0.0012). Neither * column is significantly different from each other (p=0.67).
Our Final System: Putting it all together
Can we successfully capture our DNA with our detectors with specificity and report it?
Finally, we wanted to see if the TALE capture assay works (figure 17). In order to do this, we blotted TALEB fused to a K coil (BBa_K1189030) was blotted on a nitrocellulose strip. Subsequently the strips were blocked with 5% skimmed milk in TBST buffer. The strips were then washed and soaked in a solution containing [A] and [B] on the same plasmid(BBa_K1189006). The strips were then washed again with TALE binding buffer and soaked in a solution containing TALEA+β-lac (BBa_K1189031). Then a blot dot was done on the strips with β-lactamase primary antibody and an hrp conjugated secondary antibody. This assay demonstrated that the TALEs can capture DNA.

Figure 17. Figure on the left: For the dual TALE lanes TALEB fused to a K coil (BBa_K1189030) was blotted on a nitrocellulose strip. Subsequently the strips were blocked with 5% skimmed milk in TBST buffer. The strips were then washed and soaked in a solution containing [A] and [B] on the same plasmid(BBa_K1189006). The strips were then washed again with TALE binding buffer and soaked in a solution containing TALEA+β-lac (BBa_K1189031). Then a blot dot was done on the strips with β-lactamase primary antibody and an hrp conjugated secondary antibody. In negative 1 the strip was not soaked in the DNA solution. In Negative 2, the strip was not soaked in TALEA+β-lac solution. For positive controls, TALEA+βlac was blotted on the strip at the beginning instead of TALEB+K coil. The figure on the right shows the result of the densitometery we performed on the dot blot assay.
In order to demonstrate that we can successfully capture target DNA with two TALEs we did a capture TALE assay. TALE B was incubated with DNA containing target sites for TALE A and TALE B and blotted on nitrocellulose. After blocking and washing, TALE A β-lactamase fusion (BBa_K1189031) was added to the nitrocellulose strips. The strips were transferred into a 96 well plate to which a benzylpenicillin substrate solution with phenol red was added. If the TALE A β-lactamase fusion bound to the target site for TALE A then the solution will change colour from pink to clear. If TALE A β-lactamase fusion was not present, the solution will remain pink. We can show that the first four samples which have TALE B with DNA for TALE A and TALE B show a colour change indicating that we are successfully capturing the target DNA and reporting it. Furthermore we can also show that when we add non-specific DNA we do not see a colour change demonstrating that we can successfully capture only specific DNA and report its presence with an easy visual colourimetric output.

Figure 6: TALE capture assay was done with TALE B ( BBa_K1189001 )and TALE A B-lac fusion ( BBa_K1189031 ) and DNA ( BBa_K1189006 ) with both target sequences. If capture is successful, the B-lac is present in the well giving a colour change from pink to yellow when subjected to benzylpenicillin substrate solution within 20 minutes. The only wells that change colour are the first four wells which contain TALE B, specific DNA, and TALE A β-lactamase fusion and our positive control wells which are the controls for our fusion TALE A β-lactamase protein and our positive recombinant β-lactamase. All our other controls including our test using a non-specific sequence of DNA remained pink . This preliminary characterization data demonstrates that the TALEs are able to bind to DNA with specificity. Additionally it also shows that our system of capturing DNA with two detector TALEs and then subsequent reporting of the DNA’s presence works.
This assay shows that we can capture our target DNA with two detector TALEs with specificity. Additionally, we can report whether that DNA has been captured and is present in the sample, which is an essential concept for our sensor system.
Full System Kinetic Model
With a preliminary understanding of how our system works we proceeded to quantitatively model our entire system. To do this we used the kinetic constants found in our experiments from the TALE and prussian blue ferritin characterization to build a deterministic model in Scilab. We modelled the binding of an immobilized TALE to target DNA in solution and then the subsequent binding of one of our ferriTALEs. We then used the Michaelis-Menten kinetics of our prussian blue ferritin to calculate how quickly it converts TMB into the coloured product that we can see.
When we assembled our reactions into differential equations, we generated 6 equations to cover the change in our 6 variables over time. When this equation was run with the amount of DNA present in a super shedding cow the output chemical, X, changes over time as shown below.

Figure 6. Change in X, the output chemical of our prussian blue ferritin reaction, over time in a system with the amount of target DNA present in a super shedding cow. The red line indicates the concentration at which the reaction becomes visible to the naked eye.
The red line on the figure above shows when the reaction reaches 22.176 µM, which is the concentration at which a blue dot or line becomes visible. This value was calculated based on the kinetic parameters we determined in our characterization of prussian blue ferritin. This takes approximately 4.9 minutes, meaning that we will be able to see a visible response from a super shedding cow in less than 5 minutes!
Further Characterization of our parts
Additionally, we have demonstrated the same pH change of benzylpenicillin to penicillinoic acid by the TALE A β-lactamase fusion (BBa_K1189031) with bromothymol blue. The pH change causes the bromothymol blue to change in colour from blue to yellow as it gets more acidic (Figure 11 & 12). In the presence of TALE A β-lactamase fusion we see the colour change to yellow whereas the negatives not containing TALE A β-lactamase fusion remains blue (Figure 11). We did a kinetic analysis at 616 nm every 30 seconds and as the blue colour disappears, the absorbance at 616 nm decreases (Figure 12). Therefore, the lower the decrease the better the TALE A β-lactamase fusion reporter activity. Our kinetic activity shows that the biggest decrease is in our positive recombinant β-lactamase followed by the TALE A β-lactamase fusion at 10 micrograms. This decrease is lessened as we decrease the amount of TALE A β-lactamase fusion. We can also show that in our negatives with no TALE A β-lactamase fusion we do not have a decrease in absorbance. We have demonstrated the reporter activity both qualitatively (Figure 10 & 11) and quantitatively (Figure 12).

Figure 11.Change in pH catalyzed by TALE A linked to β-lactamase (BBa_K1189031) using benzylpenicillin. Bromothymol blue was used to keep track of this colour change. Absorbance readings were taken at 616 nm every 30 seconds. Different amounts of TALE A linked to β-lactamase (BBa_K1189031) were tested. Commercial β-lactamase was used as a positive control. Negative controls included were bovine serum albumin, β-lactamase without the substrate and the substrate by itself.
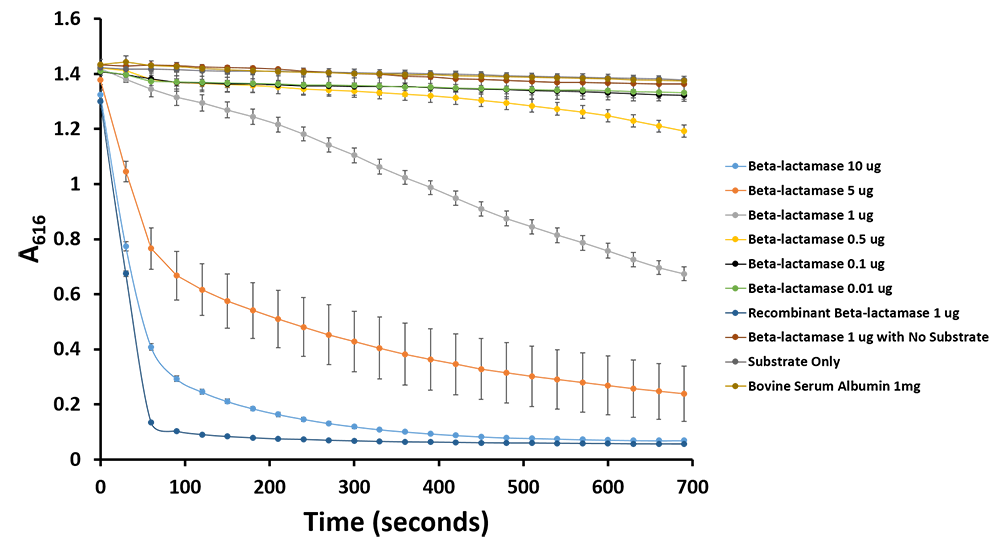
Figure 12.Change in pH catalyzed by TALE A linked to β-lactamase (BBa_K1189031) using benzylpenicillin. Bromothymol blue was used to keep track of this colour change. Absorbance readings were taken at 616 nm every 30 seconds. Different amounts of TALE A linked to β-lactamase (BBa_K1189031) were tested. Commercial β-lactamase was used as a positive control. Negative controls included were bovine serum albumin, β-lactamase without the substrate and the substrate by itself.
Conclusion
We have been able to demonstrate the function our final system capable of capturing DNA with an immobilized TALE, exposing a second TALE with a reporter molecule, and detection of that reporter molecule. In our project we have utilized modelling at every step of the way to inform the course of our experiments, as well as to feed our data back into our models to generate better predictions, utilizing the full design cycle for our system. Through our characterization of parts from previous teams and the ones we have submitted ourselves we have created a collection of well documented parts that can be easily used and modified by any future team for a wide variety of applications. Finally, we are bringing our system into the final prototype stages through our work with nitrocellulose, such that our work can move beyond the proof of principle stages and make an impact in the world to reduce the risk of EHEC harming people in the future.