To learn about this mechanism, click here.
From 2013.igem.org


Model highlight 1: PoPS for promoter strength
Mostly, promoter strength is determined by single-round in vitro transcriptions (sequences containing -35motifs, spacer, -10motifs, disc, start, initial transcribed region - bits) like the model of PWMs or in vivo GFP fluorescent assays. However, there are several drawbacks for using such methods to determine promoter strength. For example, promoter strength determined by sequences may be incorrect due to interdependency of motifs [1]; GFP fluorescent assays can only determine the relative promoter strength but the absolute one.
Concerning the disadvantages above, we choose PoPS mechanism for promoter strength for it is closer to the real situation. PoPS is defined as the level of transcription as the number of RNA polymerase molecules that pass a point on DNA each second, on a per DNA copy basis (PoPS = Polymerase Per Second; PoPSdc = PoPS per DNA copy).
Figure1: an example of PWMs [2]
Figure2: an example of GFP fluorescent assays [3]
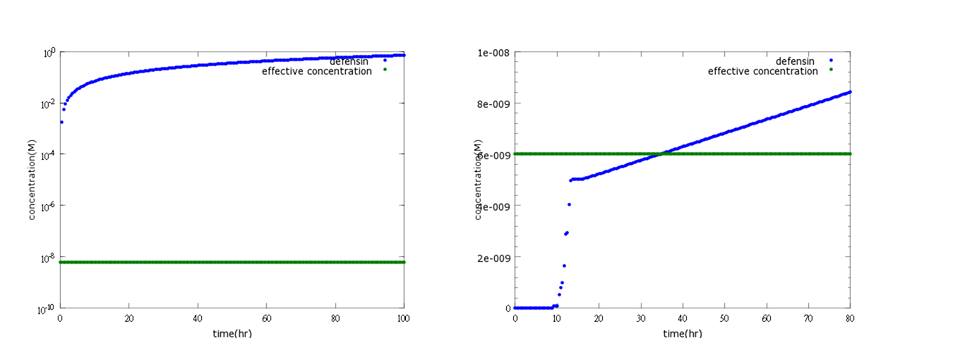
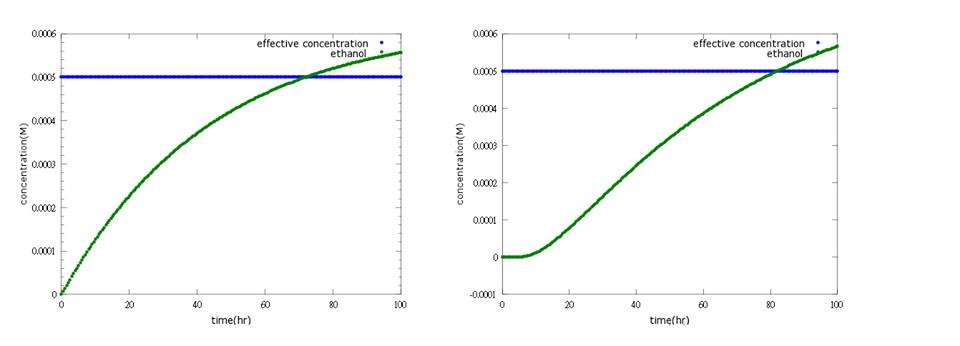
What’s more, instead of describing transcription and translation together, we separate the two apart by applying the similar mechanism (Ribosome on RBS per second) to translation. The following pictures show the comparison between PoPS combing transcription and translation together and the separating counterpart. (figure3,4). The results conclude that the separate one is closer to real situations and thus is more practical.
Figure 3: the left picture shows defensin concentration changes to time with PoPS combing transcription and translation together; the right picture shows the result of defensin production model separating transcription and translation into two steps. In the improved model, lags between sensing Nosema invasion and protein production can be expressed, fitting experimental data.
Figure4: the left picture shows ethanol concentration changes to time with PoPS combing transcription and translation together; the right picture shows the result of ethanol production model separating transcription and translation into two steps. In the improved model, lags between sensing Nosema invasion and ethanol production can be expressed, enabling terminator’s effect to show(to learn more about circuit design, click here).
Reference: 1. Virgil A. Rhodius and Vivek K. Mutalik. Predicting strength and function for promoters of the Escherichia coli alternative sigma factor, σE. December 29, 2009
2. Virgil A. Rhodius and Vivek K. Mutalik. Predicting strength and function for promoters of the Escherichia coli alternative sigma factor, σE. December 29, 2009
3. John Blazeck, Rishi Garg, Ben Reed, Hal S. Alper. Controlling Promoter Strength and Regulation in Saccharomyces cerevisiae Using Synthetic Hybrid Promoters.
 "
"


