Team:Bielefeld-Germany/Collaborations
From 2013.igem.org
| Line 110: | Line 110: | ||
<div align="center"> | <div align="center"> | ||
{| class="wikitable" style="text-align:center" border="0" cellpadding="5" cellspacing="0" align="center" | {| class="wikitable" style="text-align:center" border="0" cellpadding="5" cellspacing="0" align="center" | ||
| - | !BioBrick number | + | !BioBrick number <br> |
!Measured relative <br> promoter strength<br> [-] | !Measured relative <br> promoter strength<br> [-] | ||
|- | |- | ||
Revision as of 15:49, 4 October 2013
Collaborations
Abstract
Beside the research into the project it is important to collaborate with other iGEM teams to support them. This support can be carried out in different ways, for example an exchange via a skype interview or characterize the other part of the other team. In the following description we list our collaborations between us and other teams.
iGEM-Team York_UK
Because of the fact that both teams do research into microbial fuel cells we get in touch and talked about our projects. We get to know that York had problems with cloning the mtrCAB cluster and invested a lot of time to solve this problems. Because of the fact that time was running we decided to help York. We already designed our MFC and tested different constructions which one is the best to use. We constructed a MFC specially adapted to the requirements of York and wrote an instruction how to operate with the MFC. In addition we put nafion membranes, gaskets, carbon electrodes and injectors into a package and send it to York. We hope that this support helped York to generate good results and finish their project.
iGEM-Team NRP-UEA-Norwich
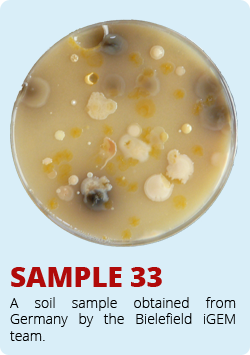
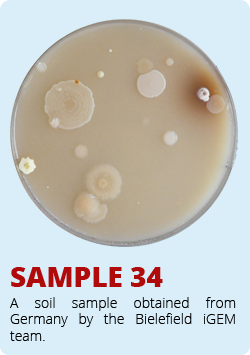
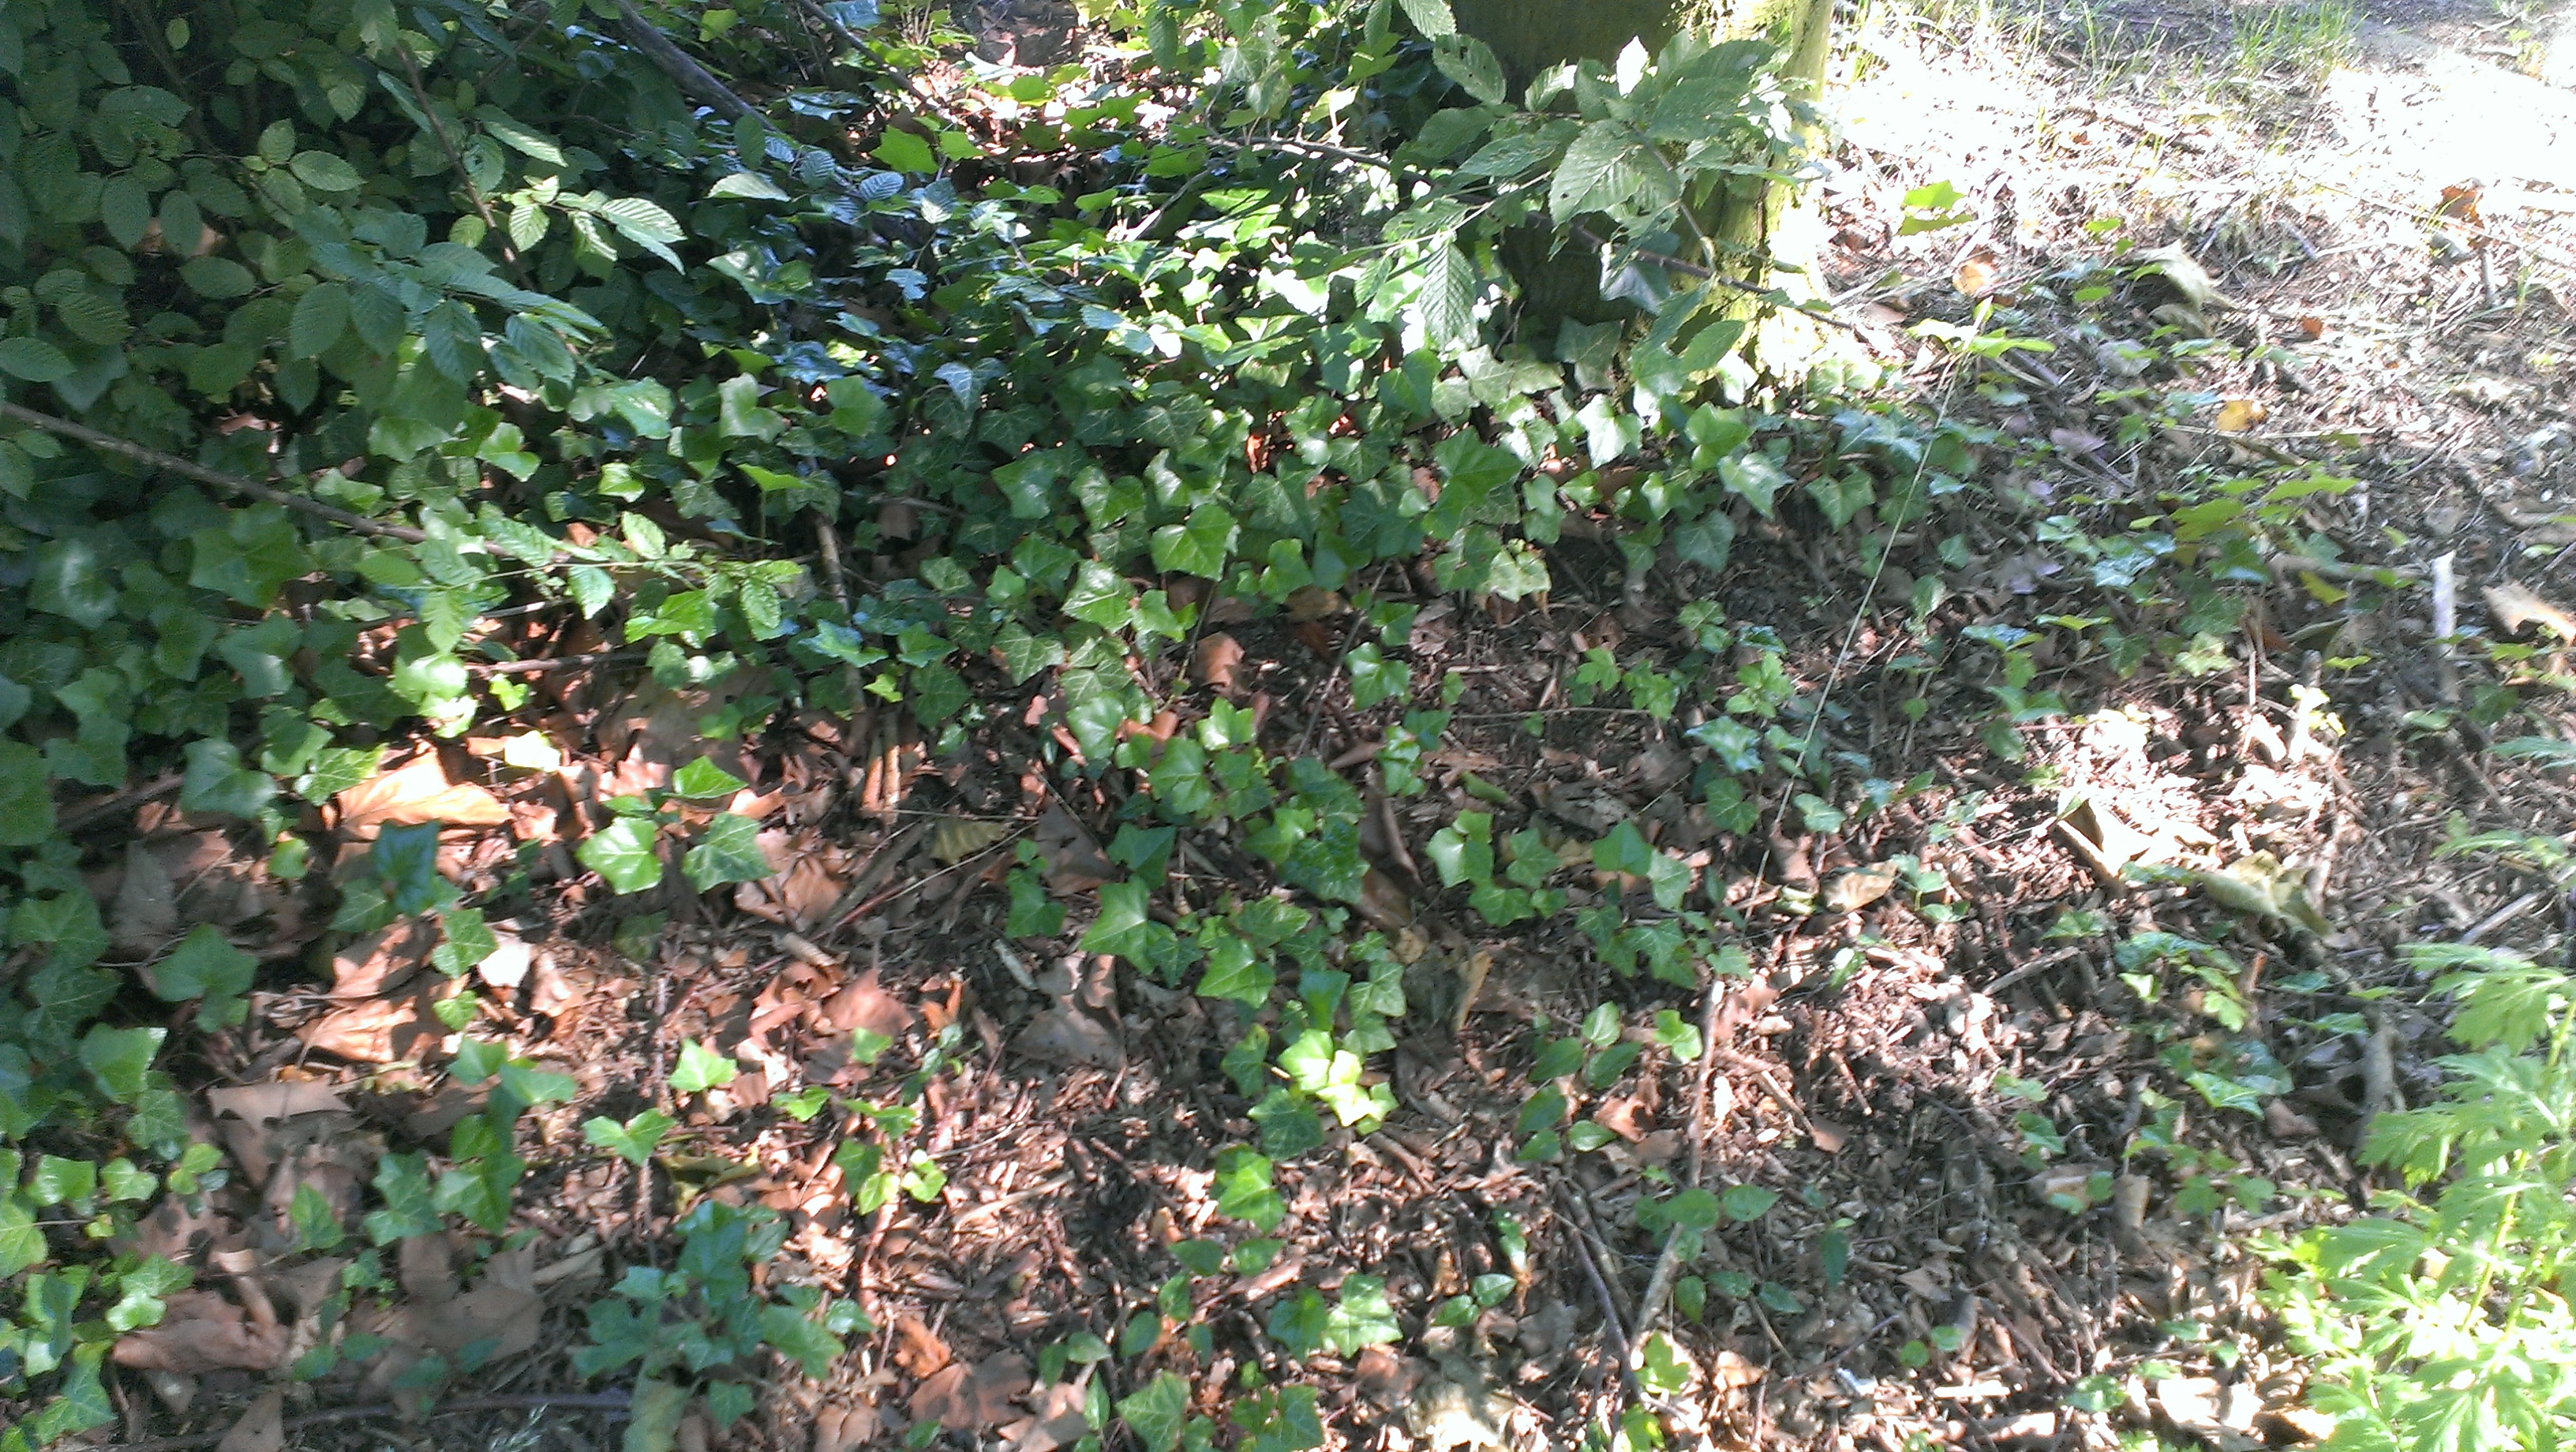
The iGEM-Team from Norwich developed a biosensor which enable the identification of antimycin-producing strains of streptomyctes. Therefore they asked us to send them soil samples from Bielefeld. Of course we took samples of soil and send them to Norwich. The interesting soil samples of Bielefeld are shown below. We hope that our soil samples helped Norwich.
iGEM-Team UC Davis
The iGEM-Team UC-Davis 2013 wants to develop and implement an
[http://dilbert.cs.ucdavis.edu/Depot/ experimental data depot] for BioBrick characterization data and kindly asked us to collaborate with them. They want to establish an easily accessible and comparative platform to share experimental data about BioBricks and are searching for other teams, that are willing to help them establish standardized characterization methods. We tested their promoter characterization protocols on the
[http://parts.igem.org/Promoters/Catalog/Anderson Anderson promoter collection] J230100-J230119. The plasmid backbone of these BioBricks J61002 is very suitable for promoter insertion between the XbaI and SpeI sites, which places the promoter upstream of a red fluorescent protein (RFP) gene. Depending on the used promoter, the rfp-expression is in- or decreased, while the promoter strength can easily be characterized via fluorescence measurements.
Our team focused mainly on the second half of the collection, which comprises promoters with the below listed strengths.
| BioBrick number | Measured relative promoter strength [-] |
|---|---|
| BBa_J23119 | n/a |
| BBa_J23101 | 0.7 |
| BBa_J2308 | 0.51 |
| BBa_J2309 | 0.04 |
| BBa_J23111 | 0.58 |
| BBa_J23112 | 0.00 |
| BBa_J23113 | 0.01 |
| BBa_J23114 | 0.10 |
| BBa_J23115 | 0.15 |
| BBa_J23116 | 0.16 |
| BBa_J23117 | 0.06 |
| BBa_J23118 | 0.56 |
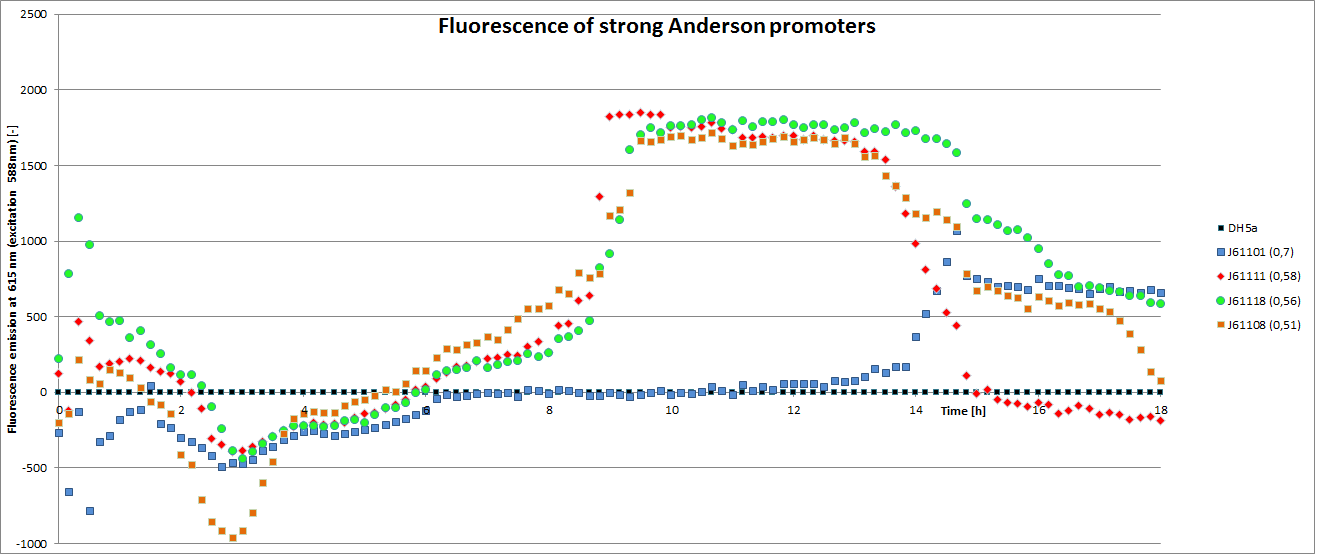
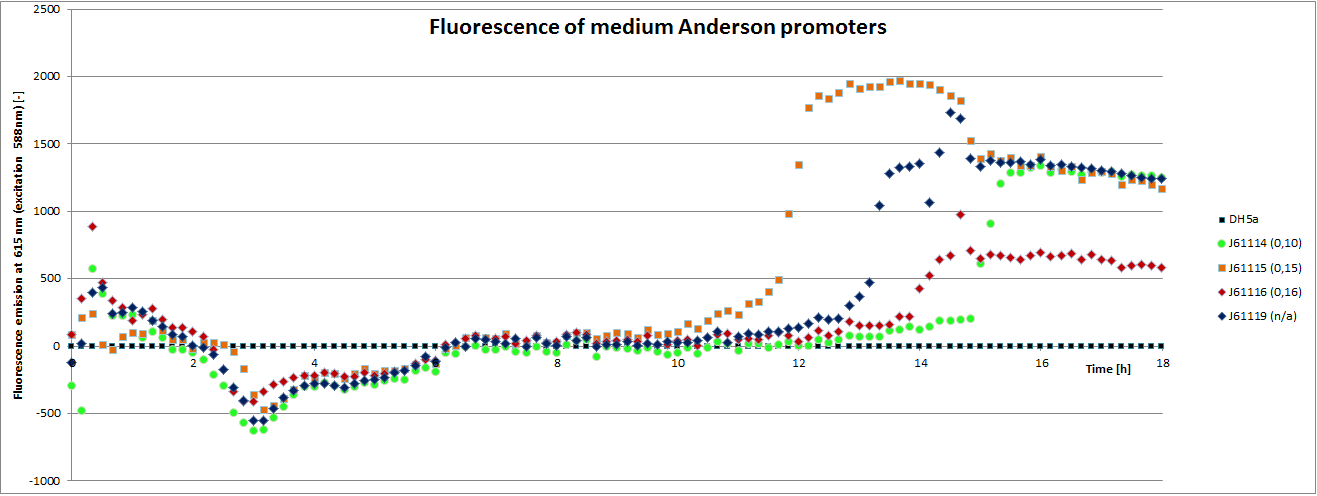
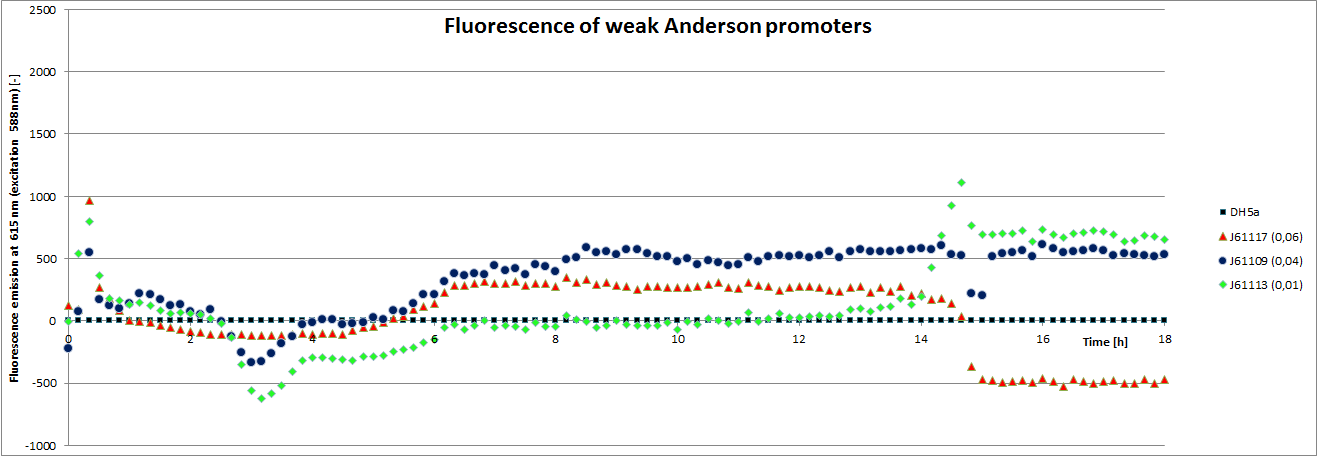
We carried out an extended, 18-hour experiment, monitoring cell density through absorbance measurement and promoter strength by fluorescence emission. The results are shown subsequently.
Please note that we monitored the optical density at 700 nm wavelength, because the UC-Davis team was concerned about interferences of OD600 measurements with the fluorescence measurements.
To determine the relative strength of the used promoters we looked at the fluorescence signal of RFP. With increasing promoter strength, transcription should be enhanced and more RFP will be expressed. This results in a higher fluorescence signal.
The results show very clearly, that strains containing a plasmid with a stronger promoter are fluorescing earlier than those with medium and weak promoters. Also, the fluorescence intensity is significantly lower for weak promoters in comparison to the stronger ones. The DH5α-strain with an inherent J23101 plasmid (relative strength 0.7) did surprisingly not fluoresce the strongest. This might be due to a problem with plasmid stability in this strain. Also, the unmeasured J23119 BioBrick seems to hold a promoter of medium strength.
The widely plausible results show, that the protocols for promoter BioBrick characterization work quite well. Comparisons to experimental results from all over the world can be carried out using this method and promise a well characterized and frequently validated parts registry.
This collaboration was a great chance to communicate and discuss data in an international outreach and taught us a lot about other teams work routines and standards. It was a pleasure to contribute in their project to find a way to effectively share complex experimental data and to work out routines for BioBrick characterization
 "
"

