Team:Bielefeld-Germany/Project/MFC Efficiency
From 2013.igem.org
| Line 87: | Line 87: | ||
| - | [[Image:IGEM_Bielefeld2013_ReferenceElectrodeSchematic.png|500px|thumb|center|<p align="justify"> '''Figure 1: Schematic illustration of the | + | [[Image:IGEM_Bielefeld2013_ReferenceElectrodeSchematic.png|500px|thumb|center|<p align="justify"> '''Figure 1: Schematic illustration of the [https://2013.igem.org/Team:Bielefeld-Germany/Project/MFC#MFC_Evolution generation three<sup>''plus''</sup> MFC] measurement setup, using a Ag/AgCl reference electrode. '''</p>]] |
| Line 93: | Line 93: | ||
| - | [[Image:IGEM_Bielefeld2013_ReferenceElectrodeCurves.jpg|500px|thumb|center|<p align="justify"> '''Figure 2: Plot of the overall cell potential, cathode potential against Ag/AgCl reference electrode and the calculated data for the anode potential for a measurement of wild type'' E. coli'' KRX, OD<sub> 600</sub> : 1,66 in the | + | [[Image:IGEM_Bielefeld2013_ReferenceElectrodeCurves.jpg|500px|thumb|center|<p align="justify"> '''Figure 2: Plot of the overall cell potential, cathode potential against Ag/AgCl reference electrode and the calculated data for the anode potential for a measurement of wild type'' E. coli'' KRX, OD<sub> 600</sub> : 1,66 in the [https://2013.igem.org/Team:Bielefeld-Germany/Project/MFC#MFC_Evolution generation three<sup>''plus''</sup> MFC]. Methylene blue was added after 15 minutes with an end concentration of 232,56 µM. '''</p>]] |
Revision as of 14:08, 28 October 2013
MFC Efficiency
In order to get a better evaluation of our Microbial Fuel Cell, we calculated several characteristic numbers. Furthermore we considered a feasibility study and compared it with our results.
Efficiency calculation
Verification, comparison and appraisal of measurement results
After consultation with expert Dr. Falk Harnisch and the productive feedback of our presentation and poster session within the European Jamboree in Lyon the need for verifying our measurement system and a technical and economic appraisal of the results became very obvious.
As the overall cell-voltage represents the difference between anode and cathode potential it was not clear whether the measured voltage values were influenced by the biocatalytic activity in the anode chamber only, or by a combination of potential changes in both chambers. For independent consideration of the anode or cathode compartments potential a Ag/AgCl [http://www.meinsberger-elektroden.de/labor/bezug.html#se10 reference electrode] was ordered and the MFC generation threeplus was designed and constructed to make the new electrode usable. The circuit diagram, including a schematic illustration of the entire measurement setup is shown in Figure 1.
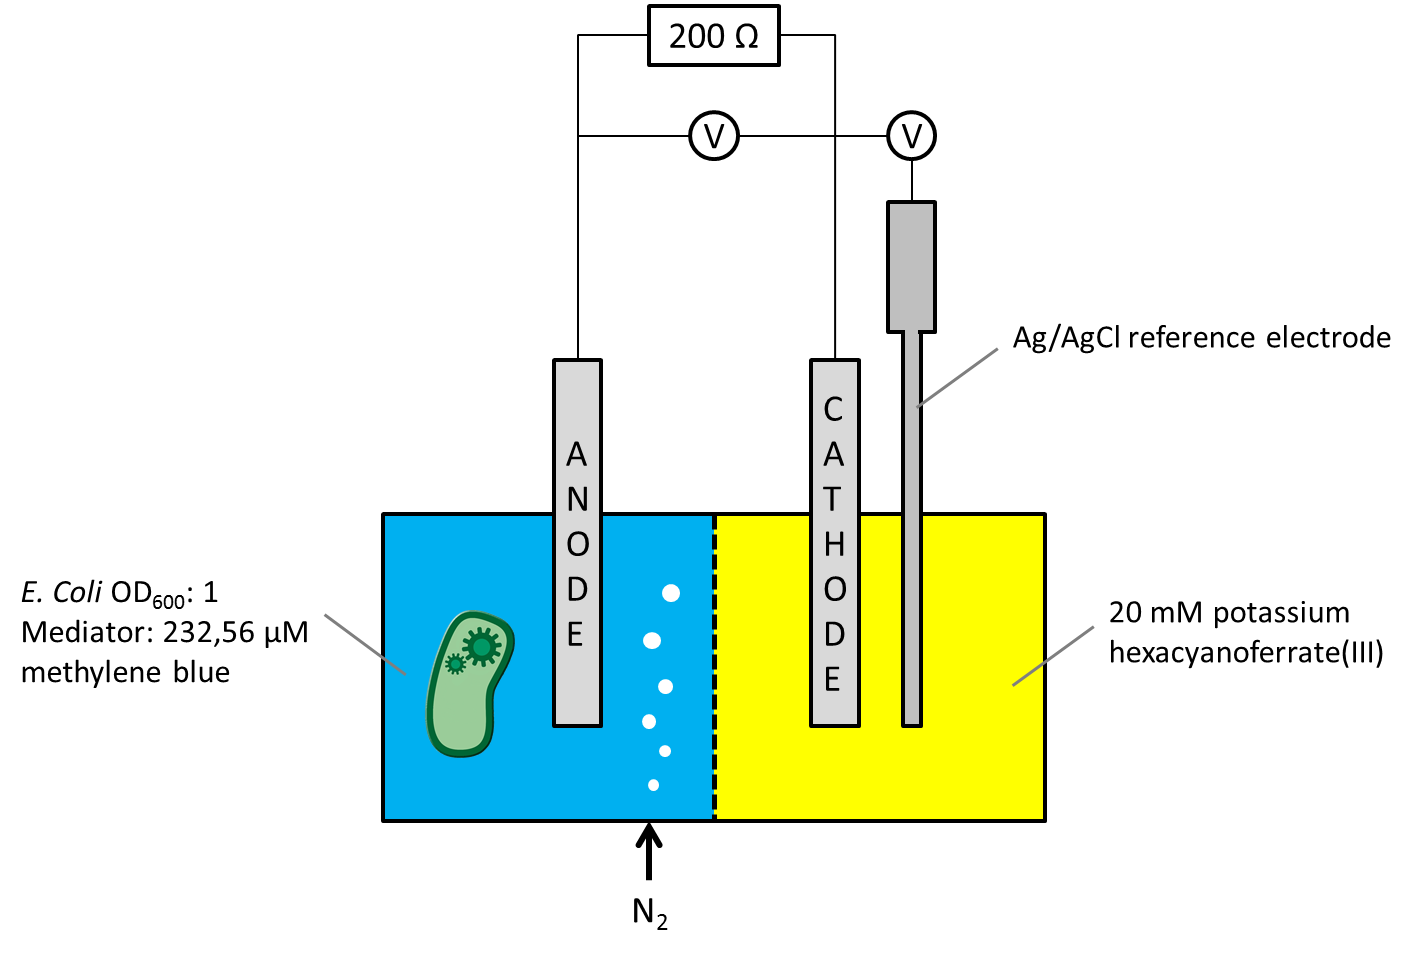
Figure 1: Schematic illustration of the generation threeplus MFC measurement setup, using a Ag/AgCl reference electrode.
- Using this setup the parallel measurement of both the overall cell potential and the potential of the cathode were measured. The according data, including the c anode potential, calculated from Pcell= Pcathode - Panode are plotted in Figure 2.
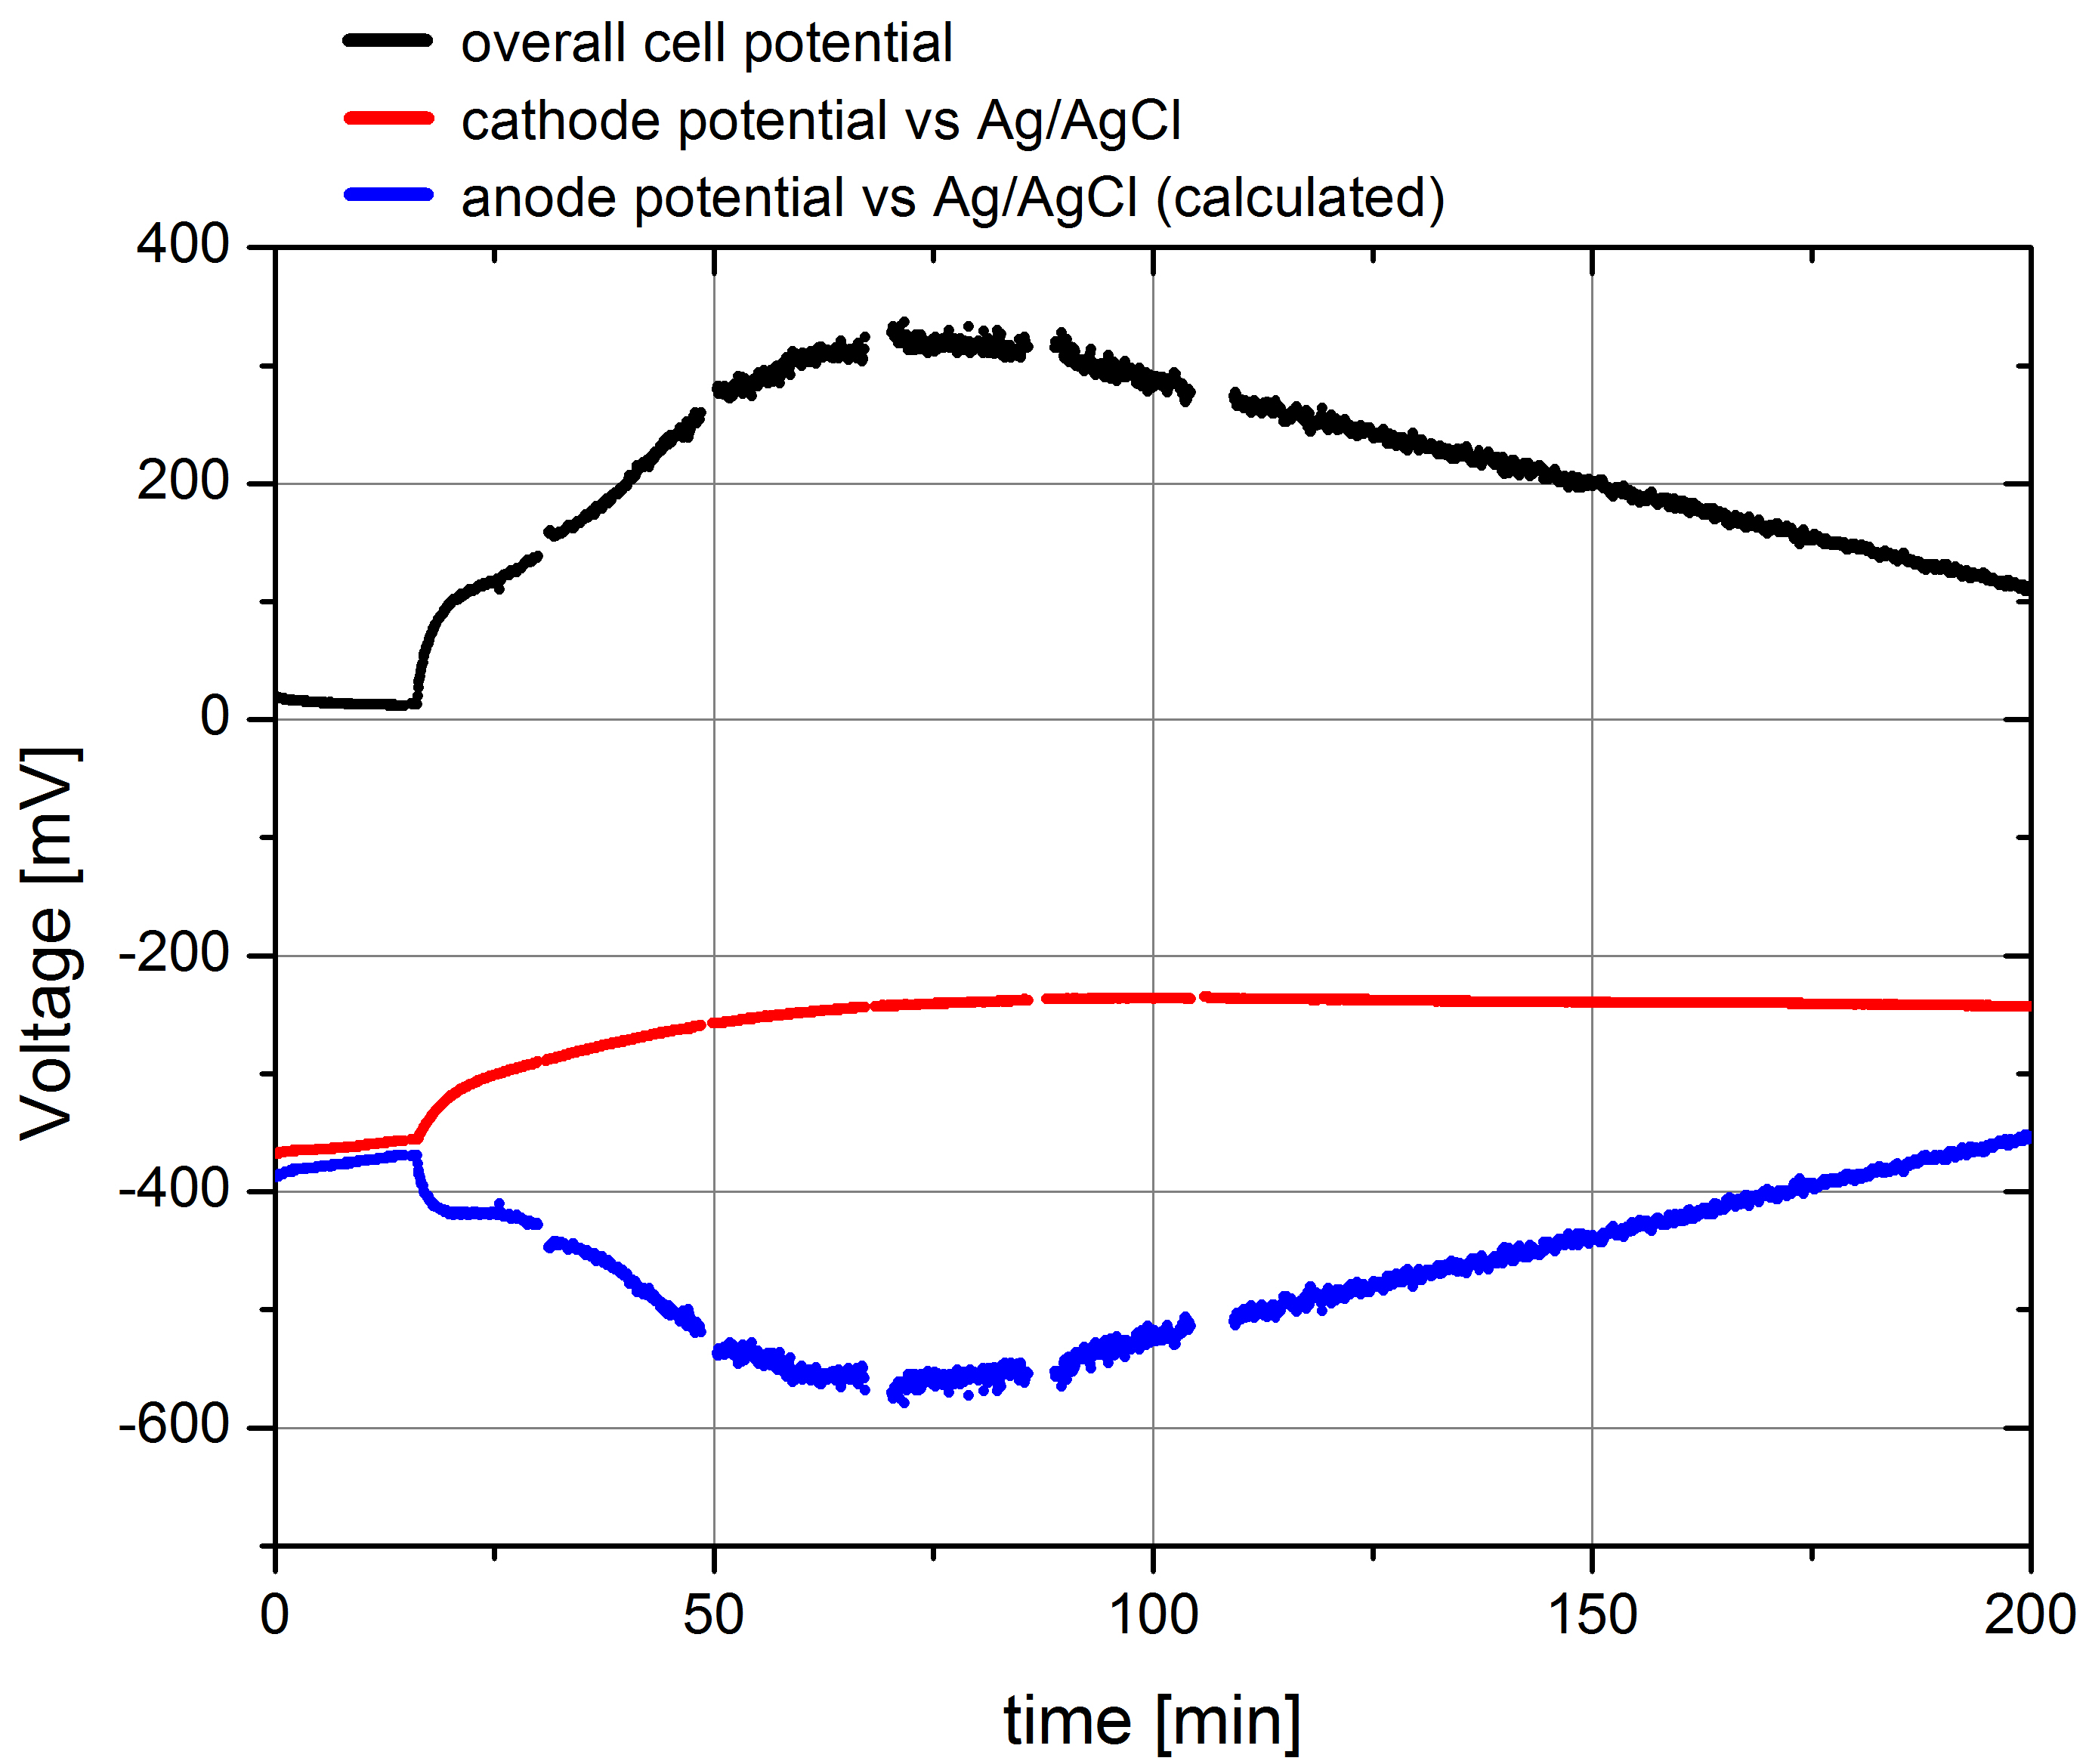
Figure 2: Plot of the overall cell potential, cathode potential against Ag/AgCl reference electrode and the calculated data for the anode potential for a measurement of wild type E. coli KRX, OD 600 : 1,66 in the generation threeplus MFC. Methylene blue was added after 15 minutes with an end concentration of 232,56 µM.
The illustrated data show the expected courses. In the beginning the cell potential is very low, because the cells cannot transport the produced electrons to the anode. After addition of the mediator solution the cell potential shows a characteristic increase and reaches its maximum of 325 mV. The cathode potential against Ag/AgCl amounts about –360 mV at the start of the measurement, what was expected by calculating the potential using Nernst equation. The course of the measured potential values also shows a significant effect of mediator addition because of a polarization of both electrodes regarded to the resulting current flow, but it reach a stable value of -240 mV quickly. This and the calculated anode potential data show, that the anode potential is mainly responsible for the overall cell potential, so that the measurement of this value is suitable for the analysis of different bacteria strains or even enzymes, placed in the anode chamber.
As the detailed description of the [generation threeplus MFC indicates, the cell is furthermore optimized for a better power output in terms of a larger volume, higher N2 aeration and an adapted mediator concentration. To generate different operating numbers for the established microbial fuel cell generation three plus the determination of the regarded substrate concentrations was necessary. Because of the incompatibility between the mediator methylene blue and the separation column, used for sugar analysis, a new purification method was established. The methylene blue containing samples were blended with a spatula tip of activated carbon, inverted for two minutes and centrifuged at 10000 x g for 5 minutes. To exclude an effect on the substrate concentration standard samples, containing different amounts of mediator and activated carbon were analyzed using the substrate HPLC-method. As the results showed no differences for methylene blue containing standard samples treated with activated carbon and the untreated sample the method usability could be verified.
Feasibility study for MFC in sewage and waste treatment
To assess the usability of our MFC regarding potential applications, we considered a feasibility study and compared it to our results. It shows, that our currently achieved efficiencies have the potential for efficient energy production in real world applications.
The study
Feasibility study for the application of a Microbial Fuel Cell in sewage and waste treatment ([http://www.dbu.de/projekt_26580/_db_1036.html AZ 26580-31])
Funded by the ‘Deutschen Bundesstiftung Umwelt – Osnabrück‘
Reporting period: 16.12.2008 – 31.08.2010
Author:
- Prof. Dr.-Ing. Michael Sievers1
- Dr. Ottmar Schläfer1
- Dipl.-Ing. Hinnerk Bormann1
- Dipl.-Ing. Michael Niedermeiser1
- Prof. Dr. Detlef Bahnemann2
- Dr. Ralf Dillert2
- 1 Clausthaler Umwelttechnik-Institut GmbH – CUTEC-Institut GmbH
- 2 Leibniz Universität Hannover
Summary
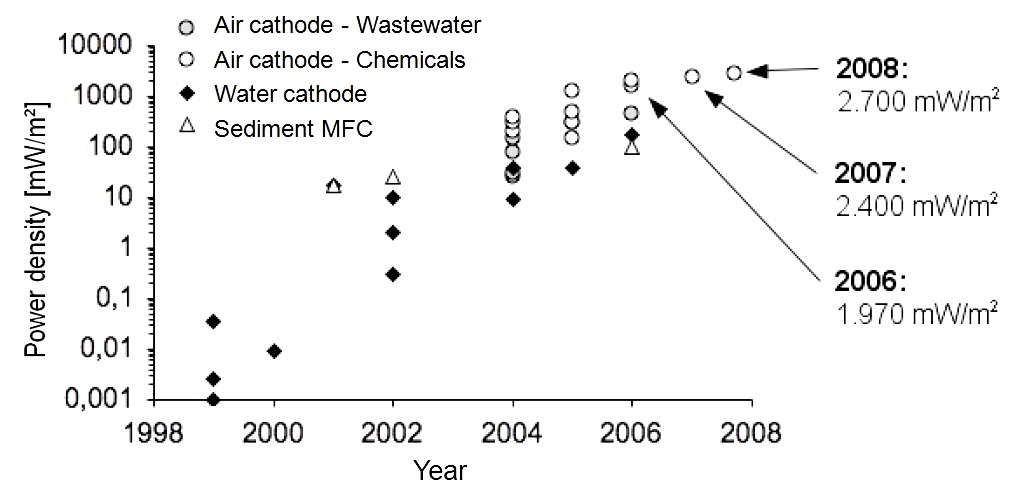
Since the first investigations on mediatorless MFCs in 1999, the maximum power densities increased from 0.05 mW/m2 in 1999 to 2700 mW/m2 in 2008. Therefore, this feasibility study refers to a power density of 2 W/m2.
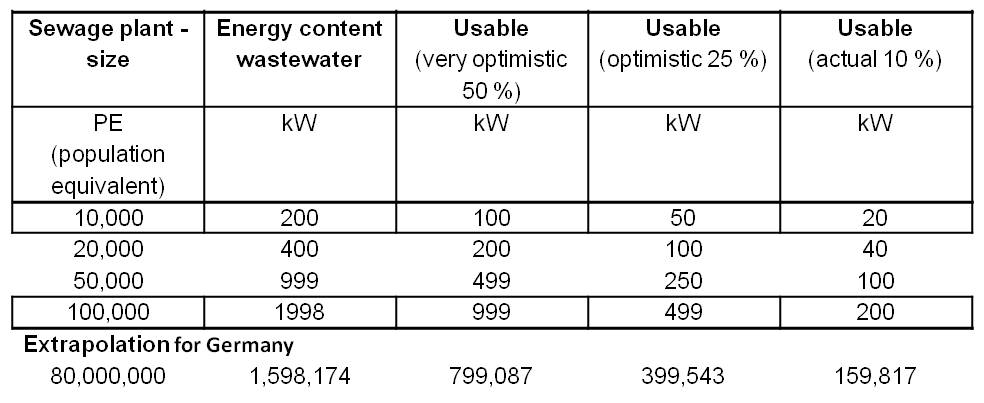
An estimation of the power generation potential shows, that the usage of an MFC could produce around 20 kW for a 10,000 PE (population equivalent) sewage treatment plant. The integration of an MFC would generate an electricity production and saving potential, which provides the opportunity to enable nearly energy self-sufficient sewage treatment plants. This is based on a low cost production with low cost materials of the MFC. Especially electrode and membrane materials have to be cost-saving.
Previous development of the maximal achieved power densities with MFCs
Since the first investigations on mediatorless MFCs in 1999, the maximum power densities increased. Figure 1 (Logan, 2008) shows the development of the power density from 0.05 mW/m2 in 1999 to 2700 mW/m2 in 2008.
Pure chemicals (glucose or glycerol) are much better usable than organic wastewater components. Furthermore, the conductivity of the organic liquid is usually much higher. Consequently, power densities achieved with wastewater tests are lower. On closer examination of the cathode, we can observe a higher power density for air cathodes (wastewater treatment) in comparison to water cathodes (degradation of pure chemicals). Air cathodes are additionally fumigated.
Assessment of the potential for applications
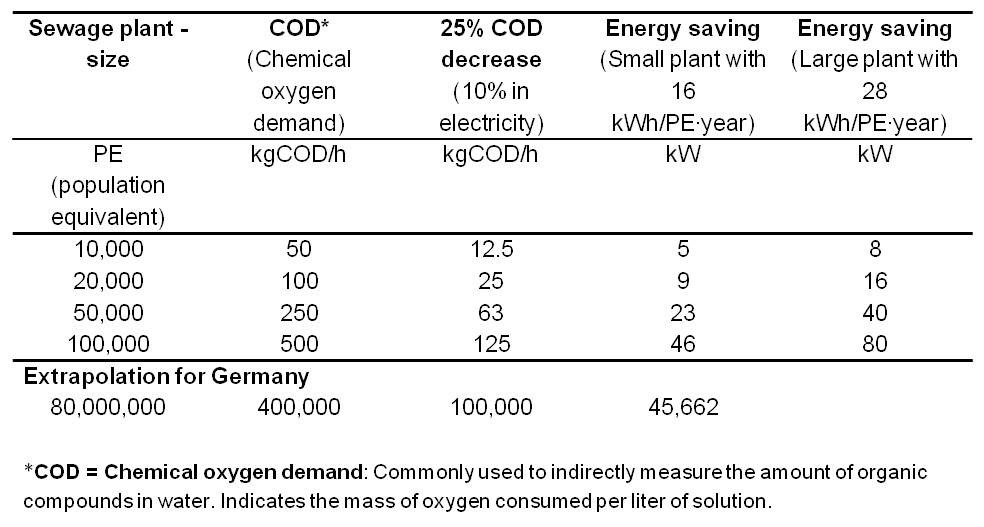
The energy content of waste water is about 20 W per population equivalent (PE). Therefore, a 10,000 PE plant could generate a power of 20 kW. Table 1 shows an overview of the electricity production potential for various wastewater treatment plant sizes with an extrapolation for 80 million people (Number of inhabitants of Germany). The energy content of the water is defined by the COD (Chemical oxygen demand). COD is commonly used to indirectly measure the amount of organic compounds in water.
Table 2 overviews the electricity savings potential for various wastewater treatment plant sizes with an extrapolation for 80 million people (Number of inhabitants of Germany).
In comparison, a fully optimized plant for 100,000 inhabitants has an average power consumption of 285 kW. The integration of an MFC would generate an electricity production potential and electricity savings potential of up to total 246 kW. Thus, the Microbial Fuel Cell provides the opportunity to enable energy self-sufficient sewage treatment plants.
Assessment of our Microbial Fuel Cell
With our self-designed and constructed Microbial Fuel Cell we achieved a power density of 231 mW/m2. (Calculation of the power density). In contrast to the assumed power density for the feasibility study, which was 2000 mW/m2, we have still a ten times lower power density. That means the total electricity saving potential would be 25 kW, which shows a reduction for the required energy of 8% for a fully optimized sewage plant for 100,000 inhabitants with an average power consumption of 285 kW.
References
- Logan BE (2008): Microbial Fuel Cells. John Wiley & Sons Inc., New Jersey.
 "
"

