Team:Bielefeld-Germany/Labjournal/October
From 2013.igem.org
| Line 152: | Line 152: | ||
:*In order to investigate the high extracellular NADH concentration we are performing a LC-ESI MS/MS with the help of Markus Persicke. | :*In order to investigate the high extracellular NADH concentration we are performing a LC-ESI MS/MS with the help of Markus Persicke. | ||
| - | |||
| - | |||
| - | |||
Revision as of 22:39, 28 October 2013
October
Milestones
- Successful cultivations of Escherichia coli KRX with oprF and gldA in our Microbial Fuel Cell.
- NADH overproduction for the gldA strain improves extracellular electron transfer mediated by NADH and resulting in an 20 % increased bioelectricity output.
- Escherichia coli KRX with oprF shows 100 % higher voltage and electric charge than E. coli wild type. Electron shuttle-mediated electron transfer across the membrane is greatly improved by heterologous expression of outer membrane porin oprF.
- Our preferred riboflavin production strain, E. coli KRX equipped with <bbpart>BBa_K1172306</bbpart> , was thouroughly characterized.
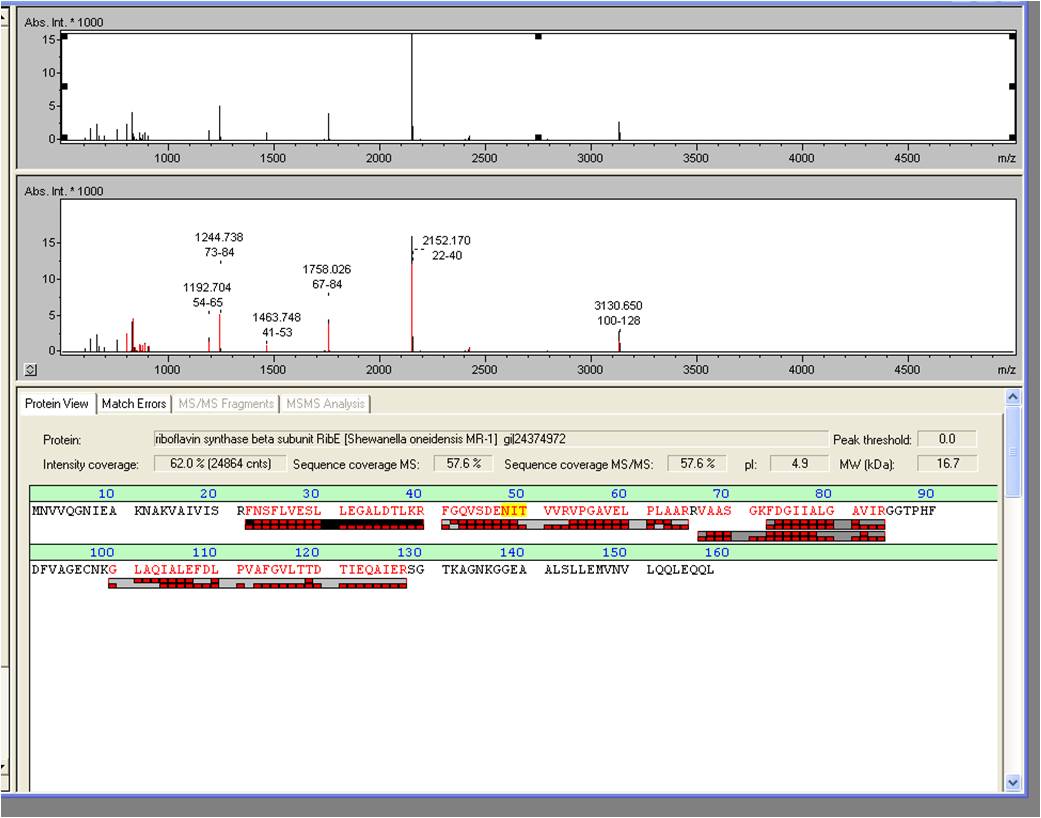
- The overexpression of Riboflavin synthase beta subunit RibE, which belongs to the rib-gene-cluster <bbpart>BBa_K1172303</bbpart> . was examined by MALDI-TOF MS/MS with a Mascot Score of 906 against the NCBI database.
- We proofed the production of riboflavin qualitatively through LC/MS measurement.
- Measuring the fluorescence of supernatant samples from our riboflavin production strain together with riboflavin solutions of known concentration enabled us to make predications regarding the amount of riboflavin produced by our strain.
- Measurement of supernatant samples from our riboflavin production strain against wild type samples with HPLC confirmed an approximately 60fold overexpression of riboflavin and backed up our result from fluorescence and absorbance measurements.
- European Jamboree:
- Advance to Championship
- Best Presentation, Europe, Overgrad
- Regional Finalist, Europe, Overgrad
- Grand Prize Winner, Europe, Overgrad
Week 22
Organization
- Wiki freeze is coming on saturday at 5:59 pm. Planning the last week with tremendous amount of work.
MFC
- Used third generation MFC to record power output of e. coli strains modified with our different biobricks.
- Used stack of five 3rd-generation fuel cells to power different LEDs and a small motor.
Mediators
- For testing the genetic engineered system in the Microbial Fuel Cell, we used Escherichia coli KRX with gldA and Lac promotor (<bbpart>BBa_K1172204</bbpart>) in contrast to Escherichia coli KRX wild type. Certainly NADH-assays determined Escherichia coli KRX with gldA and T7 promotor (<bbpart>BBa_K1172203</bbpart>) as the best endogenous mediator producing strain. Unfortunately we could not use this strain due to cultivation problems.
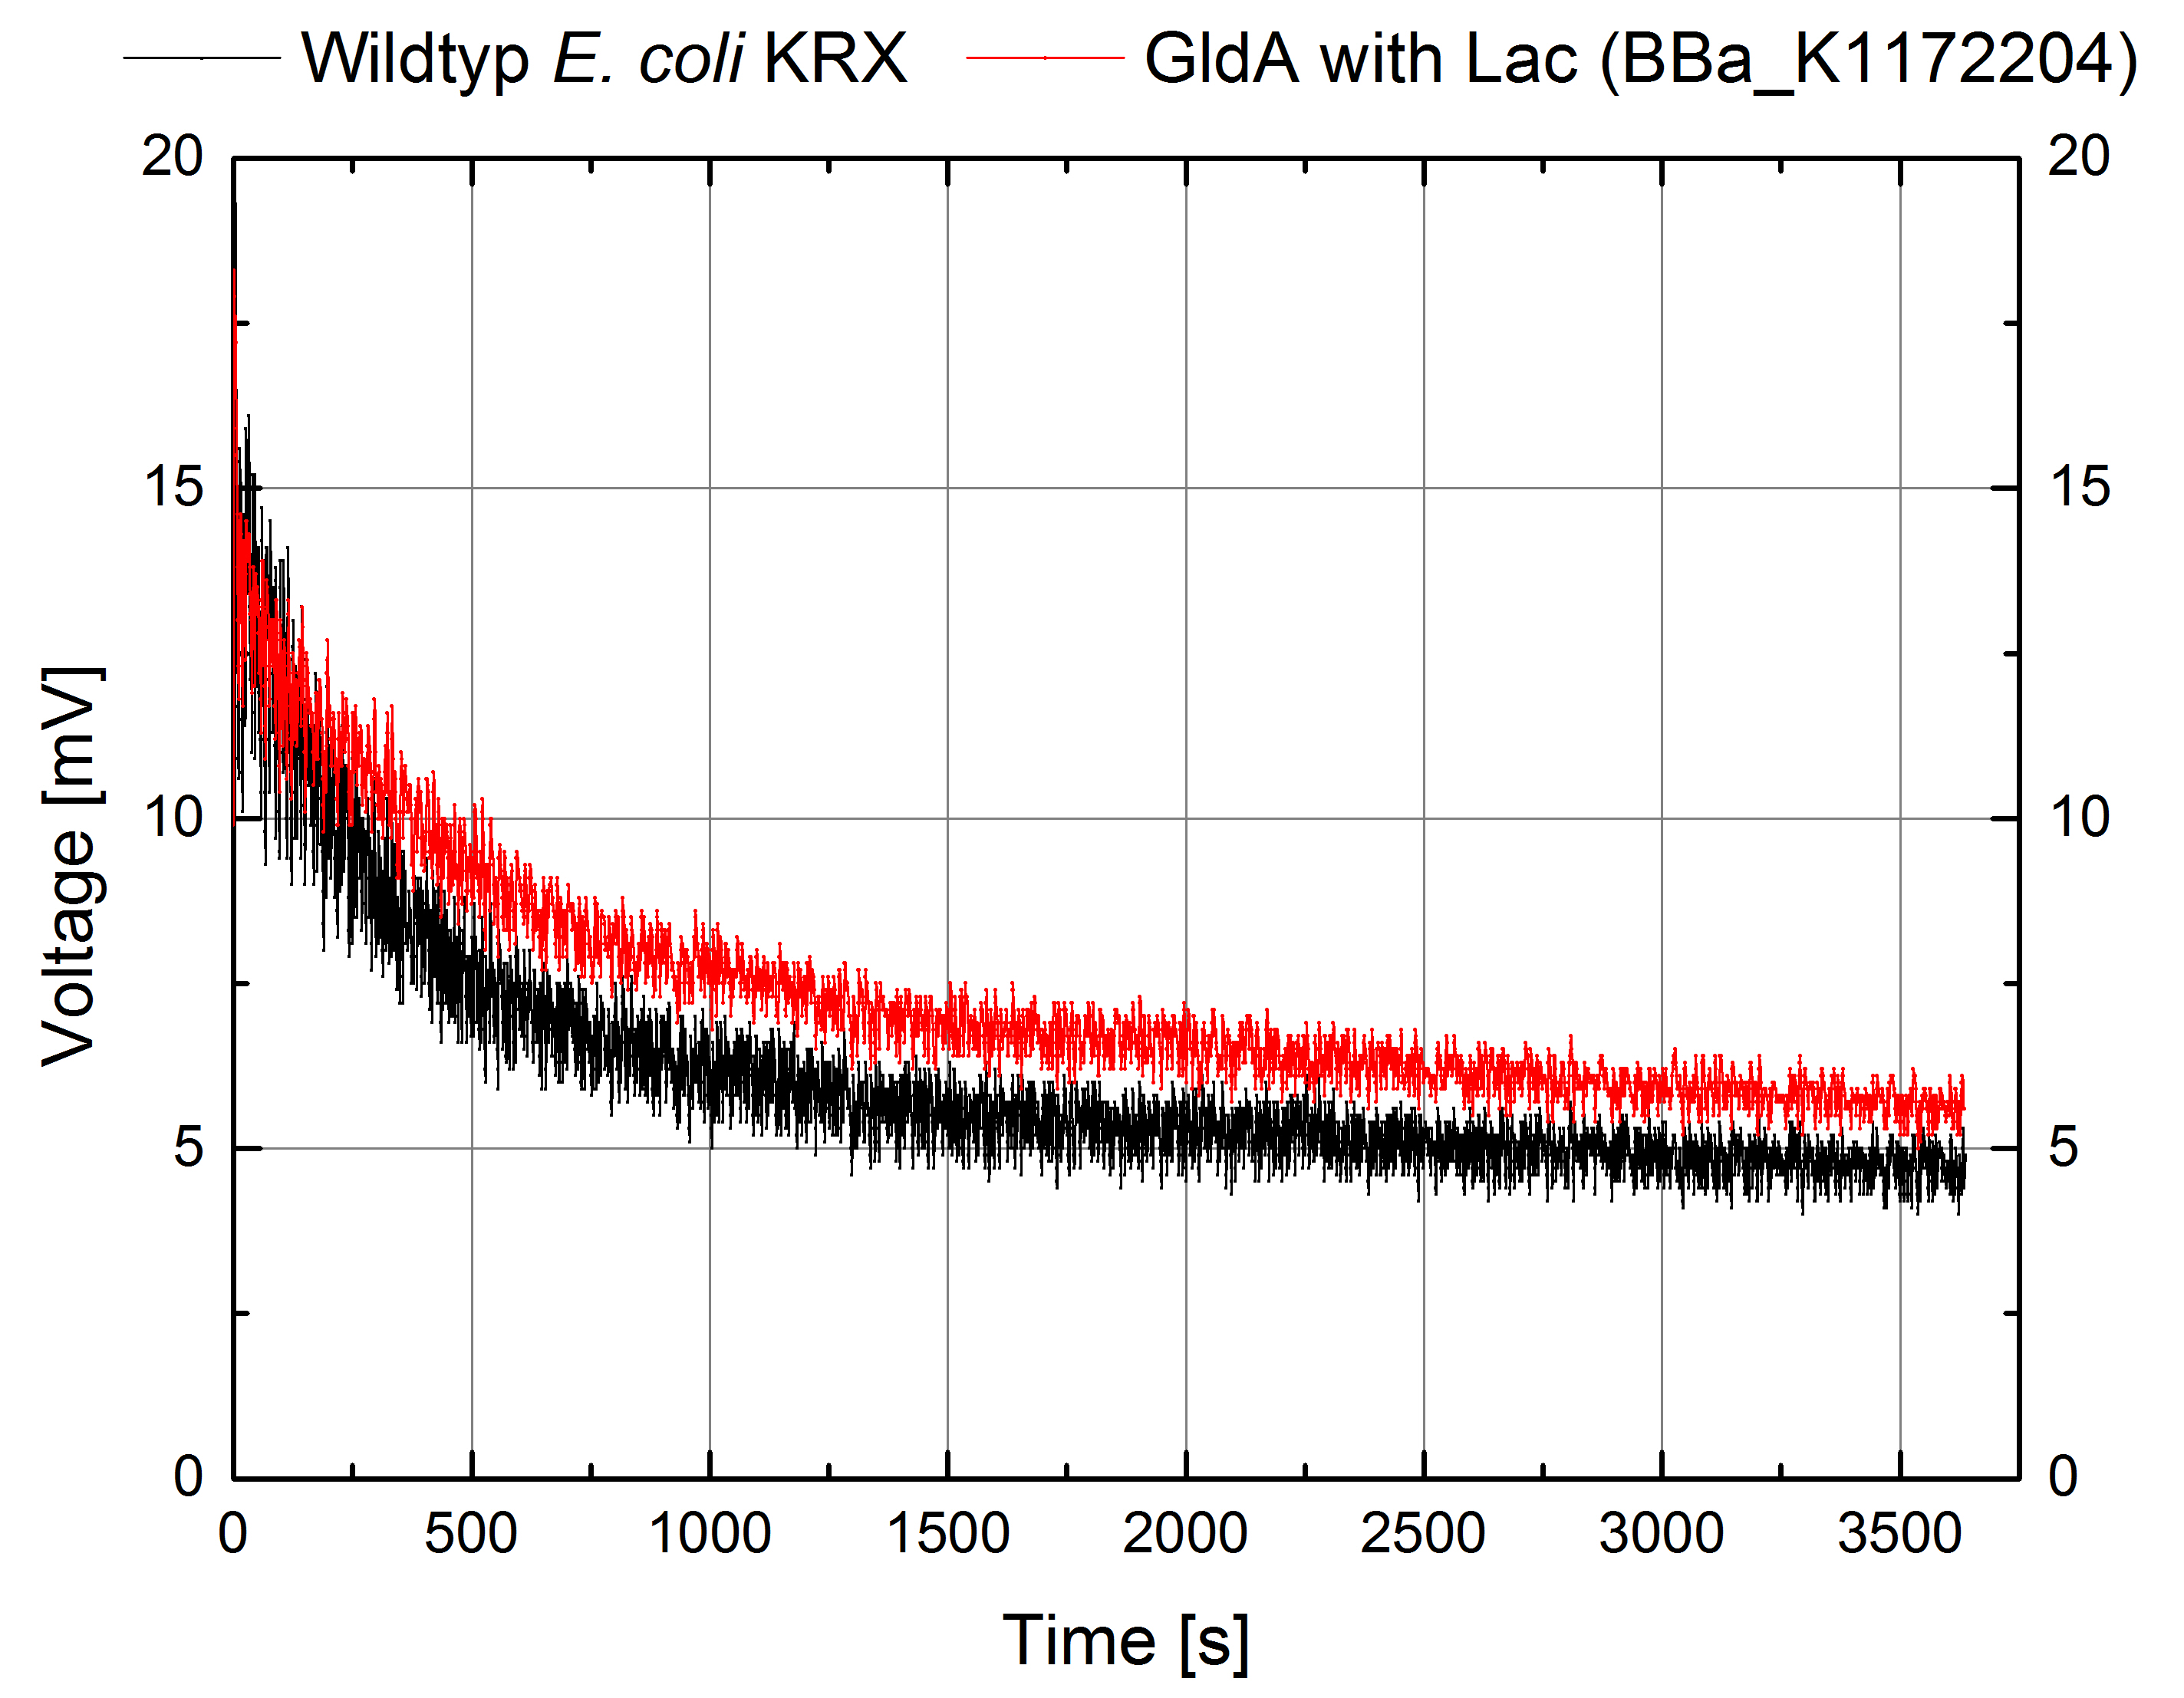
Figure 1: Microbial Fuel Cell results from cultivation of Escherichia coli KRX with gldA (<bbpart>BBa_K1172204</bbpart>) in contrast to Escherichia coli KRX wild type. Voltage curve from Escherichia coli KRX wild type and Escherichia coli KRX with gldA (<bbpart>BBa_K1172204</bbpart>) is shown over time. M9-medium was used with no supplementation of mediators.
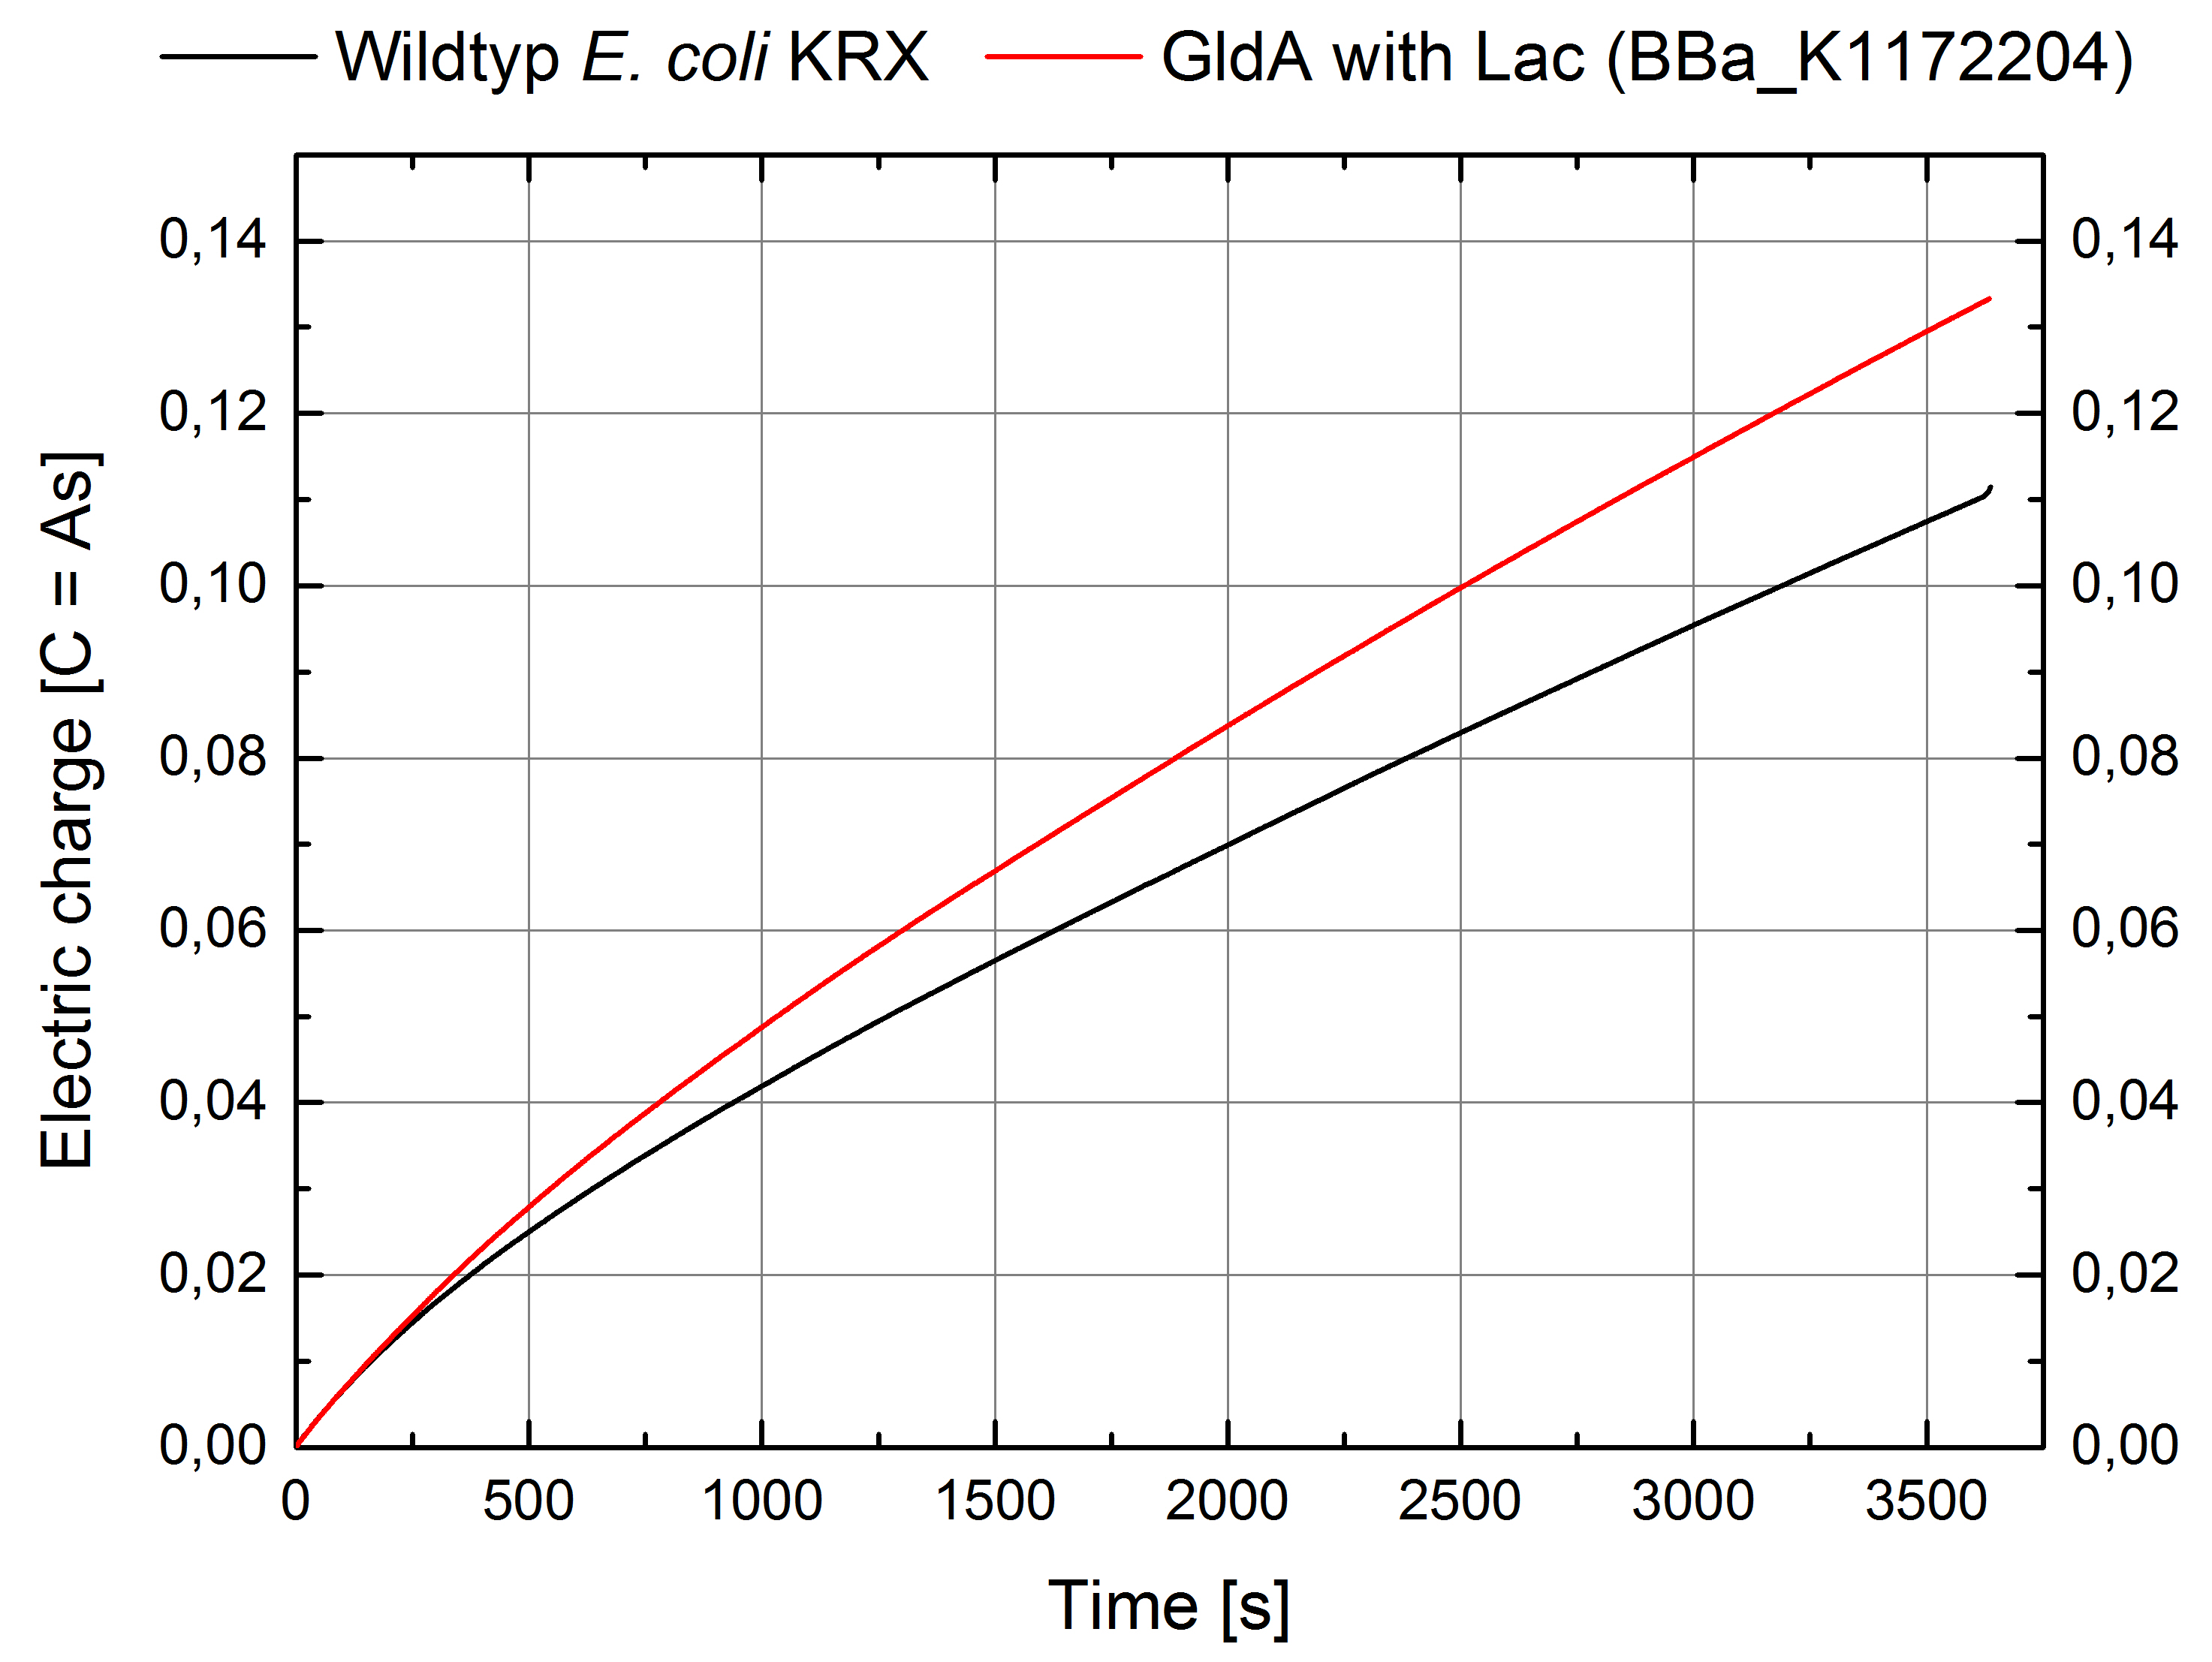
Figure 2: Microbial Fuel Cell results from cultivation of Escherichia coli KRX with gldA (<bbpart>BBa_K1172204</bbpart>) in contrast to Escherichia coli KRX wild type. Electric charge curve from Escherichia coli KRX wild type and Escherichia coli KRX with gldA (<bbpart>BBa_K1172204</bbpart>) is shown over time. M9-medium was used with no supplementation of mediators.
- The extracellular electron transfer mediated by NADH is improved in the gldA strain resulting in an increased bioelectricity output.
Riboflavin
- We received the data from the MALDI-TOF and the subsequent results where positive: The overexpressed protein, had formed a band on a SDS-PAGE at about 15 kDa. We hoped it would turn out to be RibE, with a molecular weight of 16,7 kDa.
- The results show that it is indeed “riboflavin synthase beta subunit ribE” from Shewanella oneidensis MR-1. The mascot score was a slick 906. We want to thank Vera Ortseifen for the execution of our measurements.
- For further quantitative analysis of riboflavin in culture supernatants we measured fluorescence with the [http://www.tecan.com/platform/apps/product/index.asp?MenuID=1812&ID=1916&Menu=1&Item=21.2.10.1 Tecan Infinite® M200 platereader] (The week before we had already measured absorbance). Riboflavine absorbes light at 440 nm with a corresponding emission at 535 nm. We again checked riboflavin of known quantities to compute a calibration line. The samples consisted of KRX wild type bacteria (grown for 72 hours) and KRX that carried the rib-cluster with strong Anderson promoter / strong RBS (<bbpart>BBa_K1172306</bbpart>) (grown for 72 hours and for 12 hours respectively). Of course both cultures were nurtured in the good M9-D5.

Table 1: Pipetting scheme and measurement results of riboflavin standards and cell samples for fluorescence measurement, emission at 535 nm. Measured in the [http://www.tecan.com/platform/apps/product/index.asp?MenuID=1812&ID=1916&Menu=1&Item=21.2.10.1 Tecan Infinite® M200 platereader]. WT = wild type, And77 = E. coli equipped with <bbpart>BBa_K1172306</bbpart>, sn = supernatant, cd = cell disruption.
- Y = 8*10^8 * X - 3193.6
- This allowed us to evaluate the amount of riboflavin in the supernatant and the cell disruption samples.
- Supernatant after 12 hours: 308.1 µg / L
- Supernatant after 72 hours: 3821.5 µg /L
- We asked the lab of Dr. Heino Büntemeyer if we could use their HPLC detector to verify riboflavin concentrations. We prepared some samples and overviewed the measurement. The HPLC-method itself was friendly carried out by Jana Heinrich. It yielded significant results and allows the quantification of riboflavins in our samples.
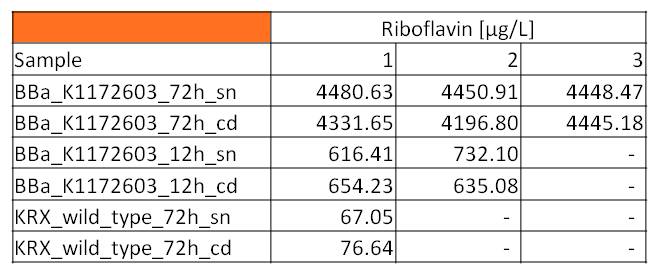
- Table 2 shows the produced amount of Riboflavin. After 72 hours of cultivation in M9-D5 the concentration of riboflavin in supernatant and cell disruption samples of E. coli KRX+<bbpart>BBa_K1172306</bbpart> was 60fold higher than in E. coli KRX wild type. Even after 12 hours, the riboflavin producing strain had generated ten times as much riboflavin as the wild type.
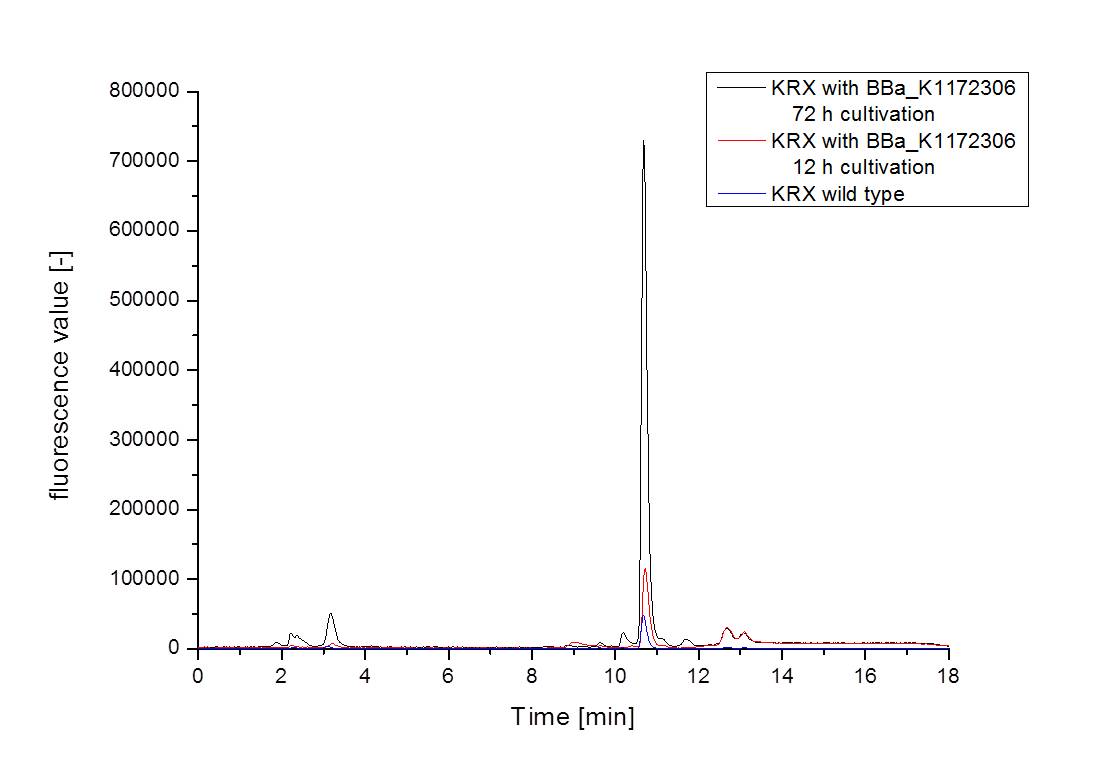
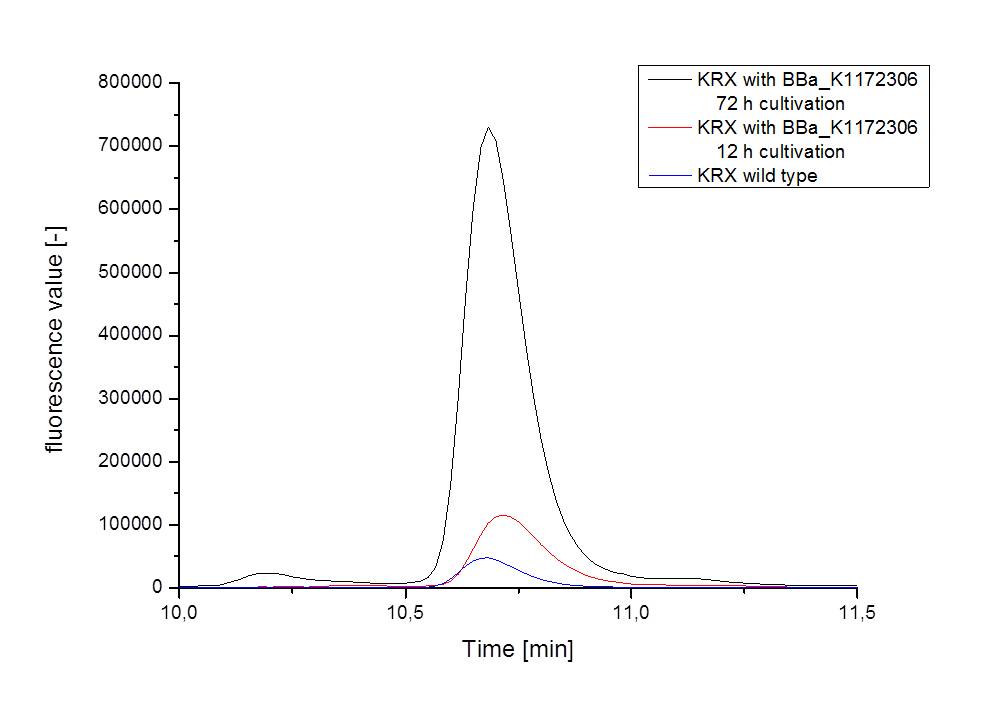
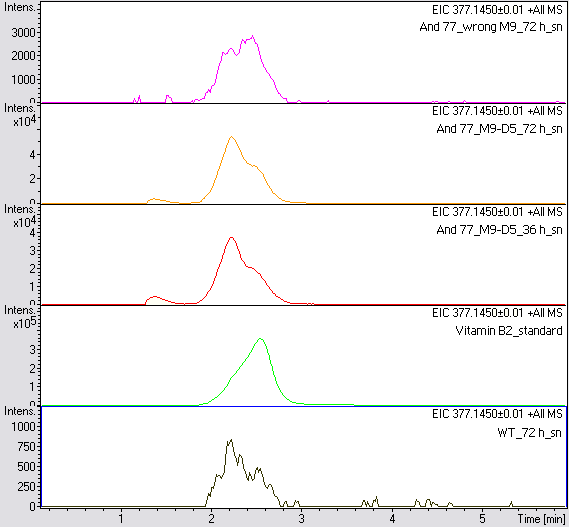
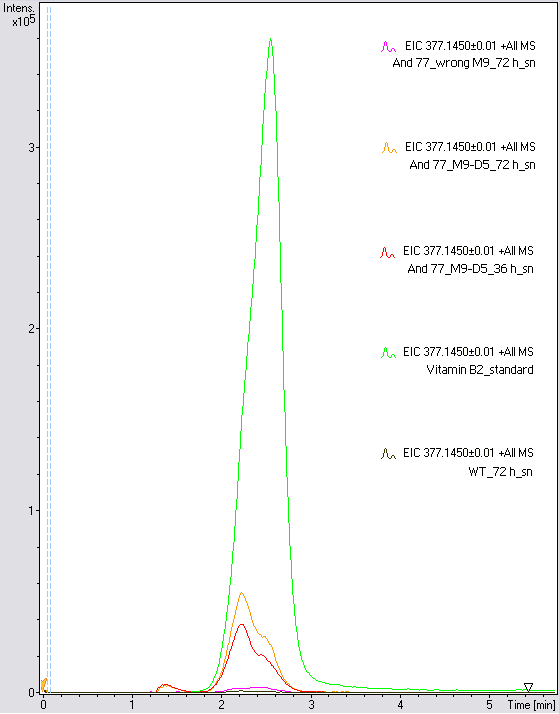
- The wrong M9 medium had been the reason for unsufficient riboflavin production. This fact rendered our first (LC/MS) measurement innocuous. We were able to organize another measurement of some of our samples with liquid chromatography-mass spectrometry (LC/MS). We prepared supernatant samples of a wild type KRX after 72 h, the <bbpart>BBa_K1172306</bbpart> strain after 36 h and 72 h in M9-D5 and after 72 h in a wrong M9. In the following we put the samples in the LC-MS-system. The measurement procedure was carried out by Lena Sinkel.
-
It is clear, that the <bbpart>BBa_K1172306</bbpart> carrying strains produce a much higher amount of riboflavin compared to the wild type KRX strain. The LC/MS results do not allow for a statement on how much more riboflavin our strain produces, because from this method we can´t know if the relation between the amount of vitamin B2 and the peak-area is linear. Nevertheless, it is obvious that riboflavin was overexpressed in a remarkable quantity.
It is although important to notice that the green curve in figures 7 and 8 represents the high concentrated riboflavin standard. A look at Figure 8 and the relative intensities given on the Y-axis, illustrates how much more efficient KRX+<bbpart>BBa_K1172306</bbpart> in M9-D5 produces riboflavin compared to KRX+<bbpart>BBa_K1172306</bbpart> in the wrong M9 and especially compared to wild type KRX.
-
Biosafety
- One day before we pre cultured our bacteria in 5mM D-alanine and glucose medium. After growing we took 10mL of each pre culture and centrifuged the cells for 3 minutes by 6000xg, discarded the supernatant and resuspended the cells in 4mL distilled water. We washed the cells three times. We executed the characterization of araC by cultivation (200rpm) in shaking flasks with different carbon sources (glucose for the first time). We cultivated the different biosafety systems for measuring how the specific product building rate looks like in M9 medium with different carbon sources. As mentioned before, we used GFP instead of Barnase for characterisation. We sampled in regulary intervals to measure the absorbance and the fluorescence.
- We tried to insert the Barnase into the second parts (behind the different promoters), but couldn't achive it in the short time.
Porines
- Great results for Escherichia coli KRX with oprF (<bbpart>BBa_K1172502</bbpart>) in contrast to Escherichia coli KRX wild type with Microbial Fuel Cell cultivation.
- According to our assumptions, the extracellular electron transfer mediated by electron shuttles is improved in the oprF strain resulting in an increased bioelectricity output. (Figure 9 and 10)
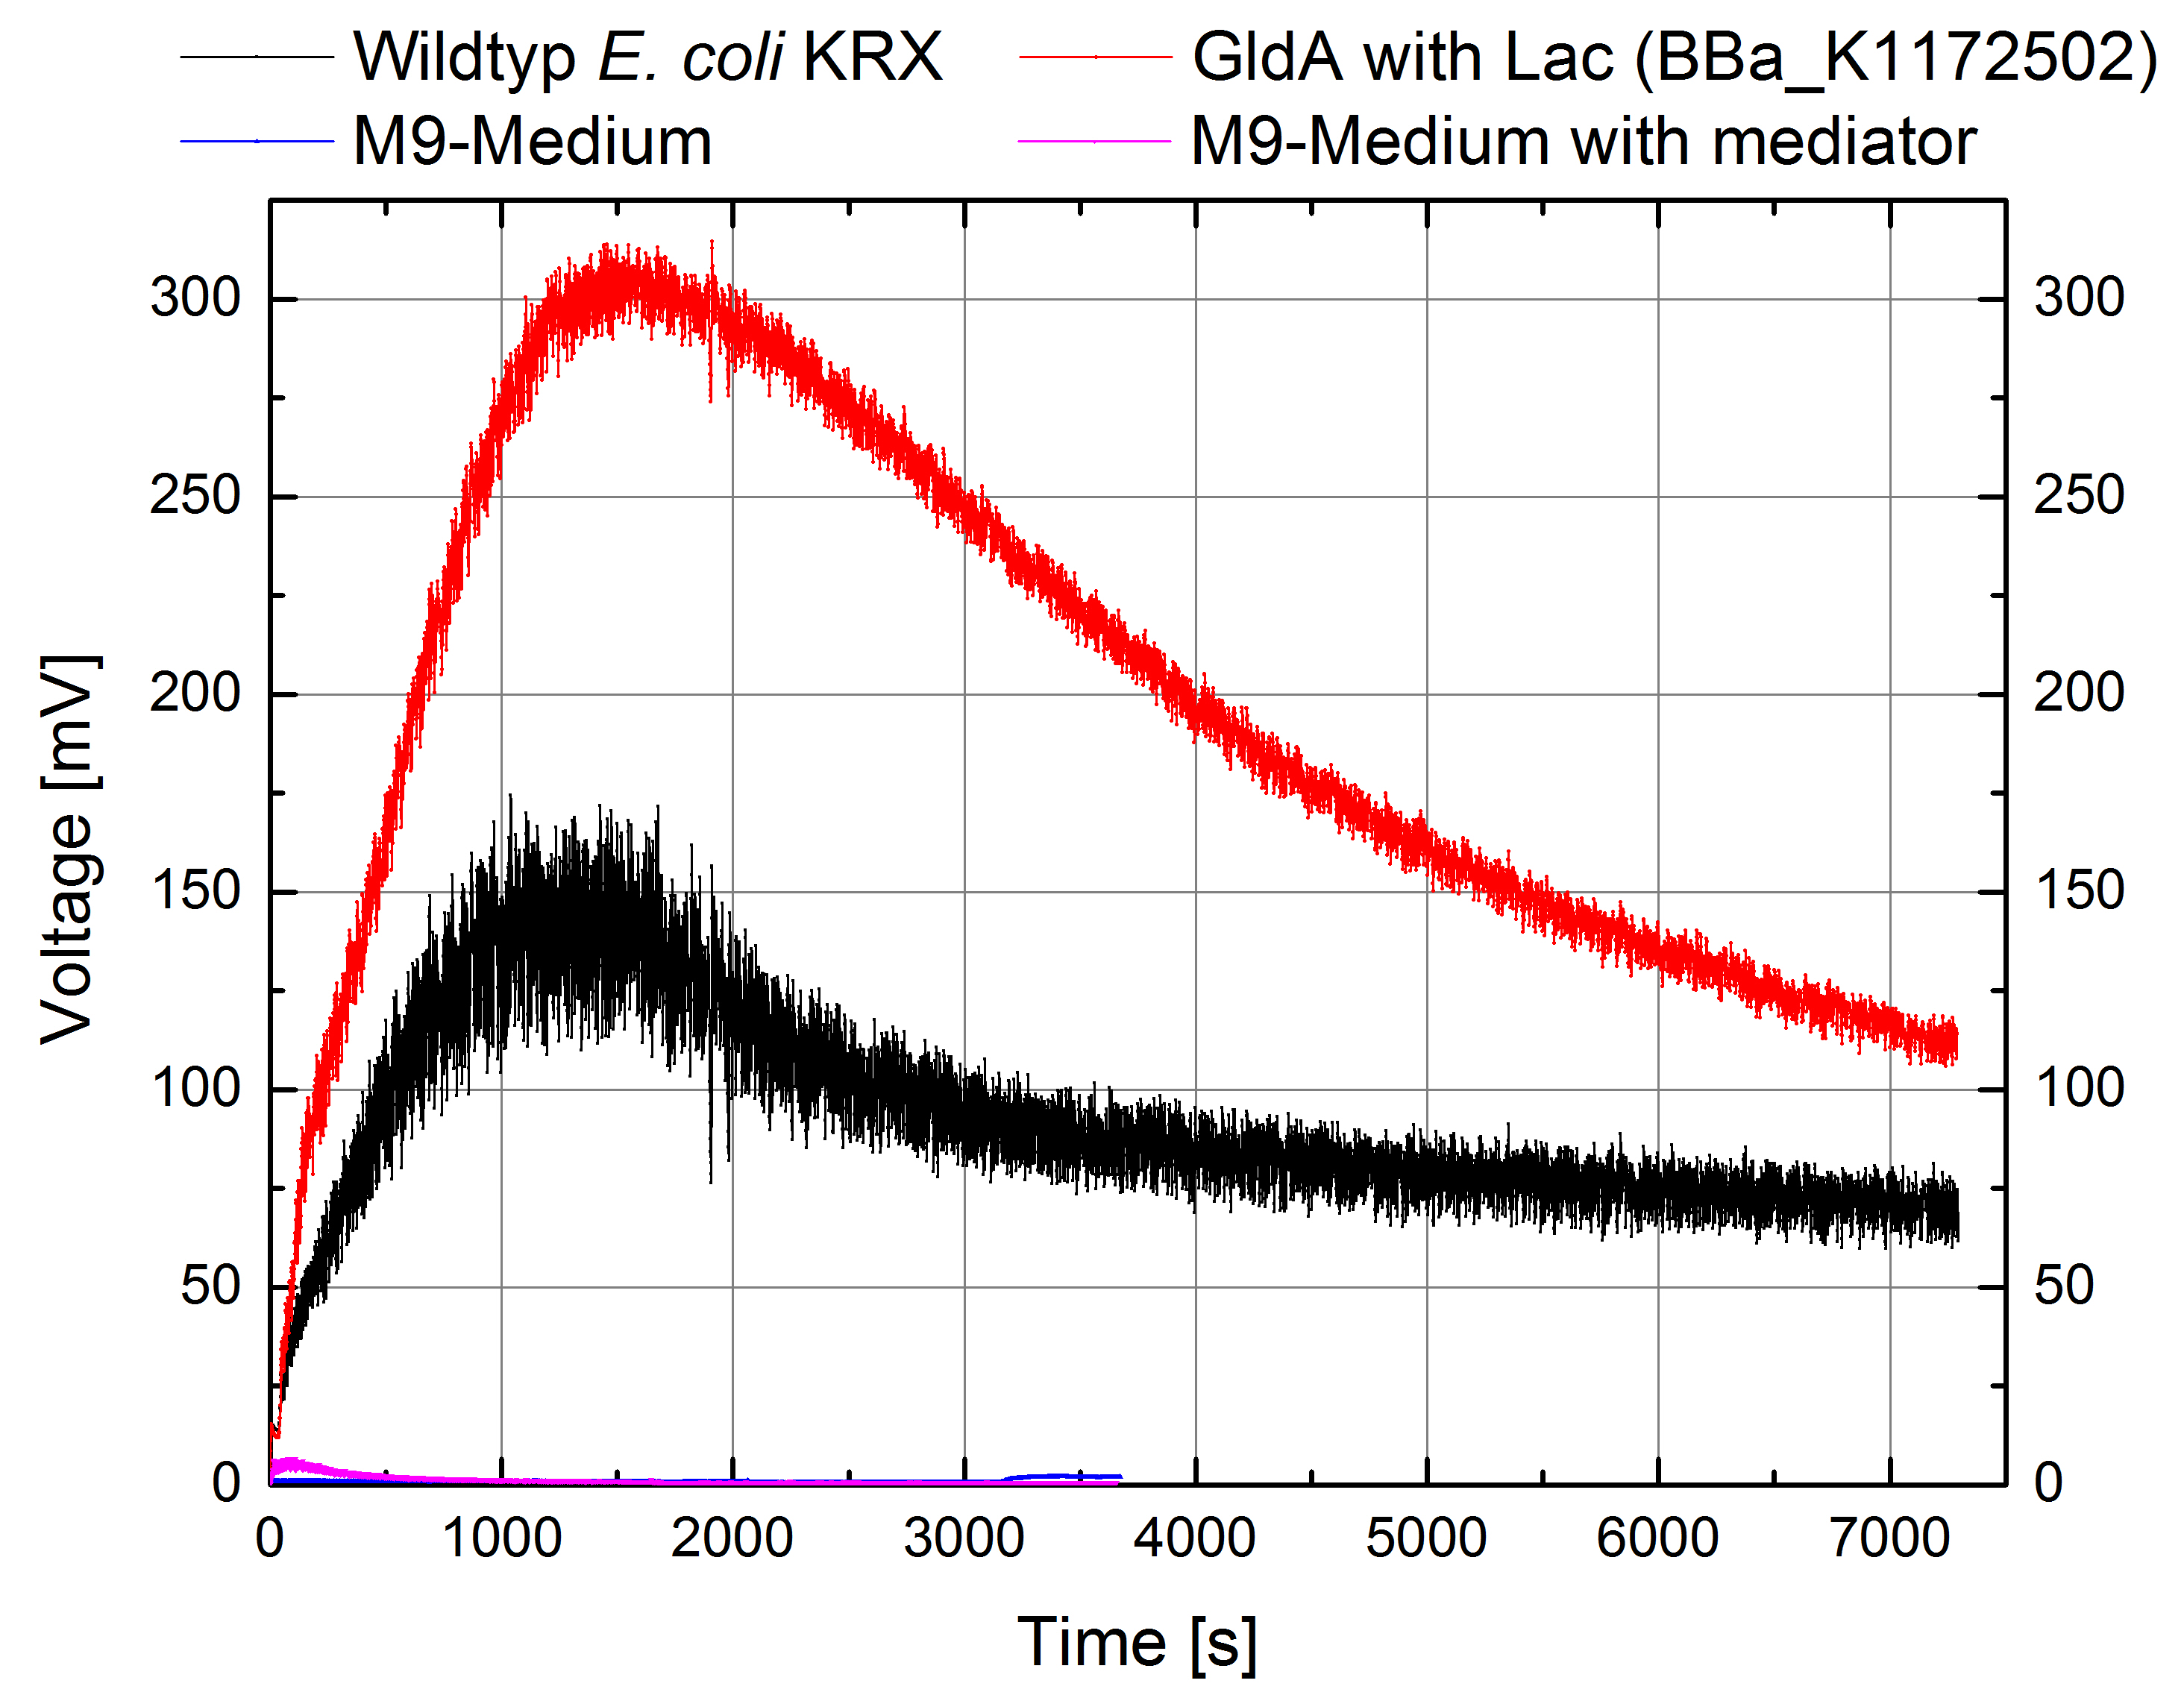
Figure 9: Microbial Fuel Cell results from cultivation of Escherichia coli KRX with oprF (<bbpart>BBa_K1172502</bbpart>) in contrast to Escherichia coli KRX wild type. Voltage curve from Escherichia coli KRX wild type, Escherichia coli KRX with oprF (<bbpart>BBa_K1172502</bbpart>), M9 medium with used mediator New Methylene Blue and M9 medium without mediator is shown over time.

Figure 10: Microbial Fuel Cell results from cultivation of Escherichia coli KRX with oprF (<bbpart>BBa_K1172502</bbpart>) in contrast to Escherichia coli KRX wild type. Electric charge curve from Escherichia coli KRX wild type and Escherichia coli KRX with oprF (<bbpart>BBa_K1172502</bbpart>). M9 medium was used with mediator New Methylene Blue.
- Escherichia coli KRX with oprF (<bbpart>BBa_K1172502</bbpart>) shows 100 % higher voltage and electric charge than E. coli wild type.
Week 23
Organization
- We have presented our project from 11-13 October at the European Jamboree in Lyon with great success!
- The jury has selected our project to the best overgraduate project in Europe. We are the grand prize winner. Furthermore we received the Award for the best presentation and of course we are advanced to the Championship at MIT in Boston! What a great weekend!
Week 24
Organization
- Starting with the final labwork in order to optimize our project for the World Championship at MIT in Boston from 1-4 November.
- We have published our [http://ekvv.uni-bielefeld.de/blog/uninews/entry/bielefeld_igem_team_wins_european second press release].
- We are planning a press conference at the 28th October at CeBiTec Bielefeld regarding our success at the European Jamboree in Lyon.
MFC
- Designed the threeplus generation of our fuel cell and ordered the respective plastic parts.
- Conducted experiments in the generation threeplus fuel cell using a reference electrode in the cathode chamber.
Mediators
- Glycerol dehydrogenase
In order to test the effect of the protein expression on the cell growth, growth curves were investigated.
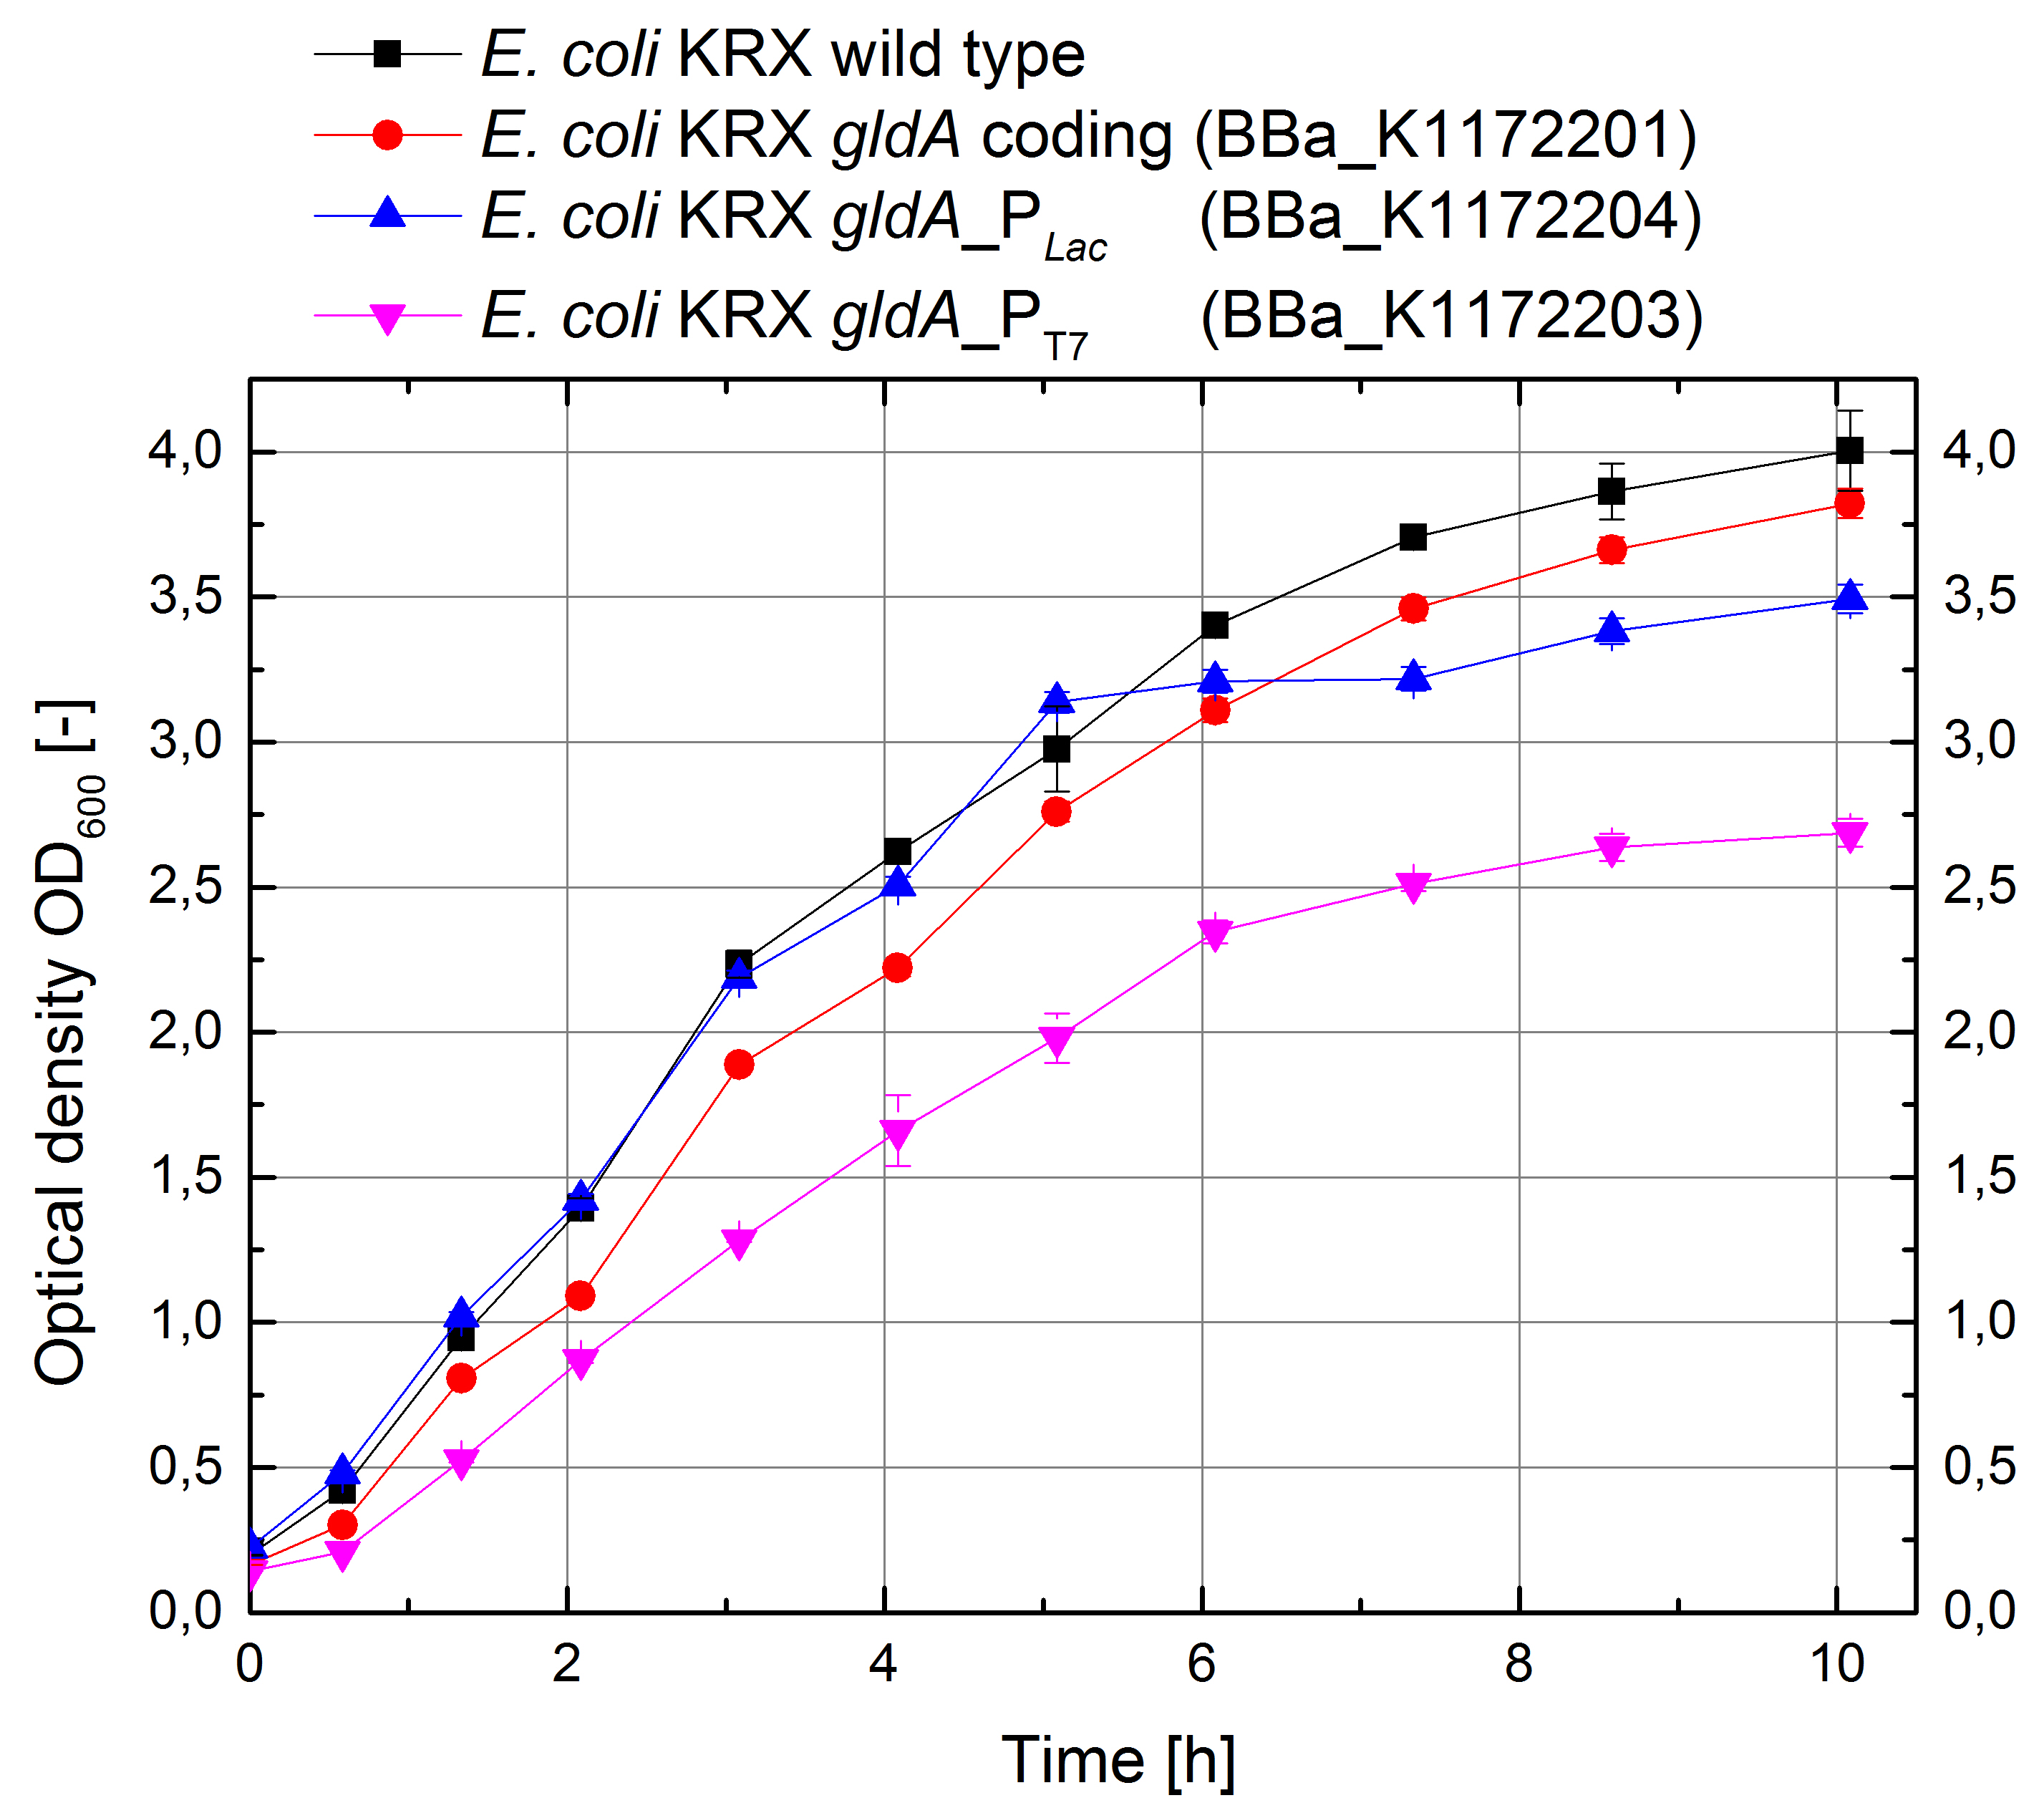
Figure 11: Growth curves for E. coli KRX with LB medium. Comparison between Escherichia coli KRX wild type and Escherichia coli KRX with <bbpart>BBa_K1172201</bbpart>, <bbpart>BBa_K1172203</bbpart> and <bbpart>BBa_K1172204</bbpart>. GldA gene expression was induced for inducable promoters at OD600 = 1,0. All data are representing two biological and two technical replicates with standard deviation.
- In order to investigate the high extracellular NADH concentration we are performing a LC-ESI MS/MS with the help of Markus Persicke.
Porines
In order to test the effect of the protein expression on the cell growth, growth curves were investigated.
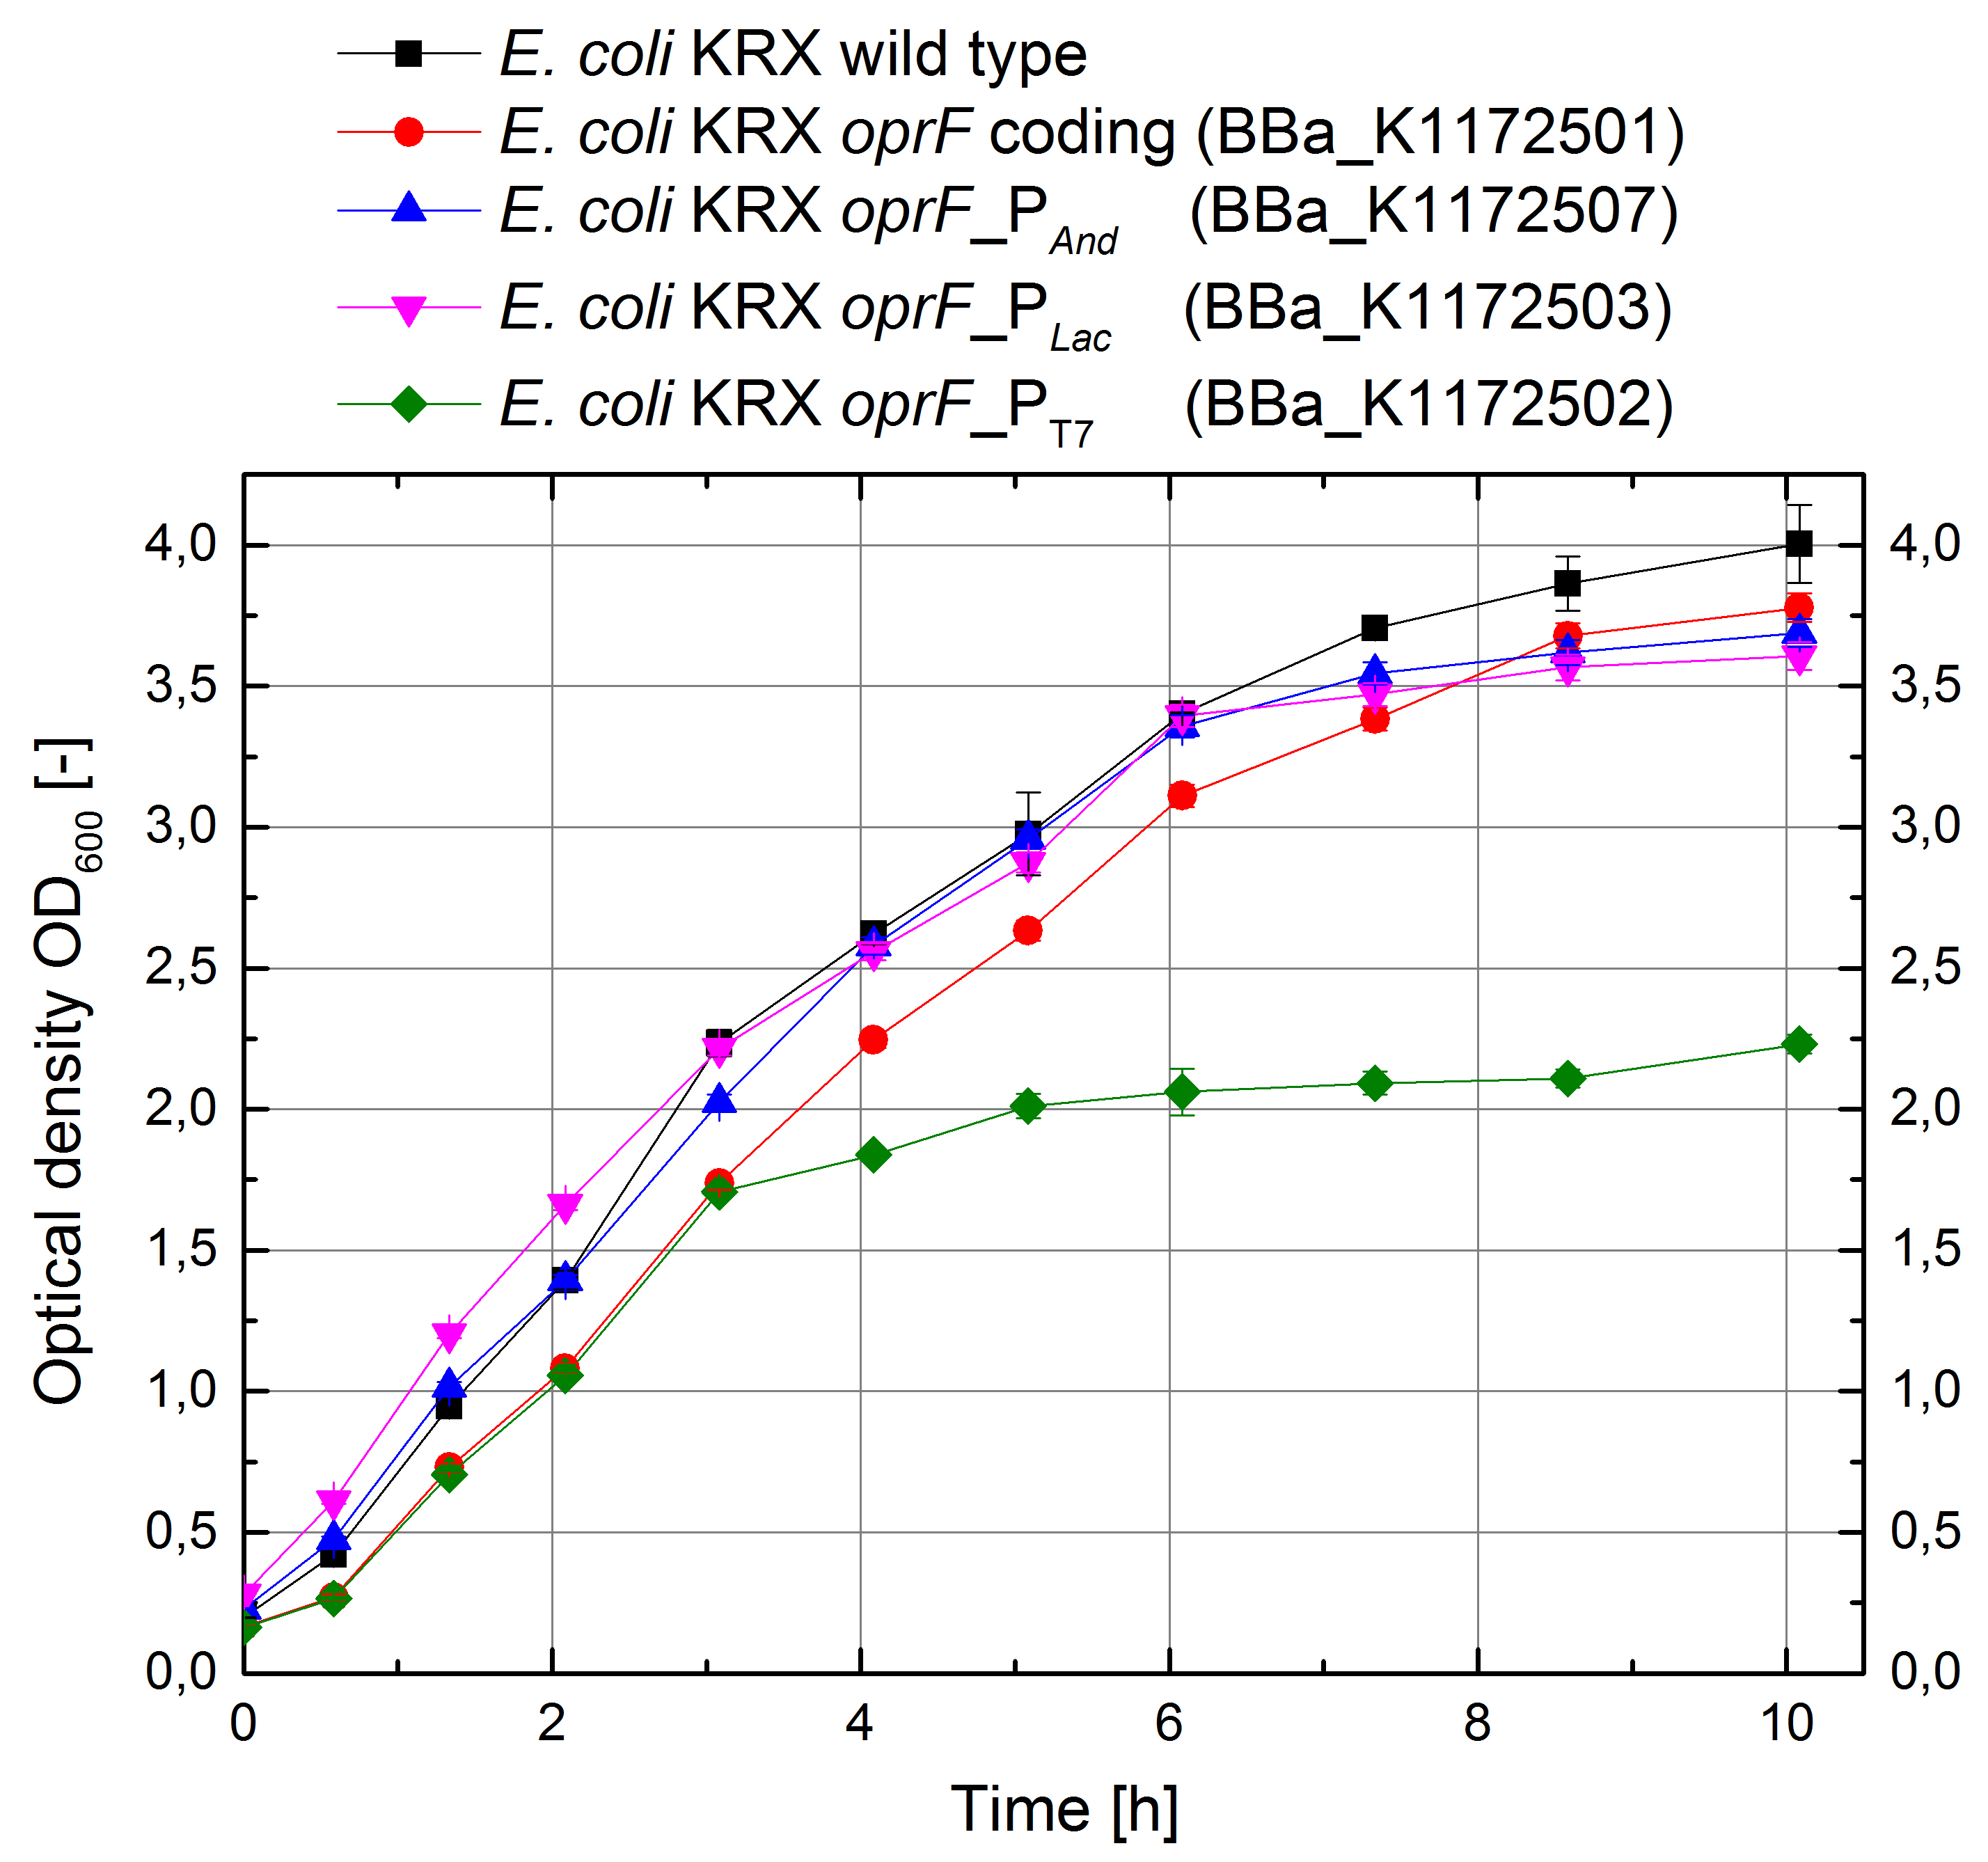
Figure 12: Growth curves for E. coli KRX with LB medium. Comparison between Escherichia coli KRX wild type and Escherichia coli KRX with OprF plasmids <bbpart>BBa_K1172501</bbpart>, <bbpart>BBa_K1172502</bbpart>, <bbpart>BBa_K1172503</bbpart> and <bbpart>BBa_K1172507</bbpart>. OprF gene expression was induced for inducable promoters at OD600 = 1,0. All data are representing two biological and two technical replicates with standard deviation.
Constructing Devices
- In order to combine the features of the outer membrane porin OprF <bbpart>BBa_K1172501</bbpart> with the production of the endogenous mediators riboflavin <bbpart>BBa_K1172303</bbpart> and NADH (through overexpression of GldA <bbpart>BBa_K1172201</bbpart>) we performed a Suffix Insertion. We also did this for oprF under the control of the T7 promoter <bbpart>BBa_K1172501</bbpart>.
- We verified the successful combination of our parts with a test restriction, using EcoR1 and Pst1.
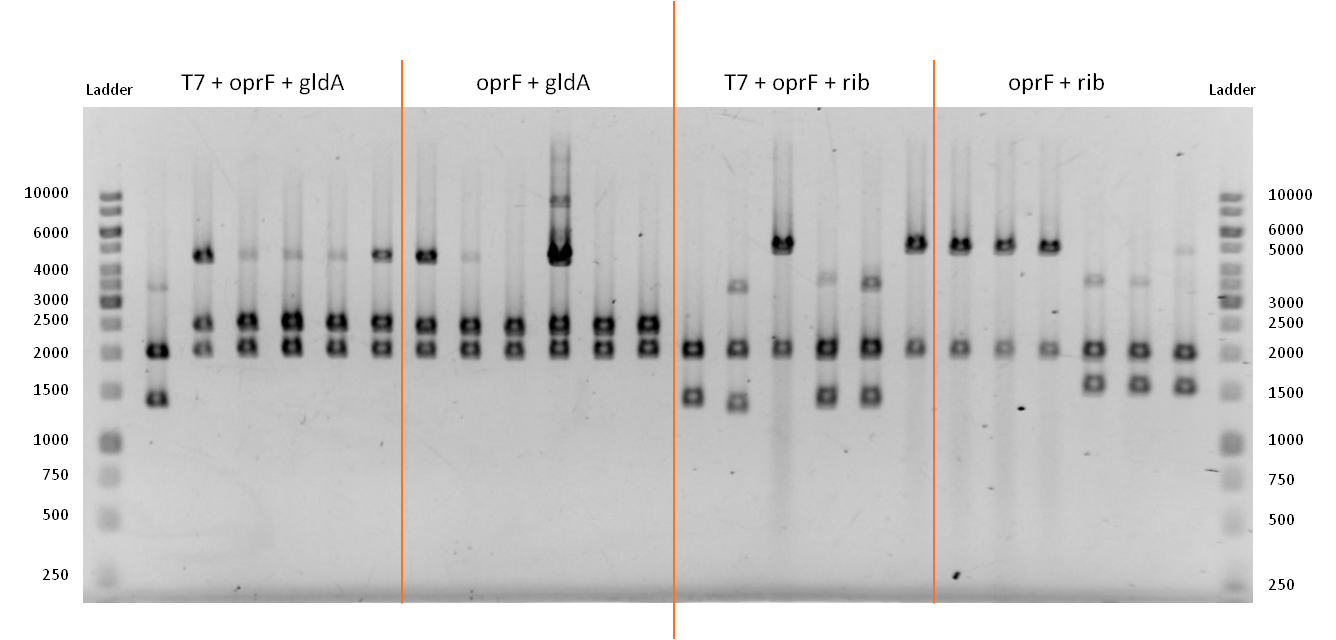
Figure 13: Test restriction of six plasmidisolations apiece for potential new devices. From left to right: Combination of OprF (<bbpart>BBa_K1172502</bbpart>) and GldA (<bbpart>BBa_K1172201</bbpart>) under control of T7 promoter. Combination of OprF (<bbpart>BBa_K1172501</bbpart>) and GldA (<bbpart>BBa_K1172201</bbpart>). Combination of OprF (<bbpart>BBa_K1172502</bbpart>) and Riboflavin synthesis gene cluster (<bbpart>BBa_K1172303</bbpart>) under control of T7 promoter. Combination of OprF (<bbpart>BBa_K1172501</bbpart>) and the Riboflavin synthesis gene cluster (<bbpart>BBa_K1172303</bbpart>). Ladder:Thermo Scientific GeneRuler™ 1 kb DNA Ladder
- The test restriction yielded positive results. The length of linear pSB1C3 after digestion is 2070 bp.
- A combination of the coding sequences from oprF (1298 bp) and gldA (1104 bp) results in a construct that is approx. 2400 bp long. When oprF is under control of the T7 promoter this length increases by 36 bp.
- From looking on the gel, we can tell that the bands in lines 3 - 7 and 8 - 13 are consistent with the anticipated results. The bands at about 4400 bp are due to non digested plasmids, since we apparently used not enough restriction enzyme or waited not long enough.
- A combination of the coding sequences from oprF (1298 bp) and the rib-gene-cluster (3597 bp) results in a construct that is approx. 4900 bp long. When oprF is under control of the T7 promoter this length increases by 36 bp.
- From looking on the gel, we can tell that the bands in lines 16 / 19 and 20 - 22 are consistent with the anticipated results.
- Subsequently we were successful in generating four new devices:
- Combination of the BioBricks <bbpart>BBa_K1172502</bbpart> and <bbpart>BBa_K1172201</bbpart> resulted in: <bbpart>BBa_K1172566</bbpart>.
- Combination of the BioBricks <bbpart>BBa_K1172501</bbpart> and <bbpart>BBa_K1172201</bbpart> resulted in: <bbpart>BBa_K1172577</bbpart>.
- Combination of the BioBricks <bbpart>BBa_K1172502</bbpart> and <bbpart>BBa_K1172303</bbpart> resulted in: <bbpart>BBa_K1172588</bbpart>.
- Combination of the BioBricks <bbpart>BBa_K1172501</bbpart> and <bbpart>BBa_K1172303</bbpart> resulted in: <bbpart>BBa_K1172599</bbpart>.
Week 25
Organization
- Press conference at the 28th October at CeBiTec Bielefeld regarding our success at European Jamboree in Lyon.
- TV contribution for TV station WDR.
- Wiki freeze is coming, starting with final work on our wiki.
 "
"

