Team:Warsaw/Notebook
From 2013.igem.org
(→Cell lab diary) |
(→AlamarBlue assay for HEK293) |
||
| Line 1,071: | Line 1,071: | ||
====16.08.2013-21.08.2013==== | ====16.08.2013-21.08.2013==== | ||
| + | |||
| + | {| class="wikitable" | ||
| + | !colspan="6"|% cell growth | ||
| + | |- | ||
| + | ! scope="col"| Time | ||
| + | ! scope="col" | 1mM | ||
| + | ! scope="col" | 2mM | ||
| + | ! scope="col" | 3mM | ||
| + | ! scope="col" | 4mM | ||
| + | ! scope="col" | 5mM | ||
| + | |- | ||
| + | |24h | ||
| + | |0,51 | ||
| + | |0,44 | ||
| + | |0,35 | ||
| + | |0,27 | ||
| + | |0,18 | ||
| + | |- | ||
| + | |48h | ||
| + | |0,62 | ||
| + | |0,31 | ||
| + | |0,25 | ||
| + | |0,15 | ||
| + | |0,12 | ||
| + | |- | ||
| + | |72h | ||
| + | |0,38 | ||
| + | |0,16 | ||
| + | |0,12 | ||
| + | |0,08 | ||
| + | |0,07 | ||
| + | |- | ||
| + | |96h | ||
| + | |0,125 | ||
| + | |0,086 | ||
| + | |0,075 | ||
| + | |0,069 | ||
| + | |0,066 | ||
| + | |- | ||
| + | |} | ||
| + | |||
| + | Graph summary: | ||
| + | |||
| + | [[File:HeLa29.09.2.png|frameless|border|caption|750px]] | ||
| + | [[File:HeLa29.09.3.png|frameless|border|caption|750px]] | ||
| + | |||
====18.08.2013-22.08.2013==== | ====18.08.2013-22.08.2013==== | ||
| + | |||
| + | {| class="wikitable" | ||
| + | !colspan="6"|% cell growth | ||
| + | |- | ||
| + | ! scope="col"| Time | ||
| + | ! scope="col" | 1mM | ||
| + | ! scope="col" | 2mM | ||
| + | ! scope="col" | 3mM | ||
| + | ! scope="col" | 4mM | ||
| + | ! scope="col" | 5mM | ||
| + | |- | ||
| + | |24h | ||
| + | |0,78 | ||
| + | |0,71 | ||
| + | |0,62 | ||
| + | |0,29 | ||
| + | |0,25 | ||
| + | |- | ||
| + | |48h | ||
| + | |0,53 | ||
| + | |0,33 | ||
| + | |0,17 | ||
| + | |0,12 | ||
| + | |0,1 | ||
| + | |- | ||
| + | |72h | ||
| + | |0,33 | ||
| + | |0,18 | ||
| + | |0,13 | ||
| + | |0,09 | ||
| + | |0,08 | ||
| + | |- | ||
| + | |96h | ||
| + | |0,09 | ||
| + | |0,06 | ||
| + | |0,05 | ||
| + | |0,048 | ||
| + | |0,047 | ||
| + | |- | ||
| + | |} | ||
| + | |||
====20.08.2013-25.08.2013==== | ====20.08.2013-25.08.2013==== | ||
| + | {| class="wikitable" | ||
| + | !colspan="6"|% cell growth | ||
| + | |- | ||
| + | ! scope="col"| Time | ||
| + | ! scope="col" | 1mM | ||
| + | ! scope="col" | 2mM | ||
| + | ! scope="col" | 3mM | ||
| + | ! scope="col" | 4mM | ||
| + | ! scope="col" | 5mM | ||
| + | |- | ||
| + | |24h | ||
| + | |0,81 | ||
| + | |0,69 | ||
| + | |0,38 | ||
| + | |0,36 | ||
| + | |0,21 | ||
| + | |- | ||
| + | |48h | ||
| + | |0,66 | ||
| + | |0,34 | ||
| + | |0,2 | ||
| + | |0,15 | ||
| + | |0,1 | ||
| + | |- | ||
| + | |72h | ||
| + | |0,29 | ||
| + | |0,15 | ||
| + | |0,09 | ||
| + | |0,075 | ||
| + | |0,063 | ||
| + | |- | ||
| + | |96h | ||
| + | |0,12 | ||
| + | |0,07 | ||
| + | |0,07 | ||
| + | |0,06 | ||
| + | |0,055 | ||
| + | |- | ||
| + | |} | ||
===AlamarBlue assay for 143b=== | ===AlamarBlue assay for 143b=== | ||
Revision as of 14:10, 30 September 2013
Notebook
Contents |
Cell lab diary
AlamarBlue assay for HeLA 1-5mM
10.08.2013-14.08.2013
Trial alamarBlue assay for HeLa
In order to obtain repeatable and reliable results of experiments we have decided to conduct trial assays to determine plating density and concentration of acrylamide. In order to examine how HeLa cell line would react to certain acrylamide concentrations we have implemented test assays providing 0,5mM, 1mM and 5mM concentrations. First of all we have harvested cells and prepared different densities: 2500, 5000, 7500 and 10000 of cells per well of 96-well plates. After adding alamarBlue to each well in amount of 1/10 of the culture volume we have measured fluorescence after an incubation period of 24 hours.
According to obtained results we have decided to use the density of 5000 cells per well. Secondly, we have conducted test assays with three different acrylamide concentration in order to establish the scope of our research. The initial results were as follows:
- 0,5mM an 1 mM concentration -> most of the cells are viable
- 5mM concentration -> most of the cells are dead
Taking the outcome into account we have decided to examine 1mM, 2mM, 3mM, 4mM and 5mM acrylamide concentrations for 24h, 48h, 72h, and 96h.
16.08.2013-21.08.2013
AlamarBlue assay- HeLa
Following the protocol we checked the cytotoxity of acrylamide for HeLa cells. We have decided to implement two different ways of incubating the cells: 1st adding cell suspention directly to certain acrylamide concentration 2nd adding cell suspention to the wells and incubating them for 24h at 37°C, then adding certain acrylamide concentration.
Below are the results of a measurement of absorbance for the plate with prior incubation:
| Measurement of fluorescence 2 | ||||||||||||
|---|---|---|---|---|---|---|---|---|---|---|---|---|
| Time | NC | 1mM | 2mM | 3mM | 4mM | 5mM | ||||||
| 24h | 7373758 | 8272076 | 7192444 | 7424543 | 6641569 | 5650021 | 4952094 | 5922398 | 5436664 | 5306241 | 3556654 | 4163111 |
| 7173972 | 6545080 | 7188951 | 6915072 | 6116307 | 6441105 | 5747208 | 4019806 | 5217586 | 5387212 | 4096686 | 3533518 | |
| 48h | 21498976 | 9060887 | 9766205 | 10285037 | 6448099 | 6495998 | 3563610 | 3727306 | 3257840 | 2889223 | 2154377 | 1595037 |
| 7589281 | 10161667 | 9724553 | 10407614 | 6814538 | 6072379 | 1263710 | 4840663 | 3767542 | 3464691 | 1186634 | 2151884 | |
| 72h | 10194118 | 11427411 | 10016065 | 8593429 | 4926555 | 4852670 | 2535034 | 4609394 | 1841320 | 1914045 | 870765 | 943721 |
| 9116994 | 10566937 | 8968114 | 10328330 | 5798232 | 4700243 | 2421617 | 2200734 | 1854485 | 1719428 | 995642 | 705623 | |
| 96h | 10551875 | 12256688 | 8642510 | 8263400 | 2534417 | 2322236 | 1096577 | 1883518 | 1711689 | 1695785 | 899049 | 806117 |
| 1645895 | 9714010 | 5134617 | 5176732 | 1108646 | 1045172 | 788164 | 1062518 | 1399573 | 1454092 | 853618 | 739065 | |
We have counted an average for each concentration and gained such results:
| Average of measurement | ||||||
|---|---|---|---|---|---|---|
| Time | NC | 1mM | 2mM | 3mM | 4mM | 5mM |
| 24h | 7341221,5 | 7180252,5 | 6212250,5 | 5160376,5 | 5336925,75 | 3837492,25 |
| 48h | 12077702,75 | 10045852,25 | 6457753,5 | 3348822,25 | 3344824 | 1771983 |
| 72h | 10326365 | 9476484,5 | 5069425 | 2941694,75 | 1832319,5 | 878937,75 |
| 96h | 8542117 | 6804314,75 | 1752617,75 | 1207694,25 | 1565284,75 | 824462,25 |
After that, we have counted % of cell growth by dividing an average for each time and concentration by appropriate average for the control. The results are shown here:
| % cell growth | |||||
|---|---|---|---|---|---|
| Time | 1mM | 2mM | 3mM | 4mM | 5mM |
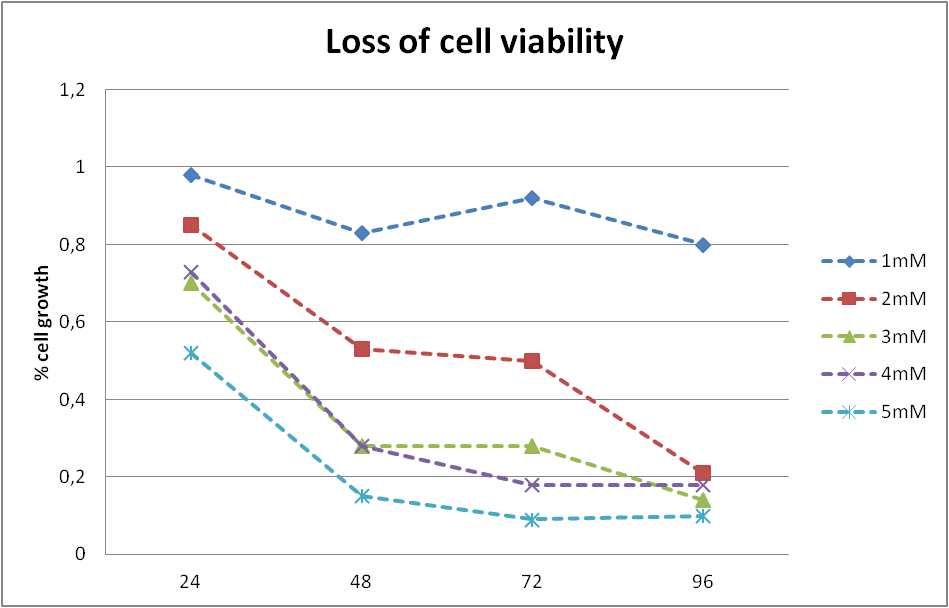
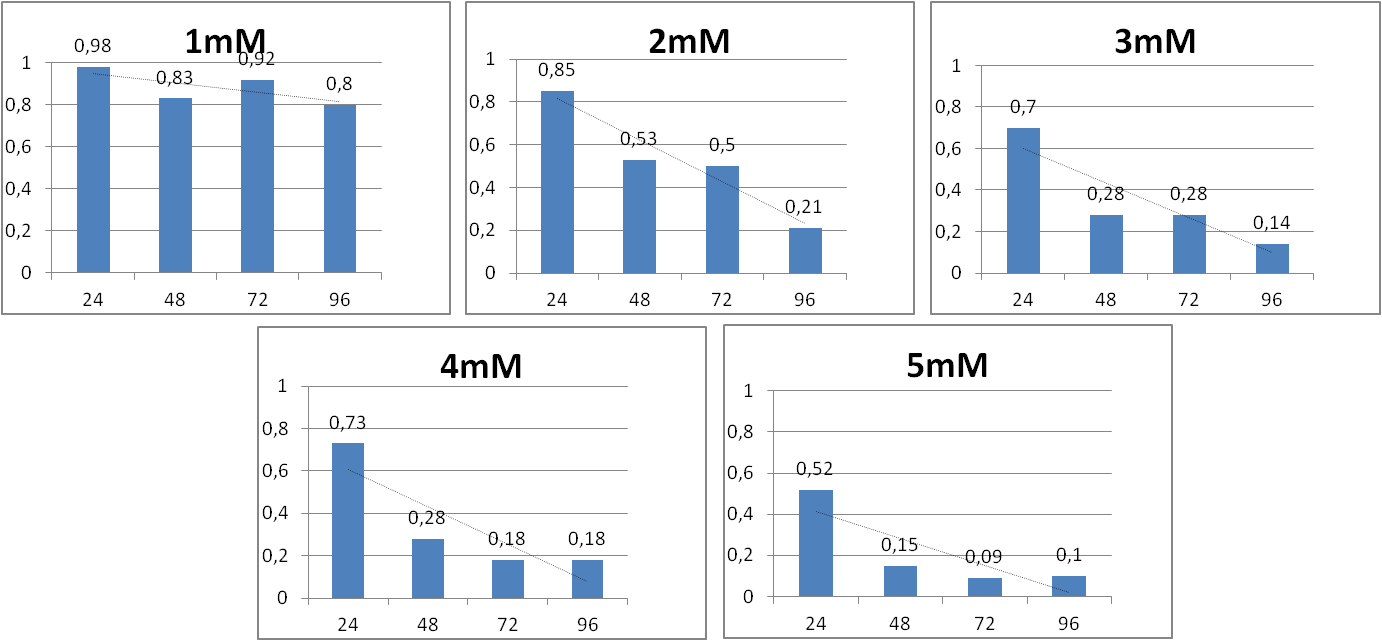
| 24h | 0,978073268 | 0,84621483 | 0,70293159 | 0,726980619 | 0,522732116 |
| 48h | 0,831768463 | 0,534683924 | 0,277273114 | 0,27694207 | 0,146715235 |
| 72h | 0,917697999 | 0,490920571 | 0,284872242 | 0,1774409 | 0,08511589 |
| 96h | 0,796560706 | 0,2051737 | 0,141381141 | 0,183243188 | 0,096517321 |
So the graphs serve as summary:
17.08.2013-22.08.2013
We have decided that the second type of measurement i.e. incubating cells for 24h at 37°C prior to addition of acrylamide will better reflect optimal conditions of cell growth. We have prepared two 96-well plates with 5000 cells per each well and incubated them for 24 hours. After this time we added acrylamide according to the protocol.
This are the results of measurements of absorbance:
| Measurement of fluorescence 2 | ||||||||||||
|---|---|---|---|---|---|---|---|---|---|---|---|---|
| Time | NC | 1mM | 2mM | 3mM | 4mM | 5mM | ||||||
| 24h | 6700039 | 7271548 | 6745967 | 6666035 | 5047406 | 3616931 | 4274714 | 4841184 | 4253892 | 3779748 | 4584429 | 3307109 |
| 6990006 | 7608869 | 7866854 | 7774202 | 6314529 | 6526844 | 4860078 | 5655352 | 3865177 | 4119912 | 4800916 | 3759563 | |
| 48h | 7459856 | 9994235 | 7075587 | 8043466 | 5643349 | 5769546 | 3223686 | 3660815 | 2360577 | 2224518 | 2110235 | 1911433 |
| 8919429 | 8981540 | 9176248 | 8222084 | 6474175 | 5325606 | 5477827 | 4653887 | 2967761 | 2360412 | 2903491 | 2080521 | |
| 72h | 11364152 | 10673740 | 10631207 | 10630185 | 5019728 | 4835926 | 2621560 | 2821185 | 2289734 | 2032174 | 1577851 | 1468166 |
| 10984789 | 9000710 | 10211232 | 9021874 | 3789425 | 4762485 | 3372217 | 2046689 | 1966275 | 1821163 | 1463407 | 1582042 | |
| 96h | 9979086 | 8726507 | 6938730 | 6794761 | 1608486 | 2085391 | 1177176 | 1057910 | 1101076 | 1330276 | 1329184 | 890891 |
| 6677357 | 10562095 | 3926716 | 4162655 | 1014022 | 1057574 | 1024019 | 1094089 | 1045779 | 1320753 | 1254068 | 1011347 | |
We have counted an average for each concentration and gained such results:
| Average of measurement | ||||||
|---|---|---|---|---|---|---|
| Time | NC | 1mM | 2mM | 3mM | 4mM | 5mM |
| 24h | 7142615,5 | 7263264,5 | 5376427,5 | 4907832 | 4004682,25 | 4113004,25 |
| 48h | 8838765 | 8129346,25 | 5803169 | 4254053,75 | 2478317 | 2251420 |
| 72h | 10505847,75 | 10123624,5 | 4601891 | 2715412,75 | 2027336,5 | 1522866,5 |
| 96h | 8986261,25 | 5455715,5 | 1441368,25 | 1088298,5 | 1199471 | 1121372,5 |
After that, we have counted % of cell growth by dividing an average for each time and concentration by appropriate average for the control. The results are shown here:
| % cell growth | |||||
|---|---|---|---|---|---|
| Time | 1mM | 2mM | 3mM | 4mM | 5mM |
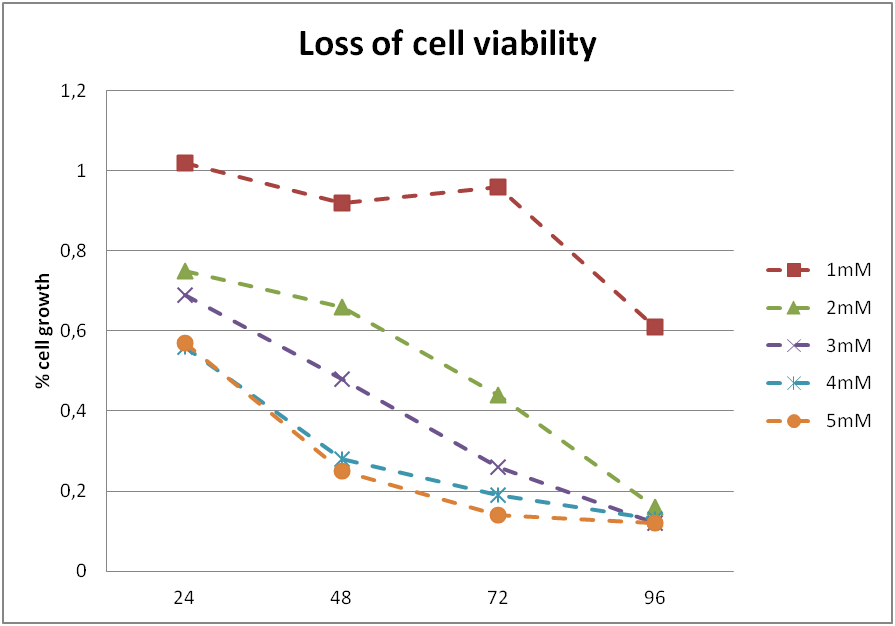
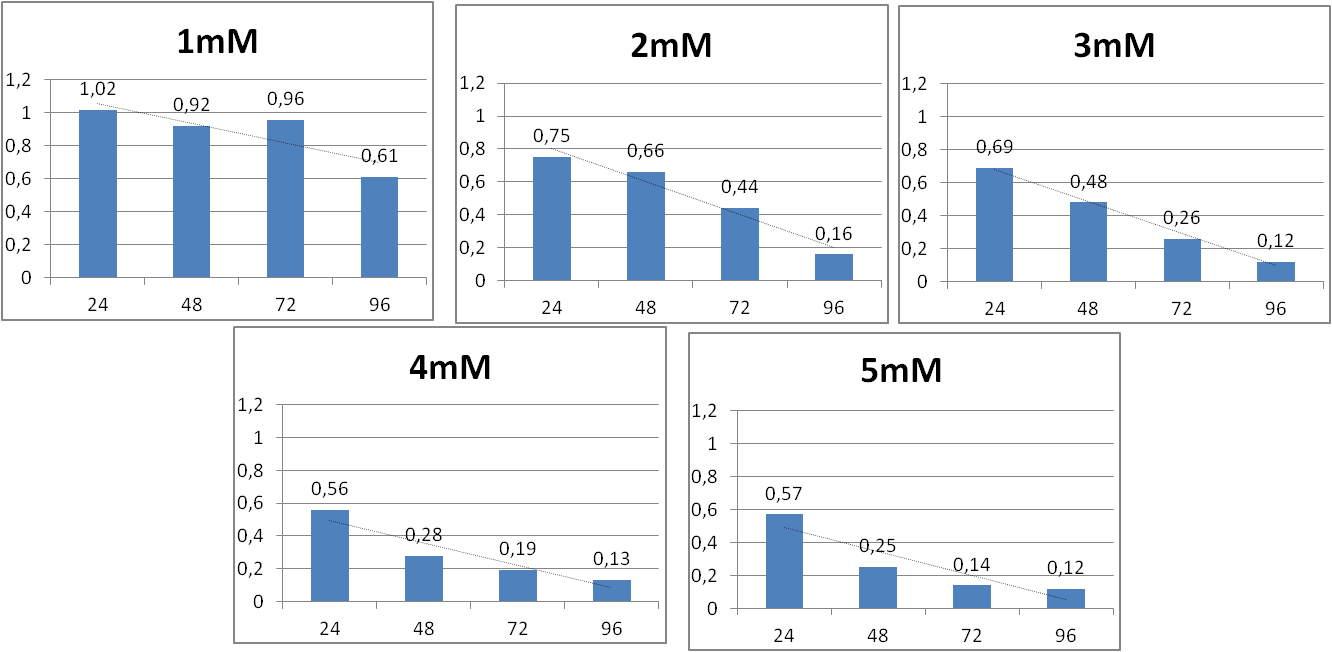
| 24h | 1,02 | 0,75 | 0,69 | 0,56 | 0,57 |
| 48h | 0,92 | 0,66 | 0,48 | 0,28 | 0,25 |
| 72h | 0,96 | 0,44 | 0,26 | 0,19 | 0,14 |
| 96h | 0,61 | 0,16 | 0,12 | 0,13 | 0,12 |
So the graphs serve as summary:
We have decided to conduct each experiment twice so here are the results from the second 96-well plate:
| Measurement of fluorescence 2b | ||||||||||||
|---|---|---|---|---|---|---|---|---|---|---|---|---|
| Time | NC | 1mM | 2mM | 3mM | 4mM | 5mM | ||||||
| 24h | 5689442 | 5477740 | 5369019 | 6121442 | 3874536 | 2893257 | 4184202 | 3790779 | 3042292 | 3374958 | 3285526 | 3225528 |
| 6372624 | 7876223 | 7325975 | 5727235 | 6427409 | 4842799 | 6249360 | 5321887 | 3410938 | 4275630 | 3259977 | 4842161 | |
| 48h | 10639247 | 8148331 | 8915964 | 10177195 | 4871060 | 5010788 | 4367575 | 4642340 | 3085628 | 2590736 | 3532060 | 2466736 |
| 10957449 | 10453297 | 11004473 | 8473231 | 5160946 | 4336928 | 4824239 | 4789970 | 2504349 | 2232280 | 3357123 | 2379384 | |
| 72h | 10283165
12000635 | 9635513 | 8880168 | 3811216 | 4058437 | 3236952 | 3193475 | 1630107 | 1478097 | 1569754 | 1804201 | |
| 10766834 | 11976578 | 10027043 | 9133051 | 4402895 | 4117753 | 3321155 | 2998722 | 1708259 | 2018056 | 1787657 | 1582990 | |
| 96h | 11739077 | 13027189 | 9808090 | 9472783 | 2524300 | 2334036 | 1189210 | 1055404 | 1300283 | 1628039 | 1353530 | 1310116 |
| 9625754 | 12521745 | 6479618 | 5128707 | 1327488 | 1099976 | 1015119 | 974386 | 1378368 | 1532597 | 1409938 | 1110367 | |
We have counted an average for each concentration and gained such results:
| Average of measurement | ||||||
|---|---|---|---|---|---|---|
| Time | NC | 1mM | 2mM | 3mM | 4mM | 5mM |
| 24h | 6354007,25 | 6135917,75 | 4509500,25 | 4886557 | 3525954,5 | 3653298 |
| 48h | 10049581 | 9642715,75 | 4844930,5 | 4656031 | 2603248,25 | 2933825,75 |
| 72h | 11256803 | 9418943,75 | 4097575,25 | 3187576 | 1708629,75 | 1686150,5 |
| 96h | 11728441,25 | 7722299,5 | 1821450 | 1058529,75 | 1459821,75 | 1295987,75 |
After that, we have counted % of cell growth by dividing an average for each time and concentration by appropriate average for the control experiment. The results are shown here:
| % cell growth | |||||
|---|---|---|---|---|---|
| Time | 1mM | 2mM | 3mM | 4mM | 5mM |
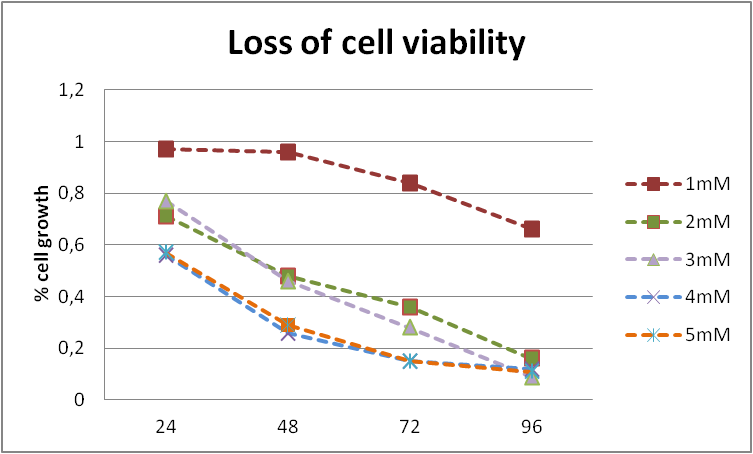
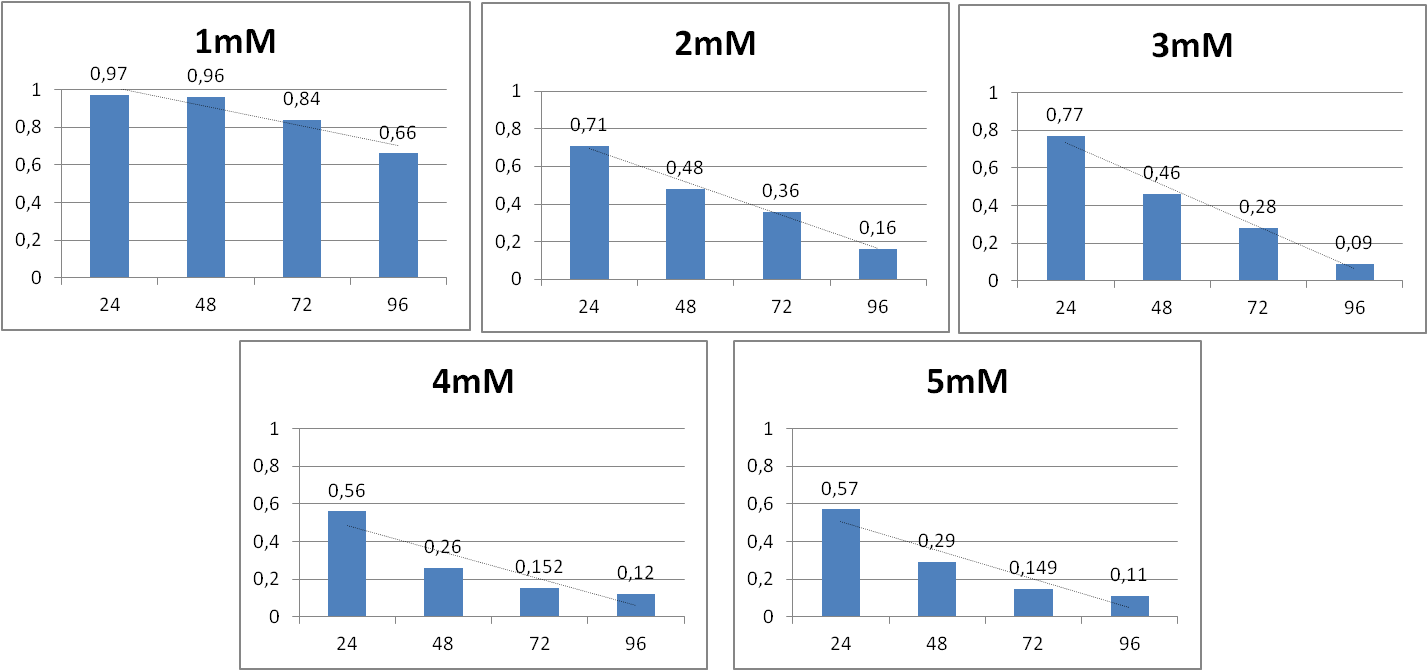
| 24h | 0,97 | 0,71 | 0,77 | 0,56 | 0,57 |
| 48h | 0,96 | 0,48 | 0,46 | 0,26 | 0,29 |
| 72h | 0,84 | 0,36 | 0,28 | 0,152 | 0,149 |
| 96h | 0,66 | 0,16 | 0,09 | 0,12 | 0,11 |
So the graphs serve as summary:
18.08.2013-23.08.2013
In order to confirm the results and state the receptiveness of the test, we have decided to repeat the experiments by testing another 96-well plates in identical conditions.
Those are the results of measurements of absorbance:
| Measurement of fluorescence 3 | ||||||||||||
|---|---|---|---|---|---|---|---|---|---|---|---|---|
| Time | NC | 1mM | 2mM | 3mM | 4mM | 5mM | ||||||
| 24h | 3974421 | 4463736 | 5292334 | 5060967 | 4153885 | 4370635 | 3999981 | 3517207 | 3499234 | 3388296 | 2859389 | 3571247 |
| 4797393 | 4989988 | 5183920 | 4850225 | 5442555 | 5379399 | 4915546 | 4741993 | 4079843 | 4189089 | 4221010 | 3436266 | |
| 48h | 6503529 | 6944856 | 5589520 | 7406073 | 4893204 | 4810250 | 3282289 | 3640323 | 2292748 | 2648757 | 2909252 | 1695347 |
| 8529450 | 5979922 | 7483886 | 7711638 | 4212594 | 5754700 | 4821335 | 3477507 | 1932753 | 2546461 | 2868302 | 1678374 | |
| 72h | 5854635 | 9116820 | 6242532 | 6355495 | 3973902 | 3911469 | 2009124 | 1970110 | 1083848 | 1332132 | 1259200 | 1059008 |
| 5723413 | 5283359 | 5546619 | 5835288 | 3271010 | 2082594 | 1639722 | 1978809 | 1191210 | 1191003 | 1302859 | 1025231 | |
| 96h | 8331318 | 9814058 | 7669153 | 7555556 | 1926251 | 1977639 | 1303301 | 1170557 | 1286656 | 1326686 | 1249020 | 1097188 |
| 4114415 | 16383780 | 5936493 | 5500369 | 1118274 | 1899821 | 1009362 | 998928 | 1154602 | 1238328 | 1197251 | 801340 | |
We have counted an average for each concentration and gained such results:
| Average of measurement | ||||||
|---|---|---|---|---|---|---|
| Time | NC | 1mM | 2mM | 3mM | 4mM | 5mM |
| 24h | 4556384,5 | 5096861,5 | 4836618,5 | 4293681,75 | 3789115,5 | 3521978 |
| 48h | 6989439,25 | 7047779,25 | 4917687 | 3805363,5 | 2355179,75 | 2287818,75 |
| 72h | 6494556,75 | 5994983,5 | 3309743,75 | 1899441,25 | 1199548,25 | 1161574,5 |
| 96h | 9660892,75 | 6665392,75 | 1730496,25 | 1120537 | 1251568 | 1086199,75 |
After that, we have counted % of cell growth by dividing an average for each time and concentration by appropriate average for the control experiment. The results are shown here:
| % cell growth | |||||
|---|---|---|---|---|---|
| Time | 1mM | 2mM | 3mM | 4mM | 5mM |
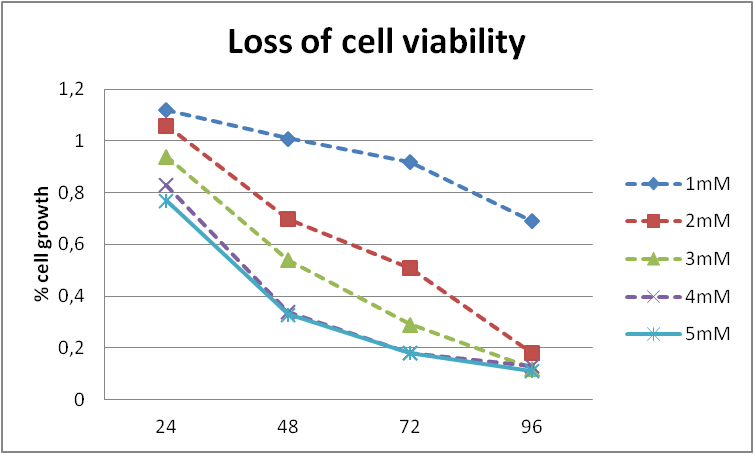
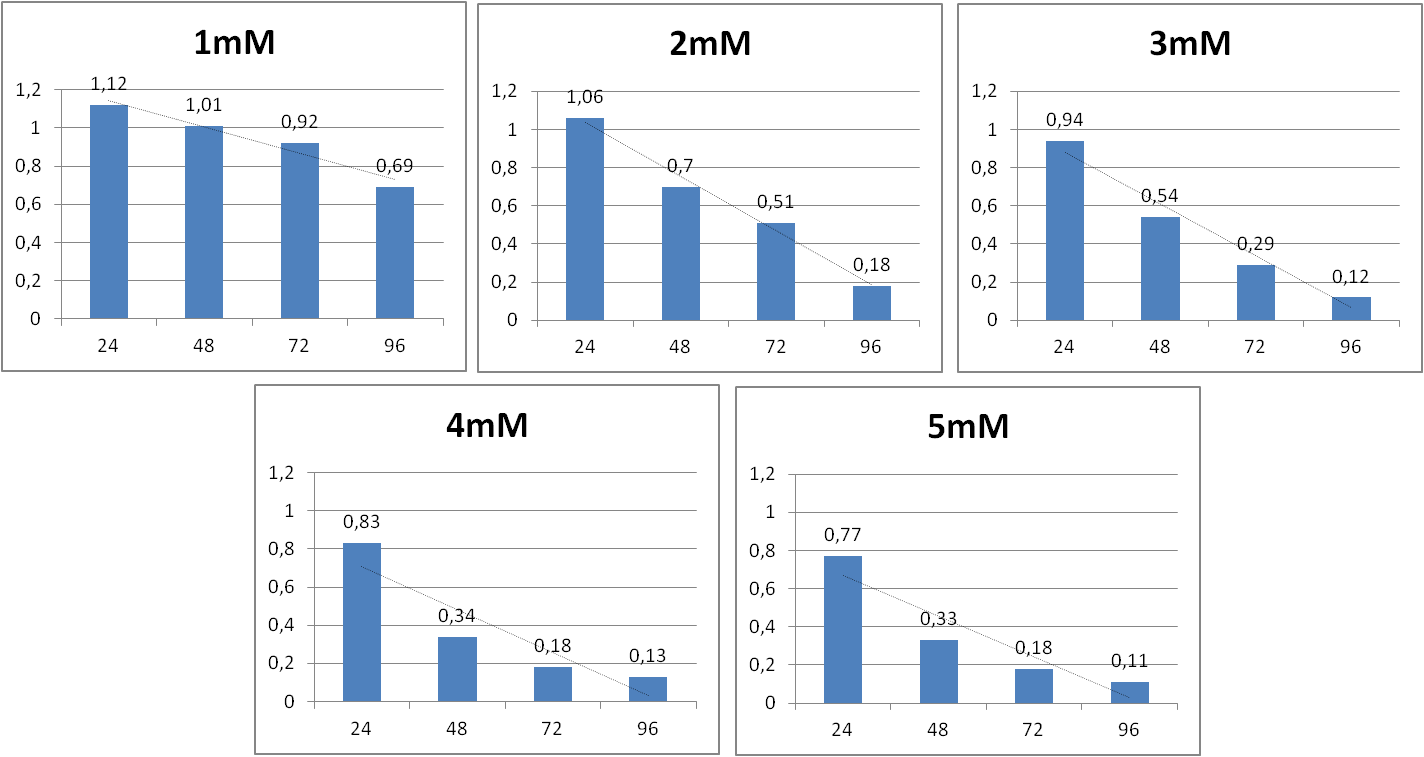
| 24h | 1,12 | 1,06 | 0,94 | 0,83 | 0,77 |
| 48h | 1,01 | 0,7 | 0,54 | 0,34 | 0,33 |
| 72h | 0,92 | 0,51 | 0,29 | 0,18 | 0,18 |
| 96h | 0,69 | 0,18 | 0,12 | 0,13 | 0,11 |
So the graphs serve as summary:
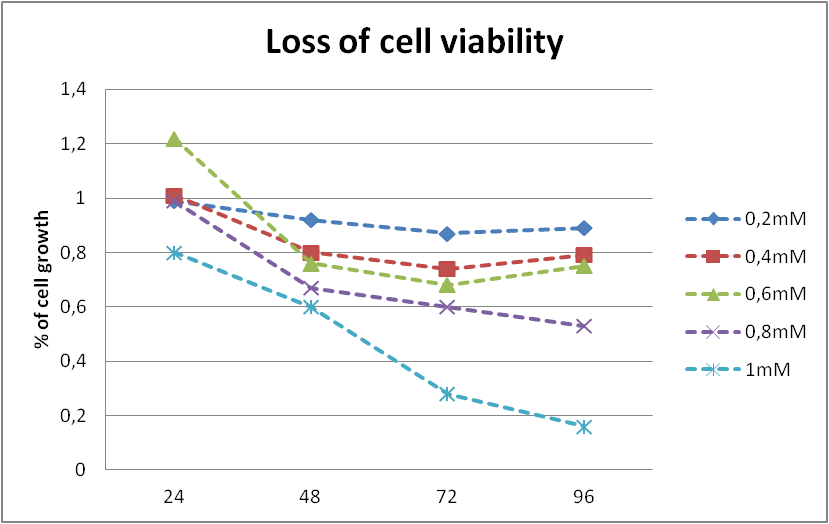
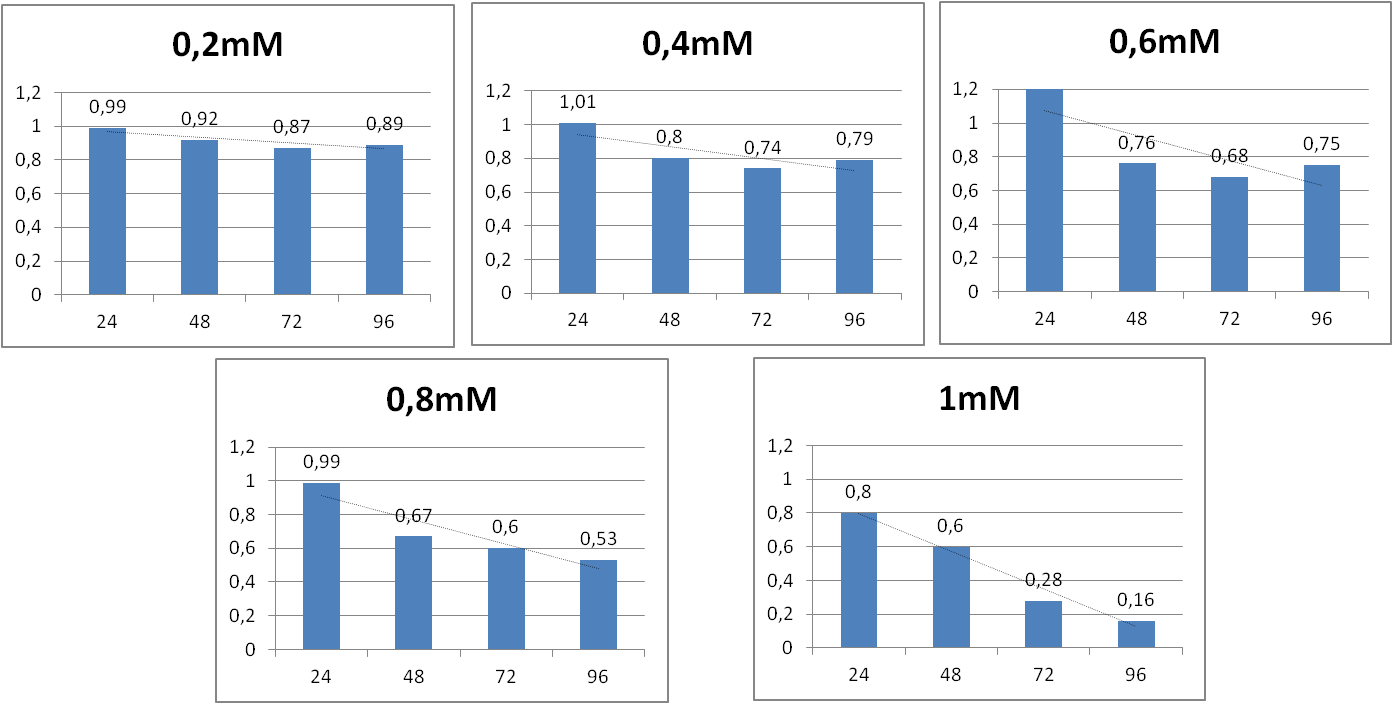
Alamar Blue assay for HeLa 0,2-1mM
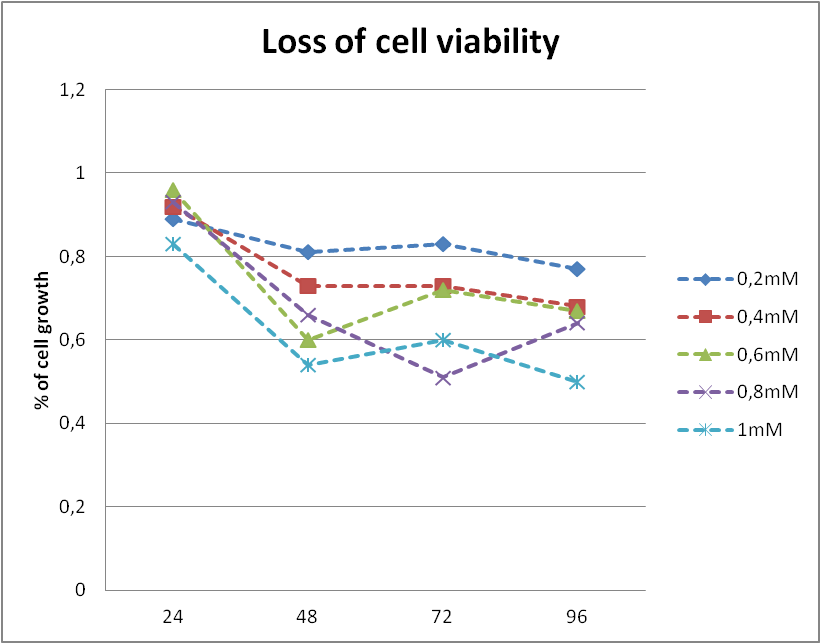
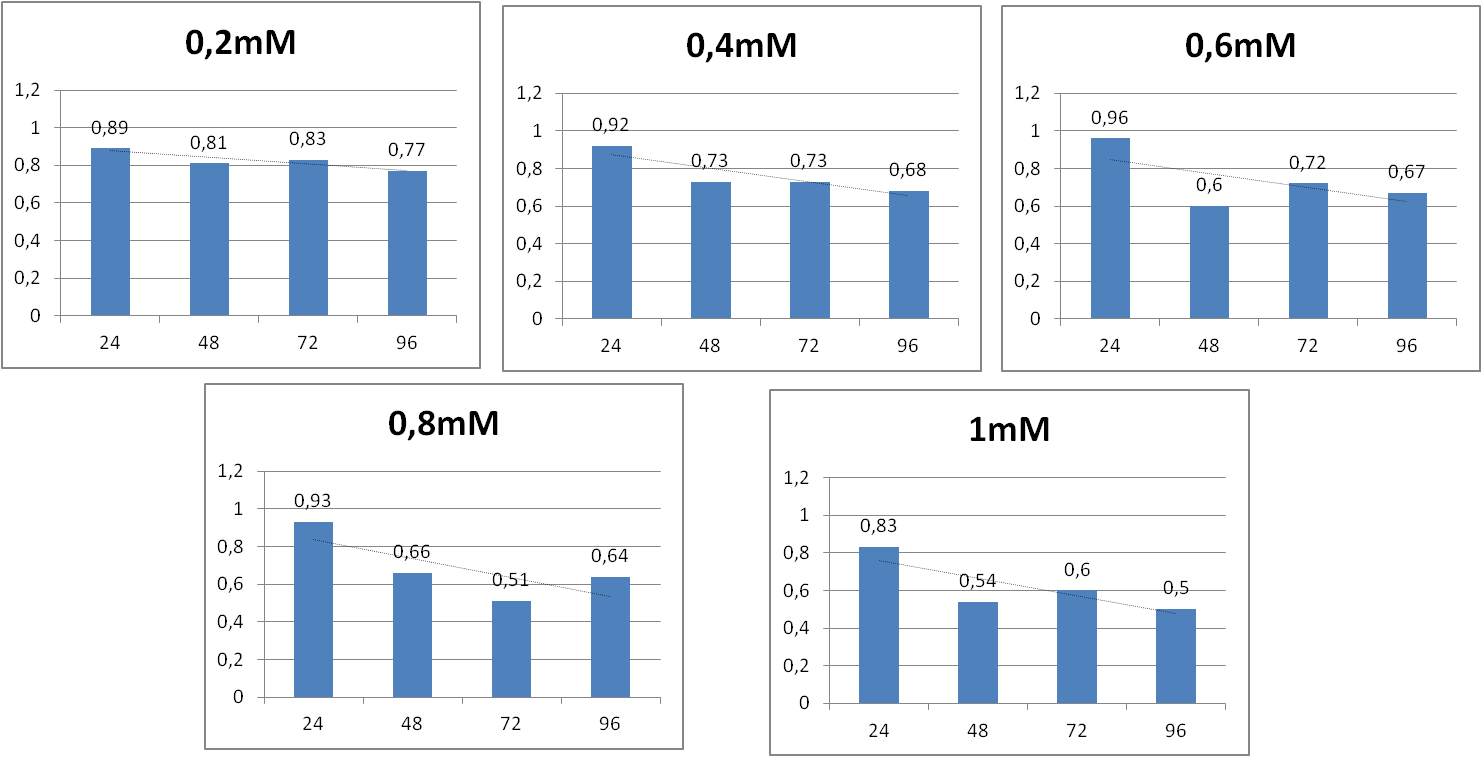
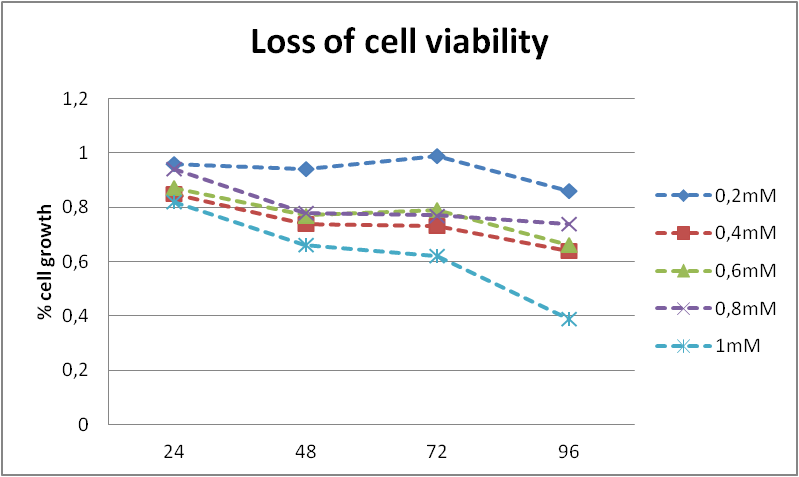
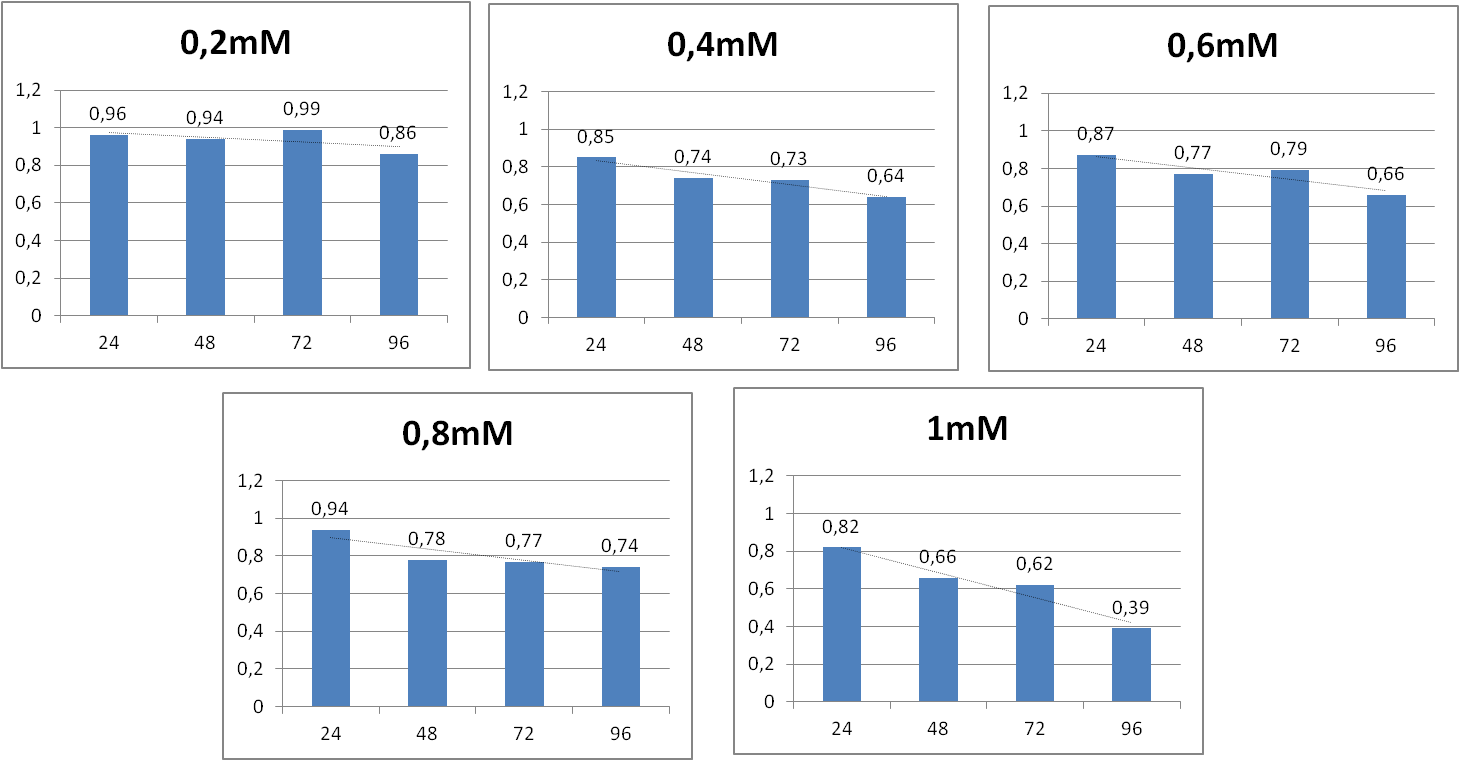
As in some probes we have observed growth of viability for lower acrylamide concentration, we decided to implement AlamarBlue assay also for 0,2 0,4 0,6 0,8 and 1mM concentrations. We have conducted the experiment for three times according to protocol and the results are as follows:
29.08.2013-03.09.2013
| % cell growth | |||||
|---|---|---|---|---|---|
| Time | 1mM | 2mM | 3mM | 4mM | 5mM |
| 24h | 0,89 | 0,92 | 0,96 | 0,93 | 0,83 |
| 48h | 0,81 | 0,73 | 0,6 | 0,66 | 0,54 |
| 72h | 0,83 | 0,73 | 0,72 | 0,51 | 0,6 |
| 96h | 0,77 | 0,68 | 0,67 | 0,64 | 0,5 |
Graph summary:
31.08.2013-05.09.2013
| % cell growth | |||||
|---|---|---|---|---|---|
| Time | 1mM | 2mM | 3mM | 4mM | 5mM |
| 24h | 0,96 | 0,85 | 0,87 | 0,94 | 0,82 |
| 48h | 0,94 | 0,74 | 0,77 | 0,78 | 0,66 |
| 72h | 0,99 | 0,73 | 0,79 | 0,77 | 0,62 |
| 96h | 0,86 | 0,64 | 0,66 | 0,74 | 0,39 |
Graph summary:
02.09.2013-07.09.2013
| % cell growth | |||||
|---|---|---|---|---|---|
| Time | 1mM | 2mM | 3mM | 4mM | 5mM |
| 24h | 0,99 | 1,01 | 1,22 | 0,99 | 0,8 |
| 48h | 0,92 | 0,8 | 0,76 | 0,67 | 0,6 |
| 72h | 0,87 | 0,74 | 0,68 | 0,6 | 0,28 |
| 96h | 0,89 | 0,79 | 0,75 | 0,53 | 0,16 |
Graph summary:
AlamarBlue assay for HEK293
In order to examine possible cytotoxic effect of acrylamide on kidney, we have conducted AlamarBlue assay for HEK293 cell line. Basing on the protocol obtained for HeLa cell line and after conducting trial assays, we have decided to incubate cells for 24h at 37°C prior to addition of acrylamide. We have prepared two 96-well plates with 5000 cells per each well for three times. We have measured the cytotoxity of higher acrylamide concentrations i.e. 1-5mM as well as lower: 0,2-1mM.
16.08.2013-21.08.2013
| % cell growth | |||||
|---|---|---|---|---|---|
| Time | 1mM | 2mM | 3mM | 4mM | 5mM |
| 24h | 0,51 | 0,44 | 0,35 | 0,27 | 0,18 |
| 48h | 0,62 | 0,31 | 0,25 | 0,15 | 0,12 |
| 72h | 0,38 | 0,16 | 0,12 | 0,08 | 0,07 |
| 96h | 0,125 | 0,086 | 0,075 | 0,069 | 0,066 |
Graph summary:
18.08.2013-22.08.2013
| % cell growth | |||||
|---|---|---|---|---|---|
| Time | 1mM | 2mM | 3mM | 4mM | 5mM |
| 24h | 0,78 | 0,71 | 0,62 | 0,29 | 0,25 |
| 48h | 0,53 | 0,33 | 0,17 | 0,12 | 0,1 |
| 72h | 0,33 | 0,18 | 0,13 | 0,09 | 0,08 |
| 96h | 0,09 | 0,06 | 0,05 | 0,048 | 0,047 |
20.08.2013-25.08.2013
| % cell growth | |||||
|---|---|---|---|---|---|
| Time | 1mM | 2mM | 3mM | 4mM | 5mM |
| 24h | 0,81 | 0,69 | 0,38 | 0,36 | 0,21 |
| 48h | 0,66 | 0,34 | 0,2 | 0,15 | 0,1 |
| 72h | 0,29 | 0,15 | 0,09 | 0,075 | 0,063 |
| 96h | 0,12 | 0,07 | 0,07 | 0,06 | 0,055 |
AlamarBlue assay for 143b
In order to examine possible cytotoxic effect of acrylamide on bone tissue, we have conducted AlamarBlue assay for 143b cell line. Basing on the protocol obtained for HeLa cell line and after conducting trial assays, we have decided to incubate cells for 24h at 37°C prior to addition of acrylamide. We have prepared two 96-well plates with 5000 cells per each well for three times. We have measured the cytotoxity of higher acrylamide concentrations i.e. 1-5mM as well as lower: 0,2-1mM.
Here we would like to present the outcomes of our experiment.
24.08.2013-29.08.2013
26.08.2013-31.08.2013
28.08.2013-03.09.2013
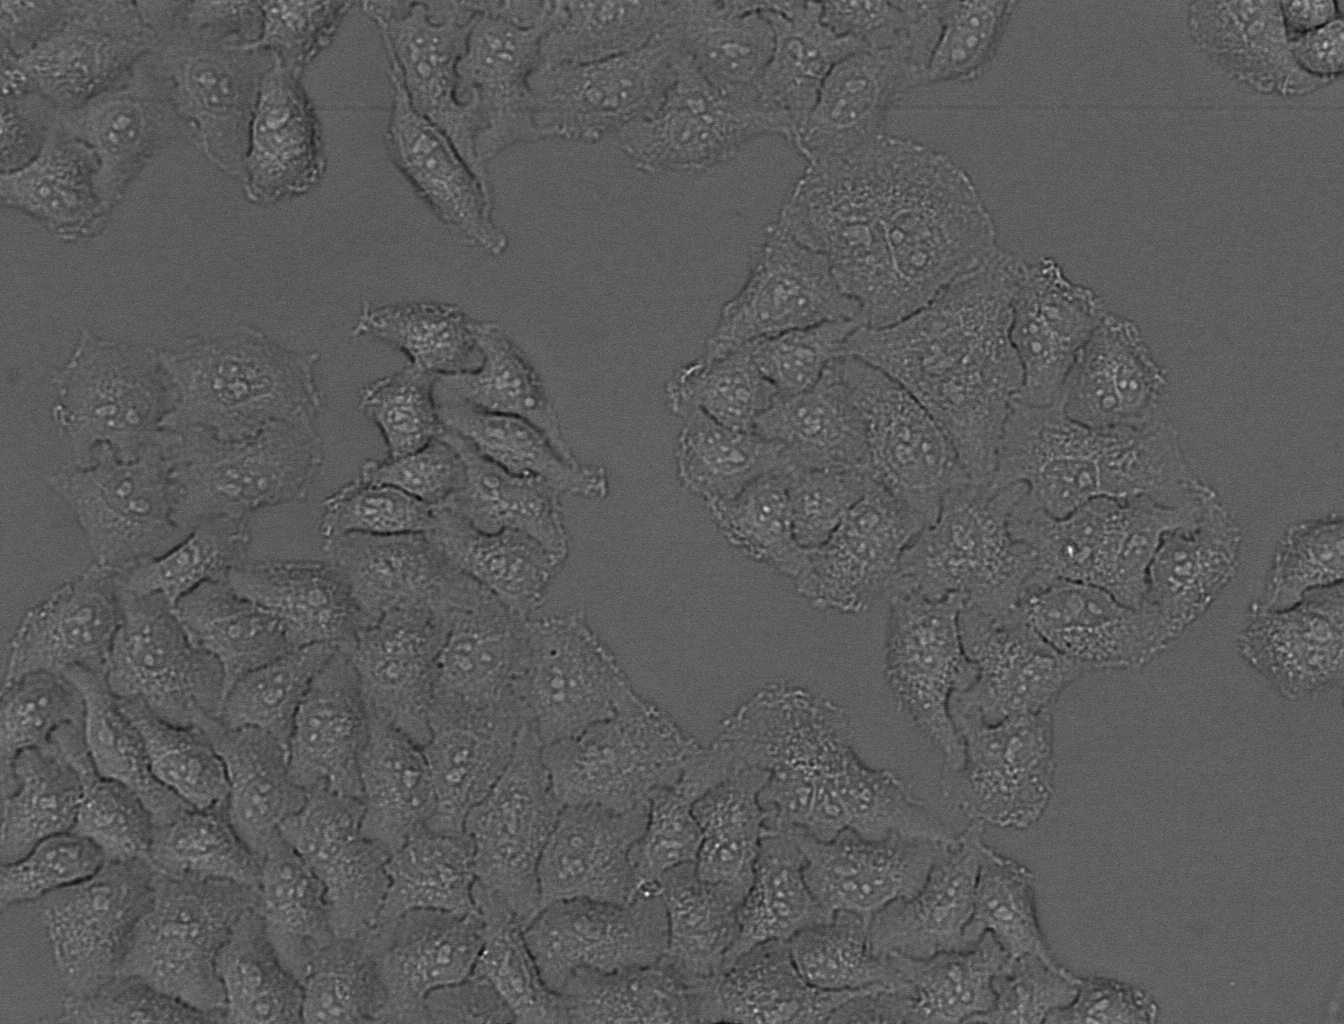
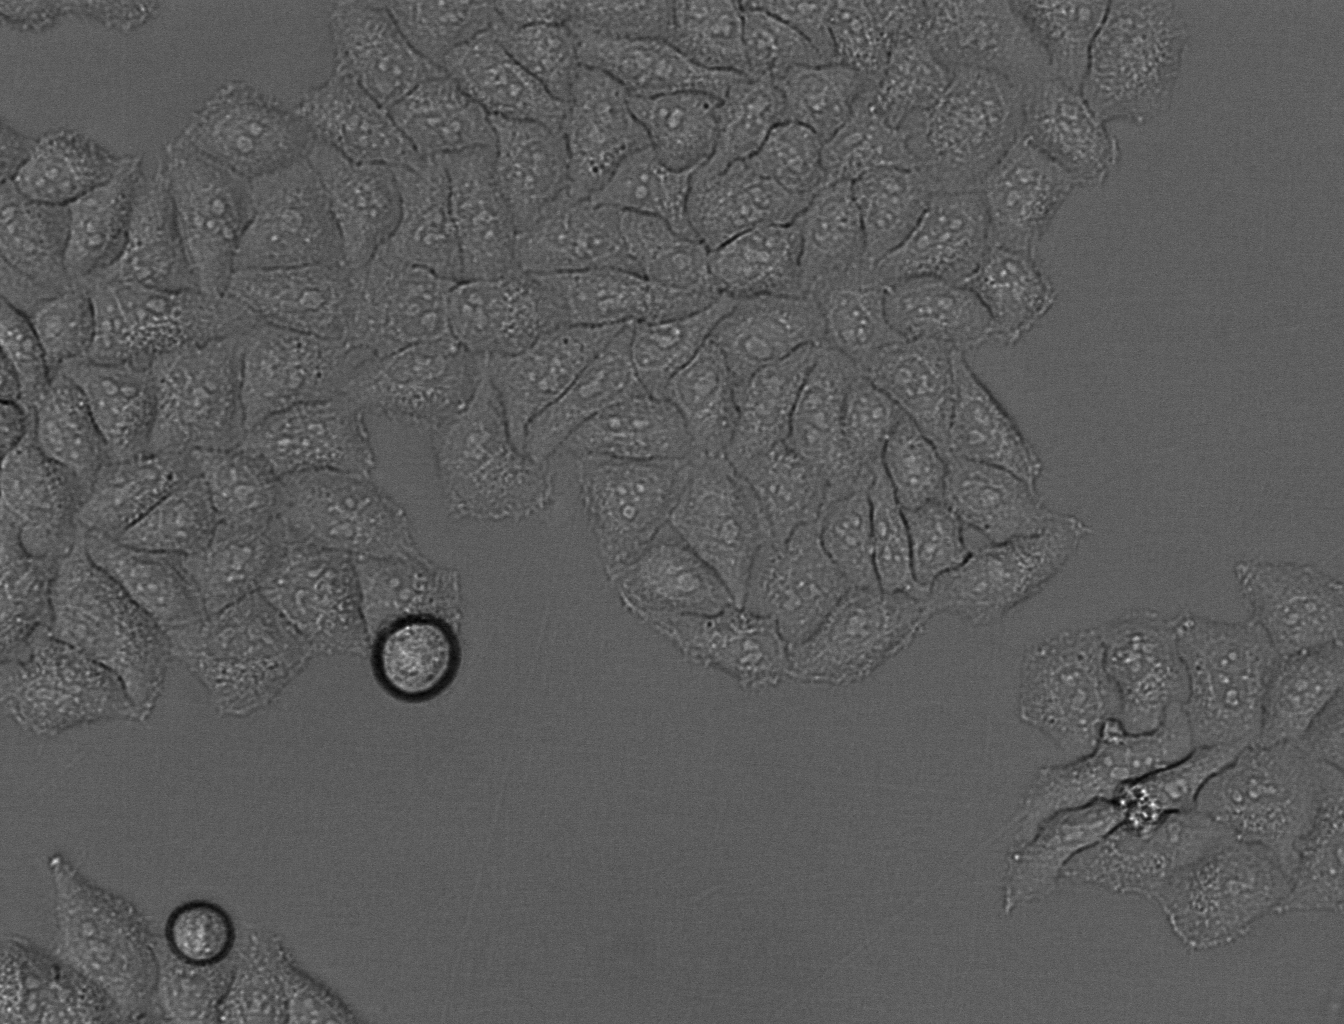
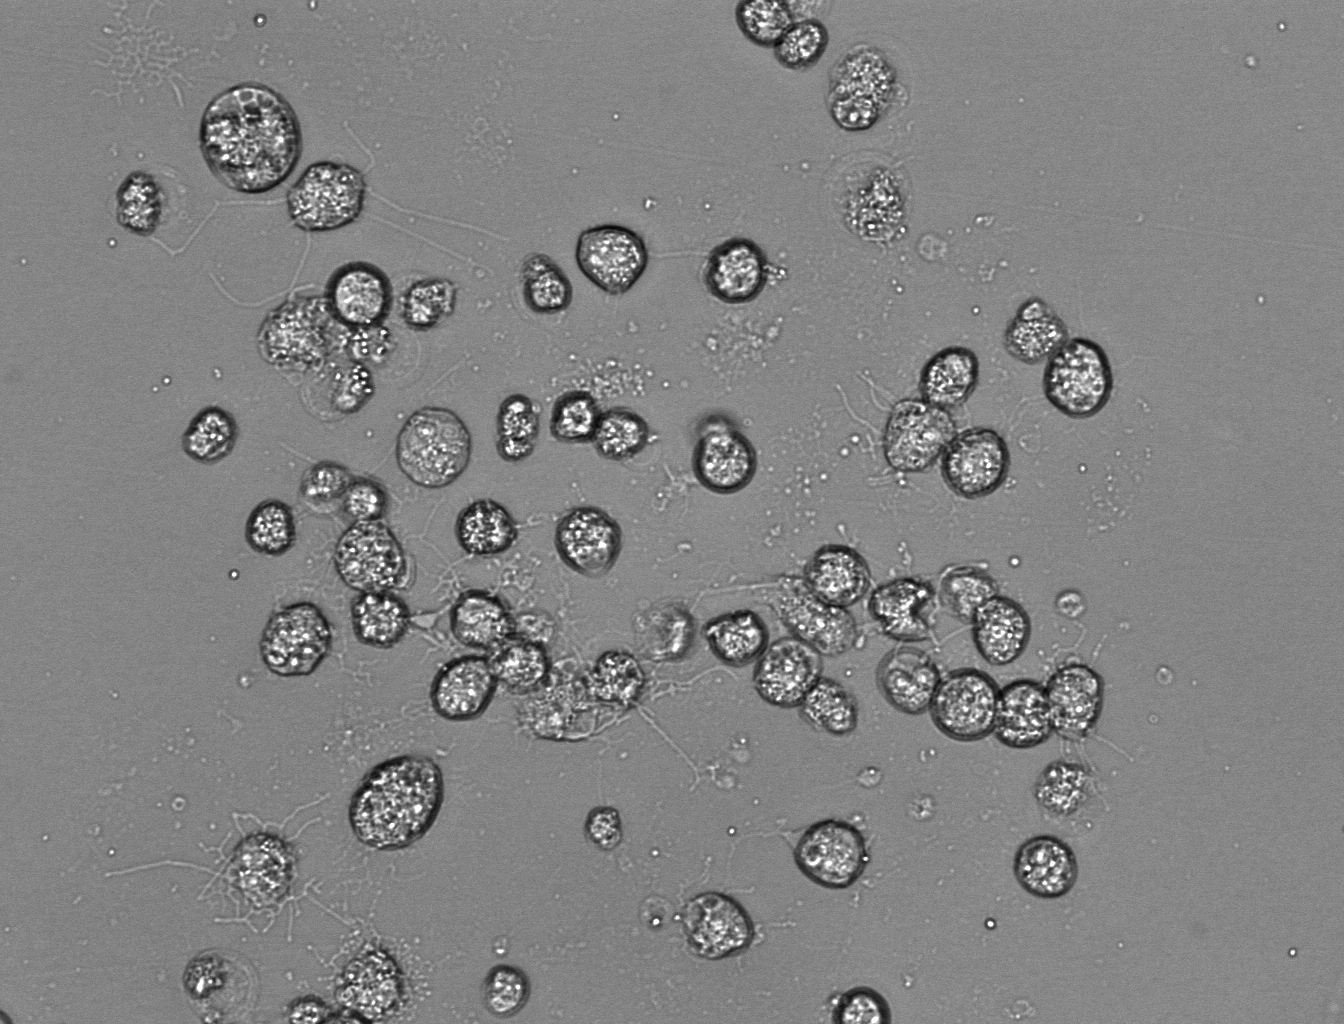
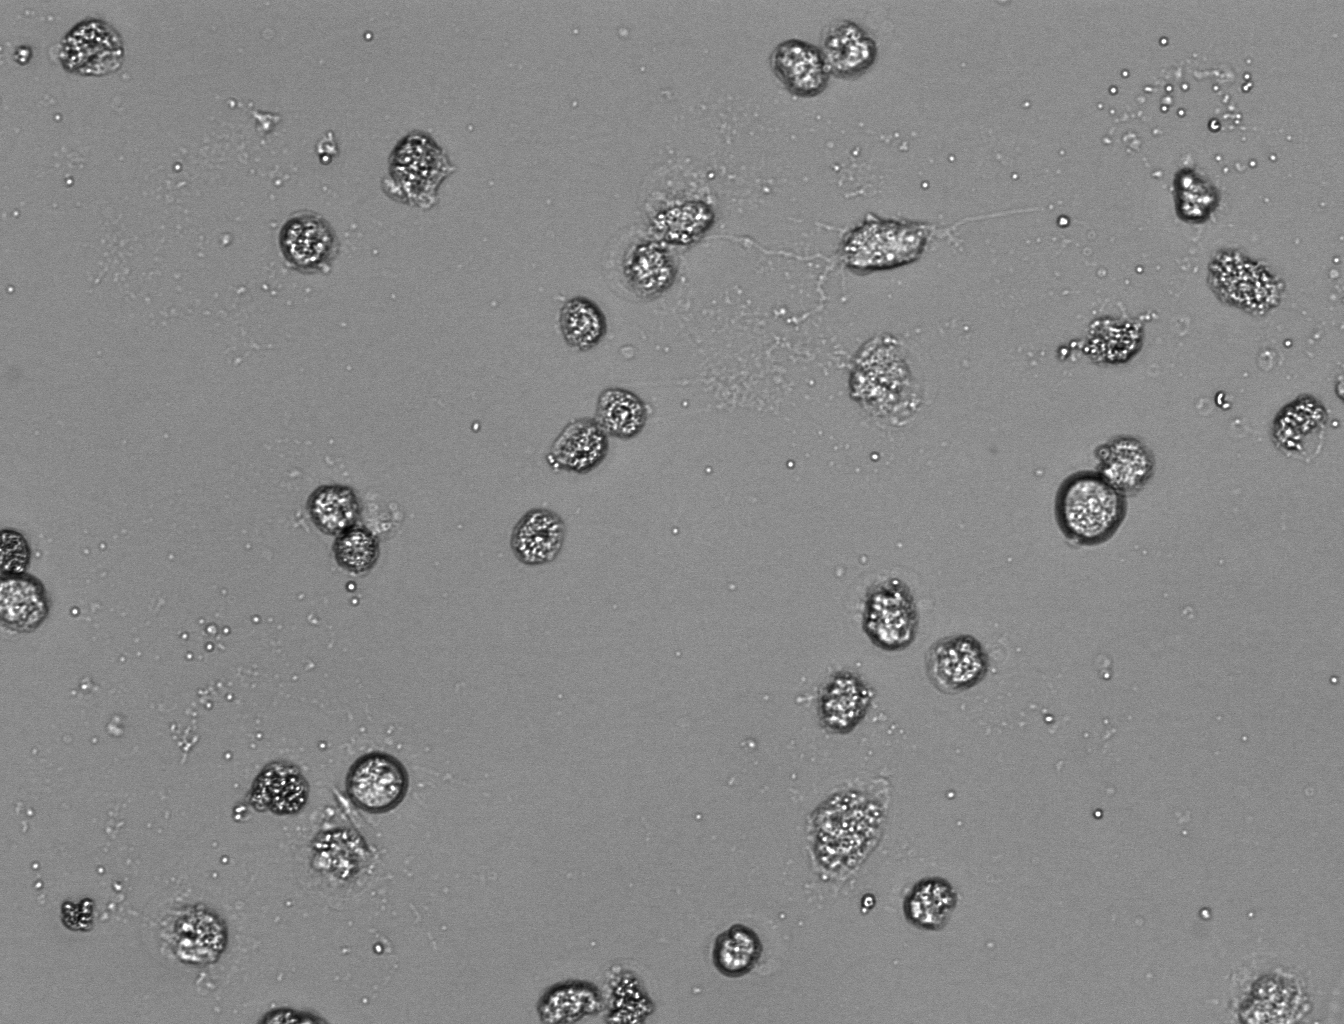
Intravital observation
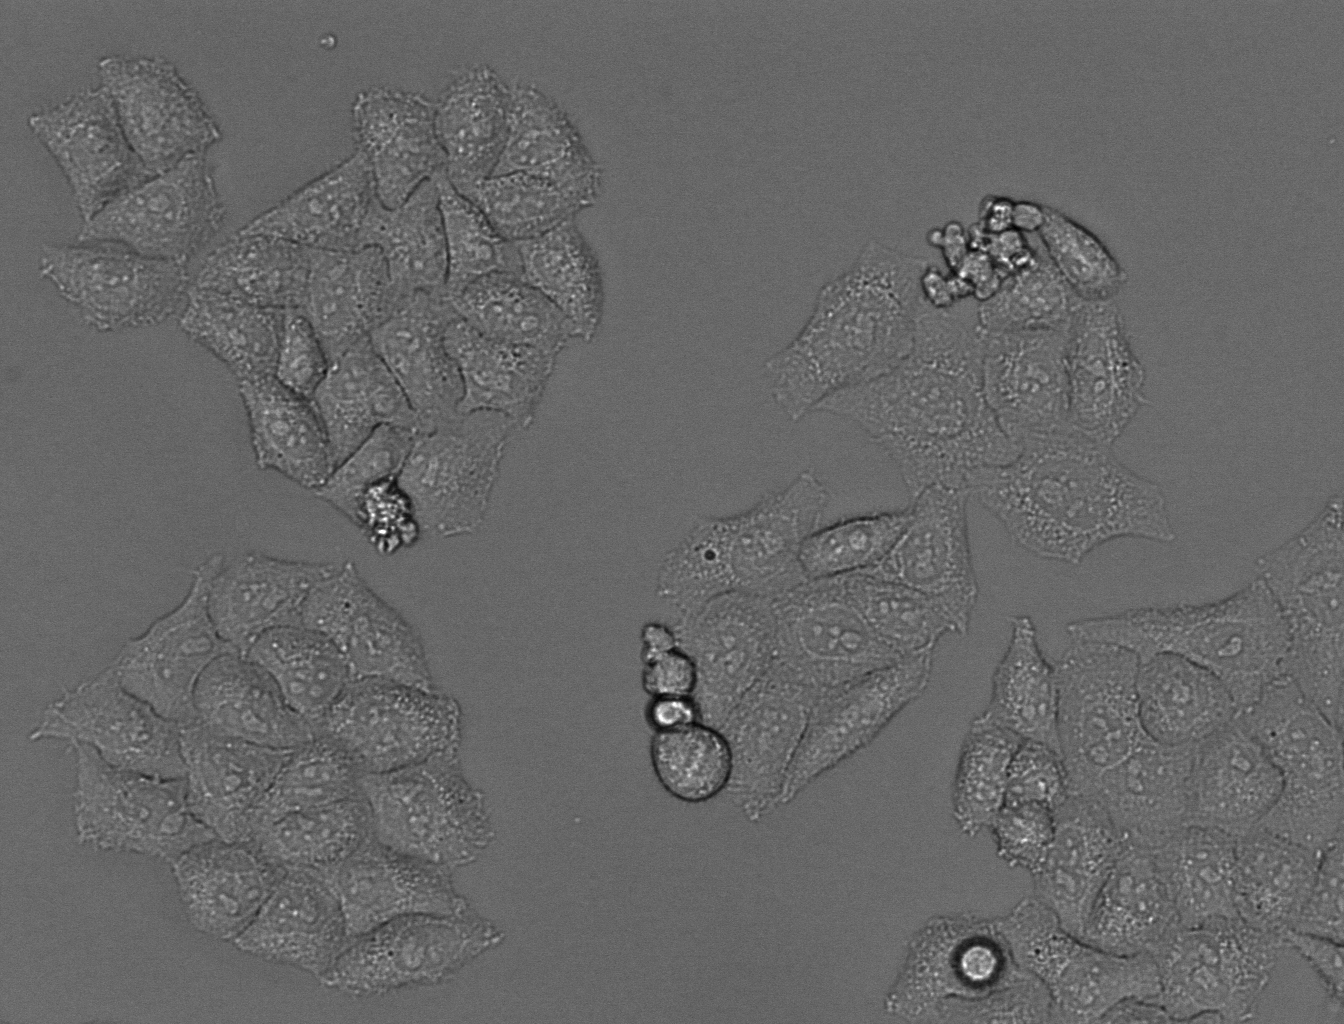
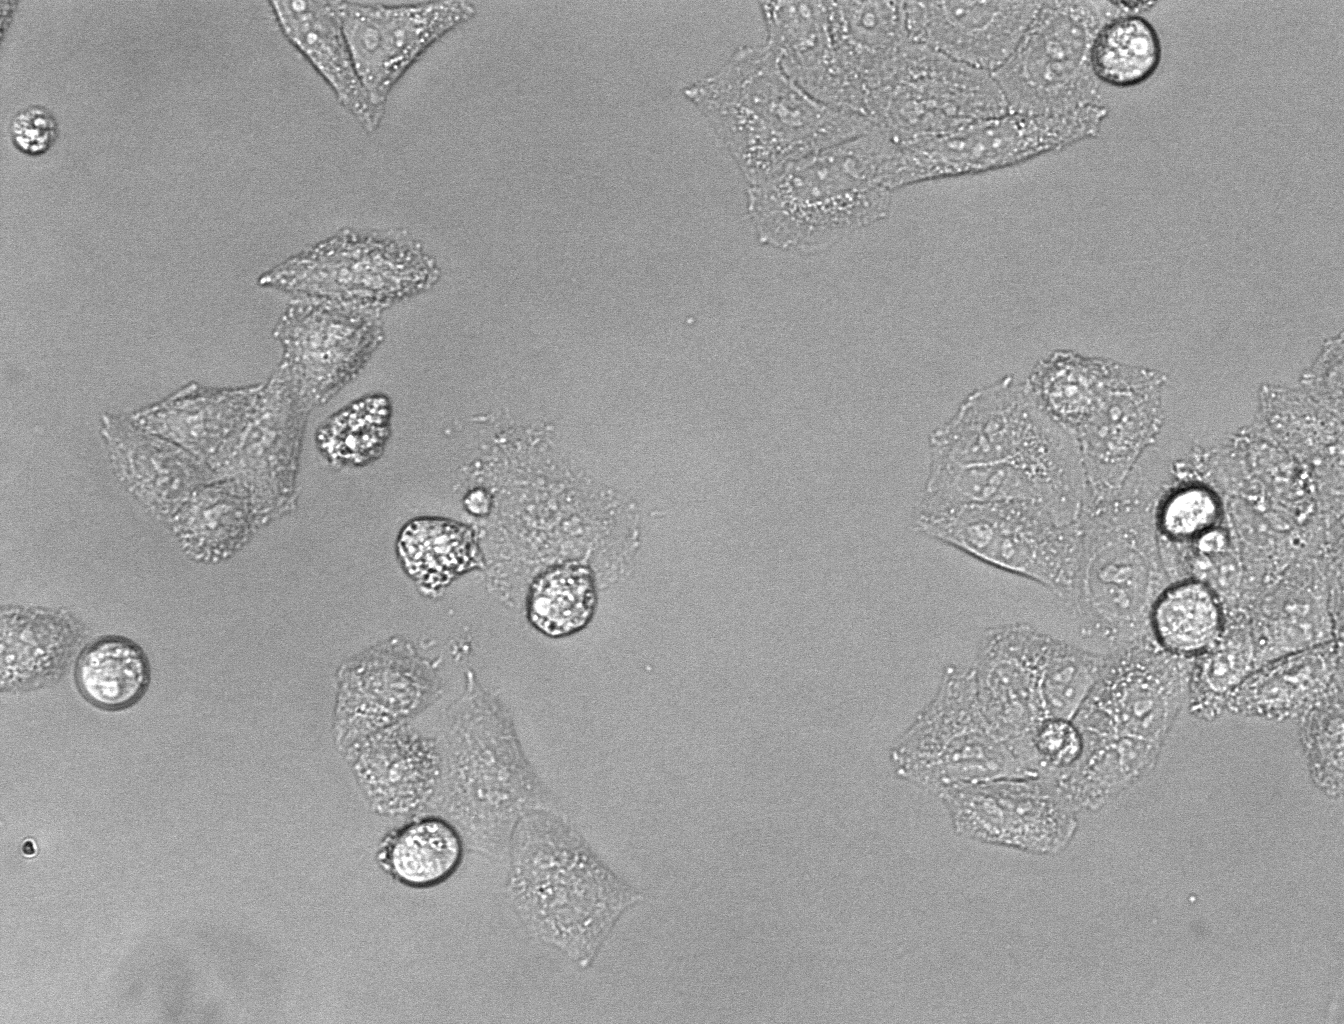
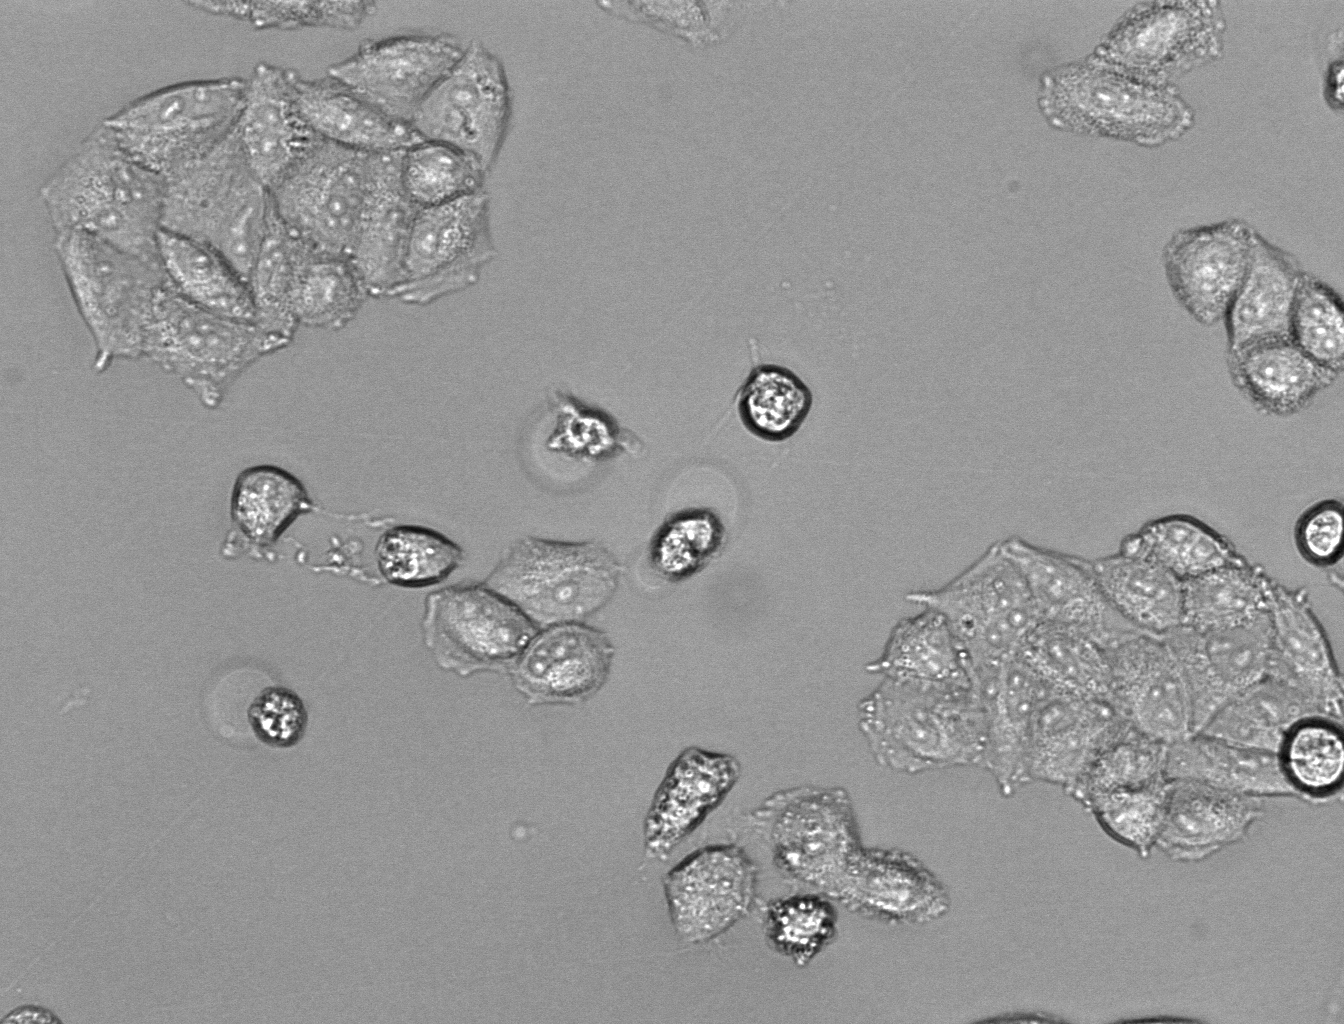
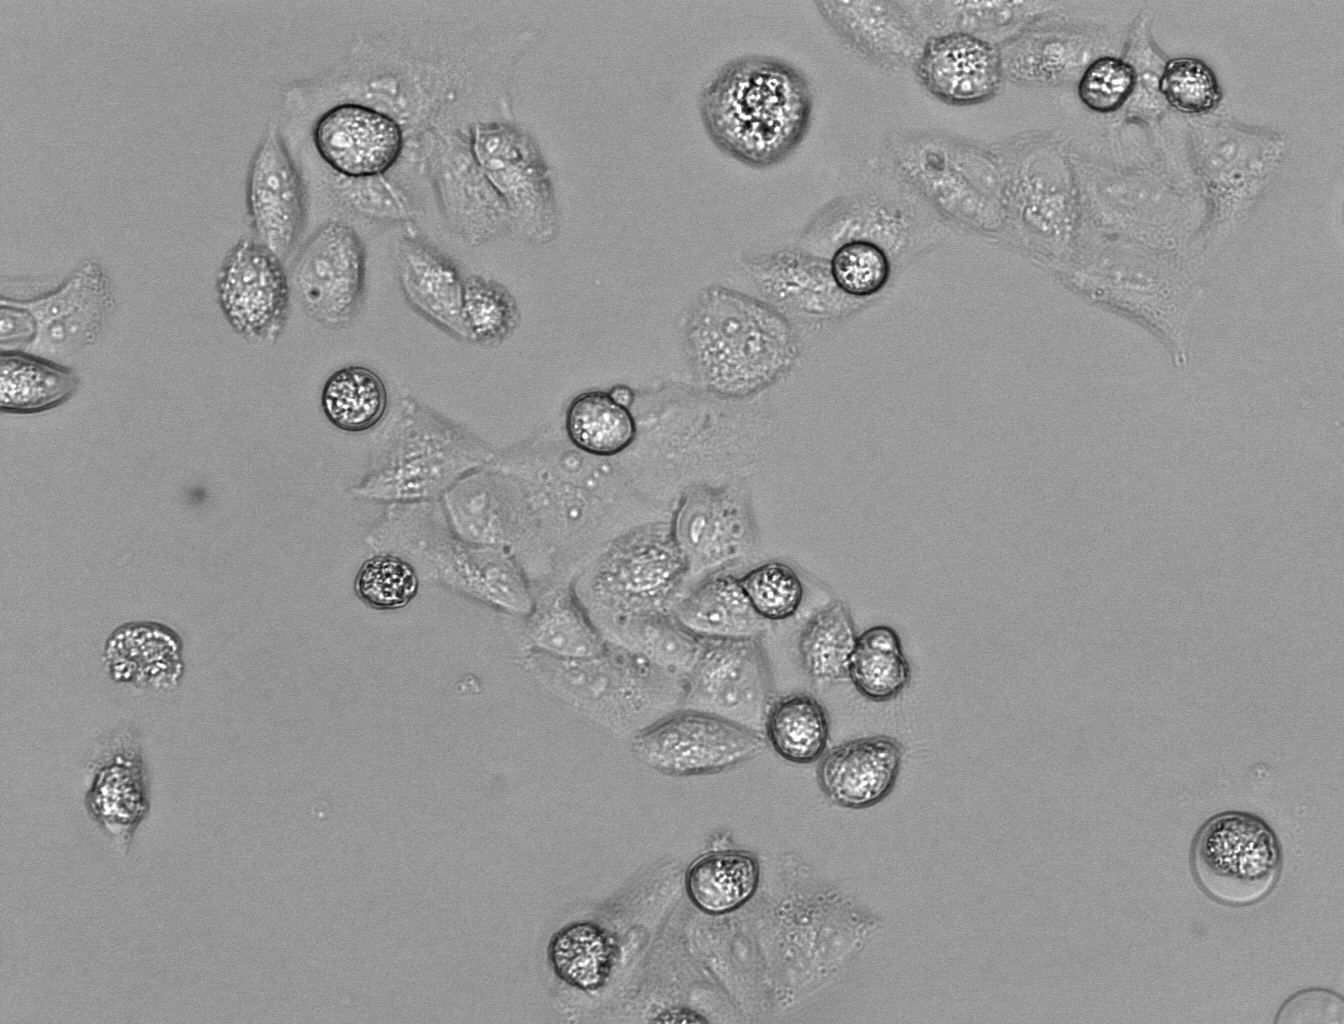
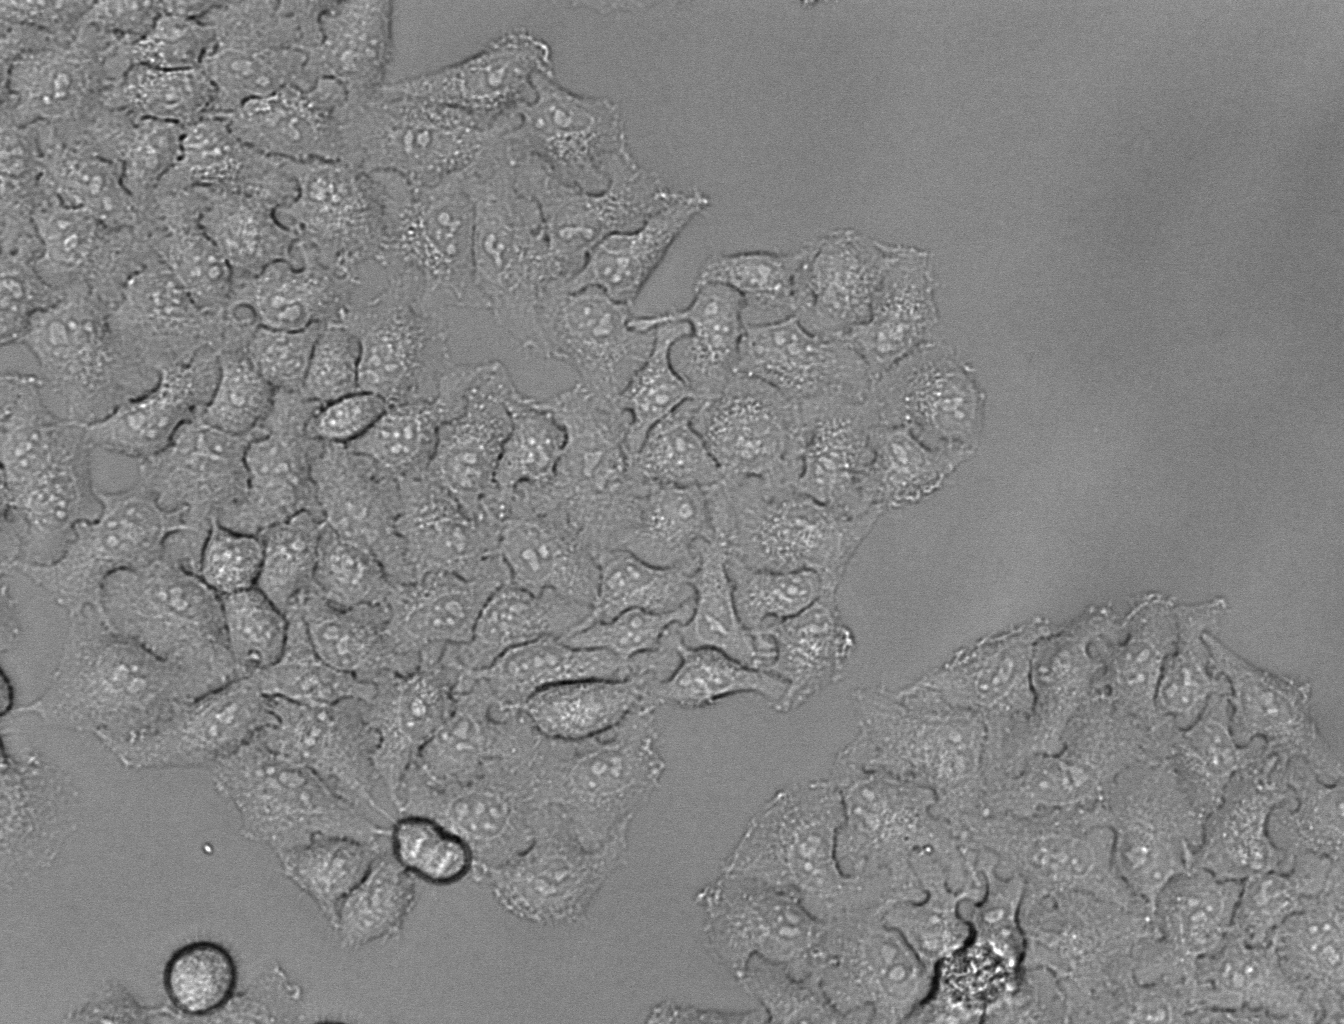
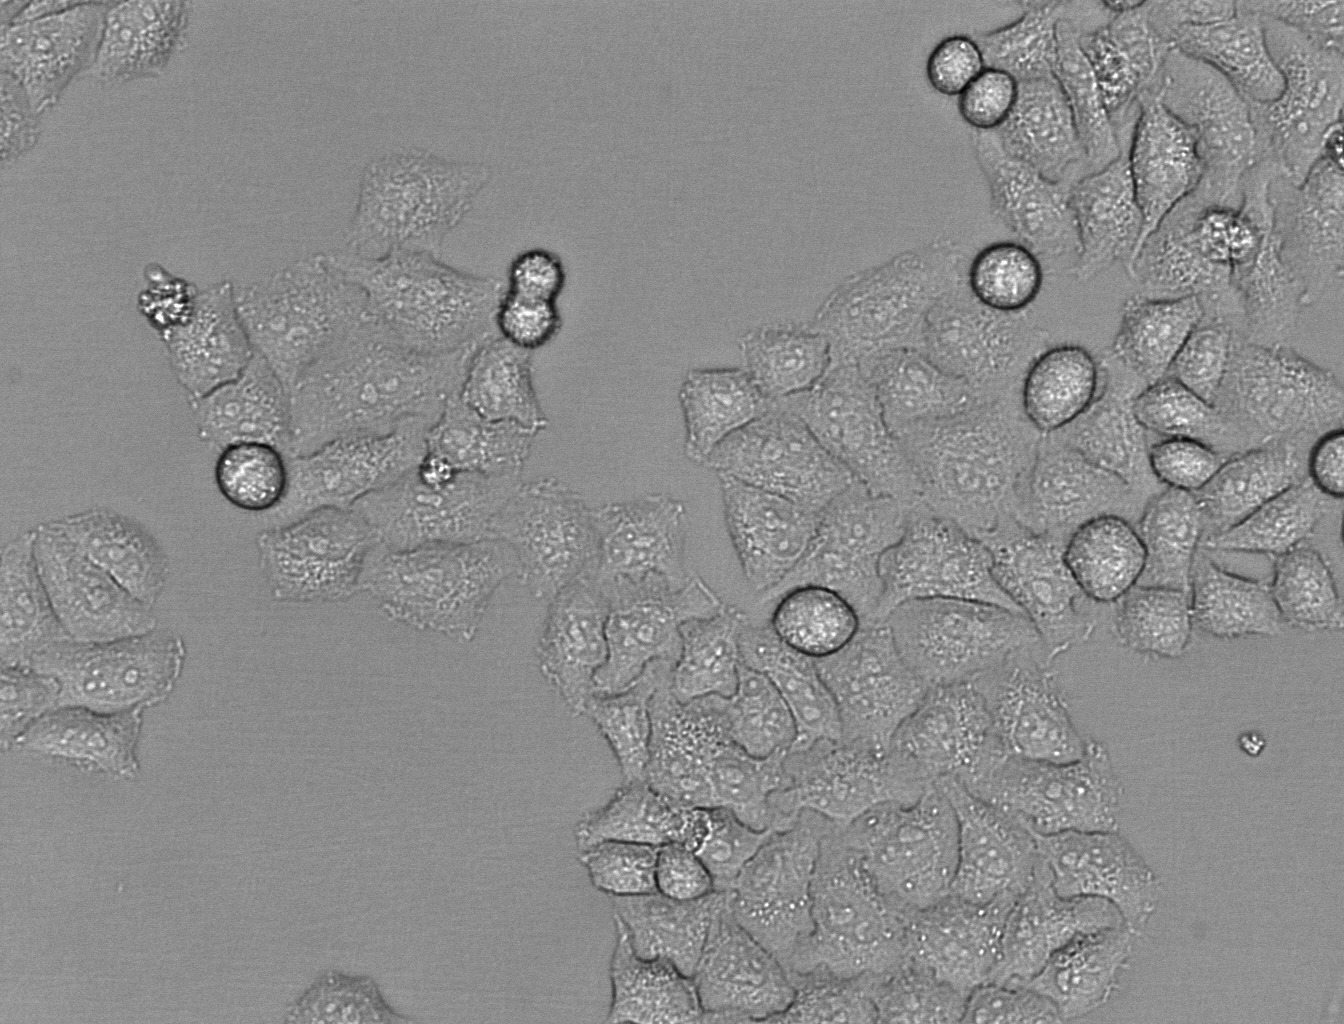
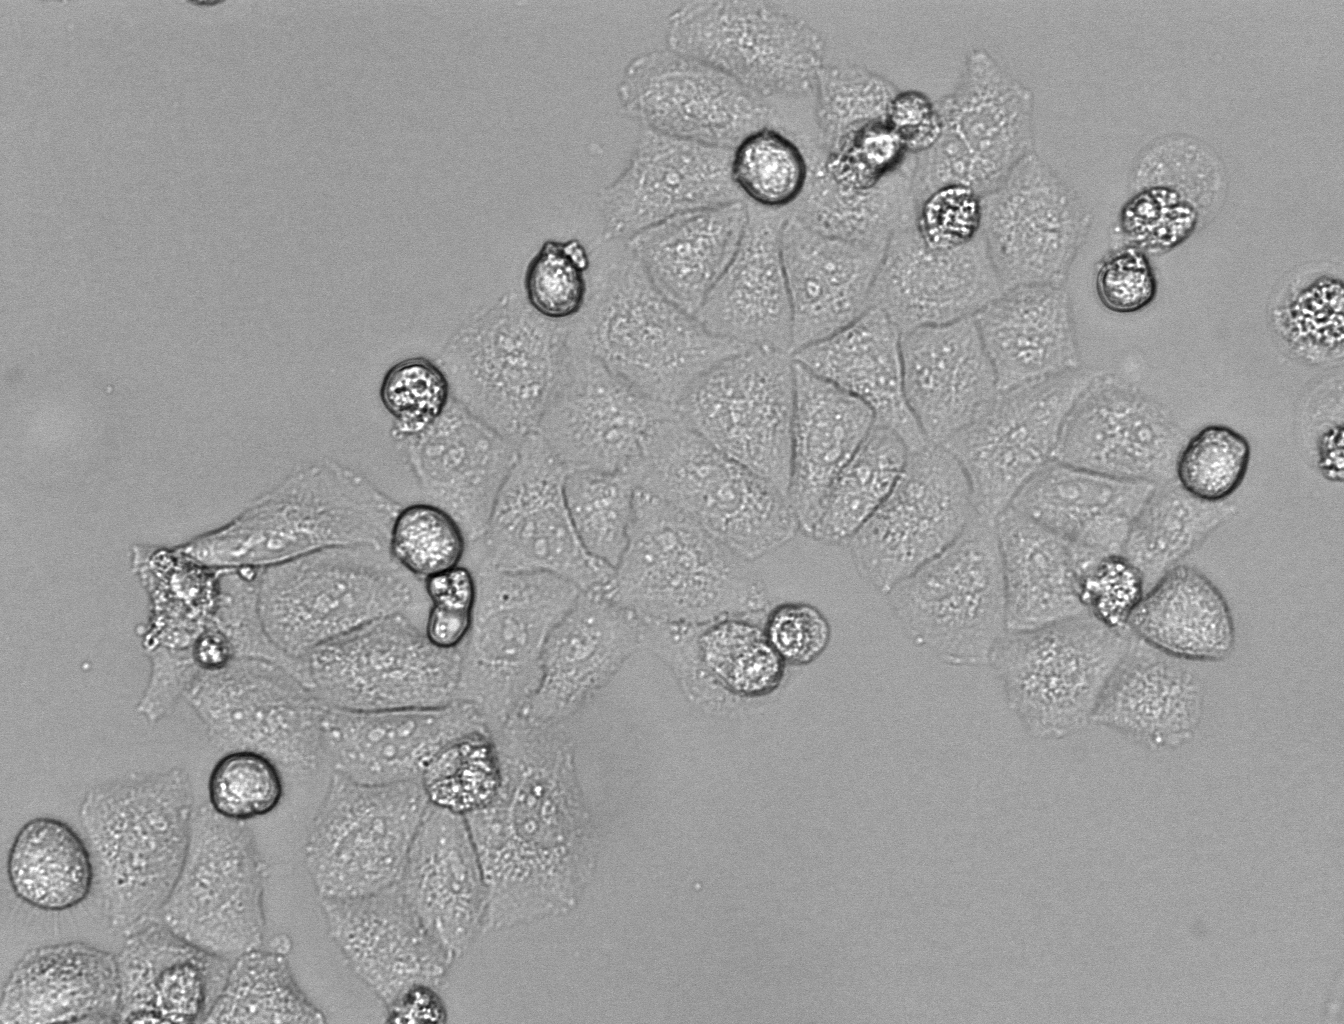
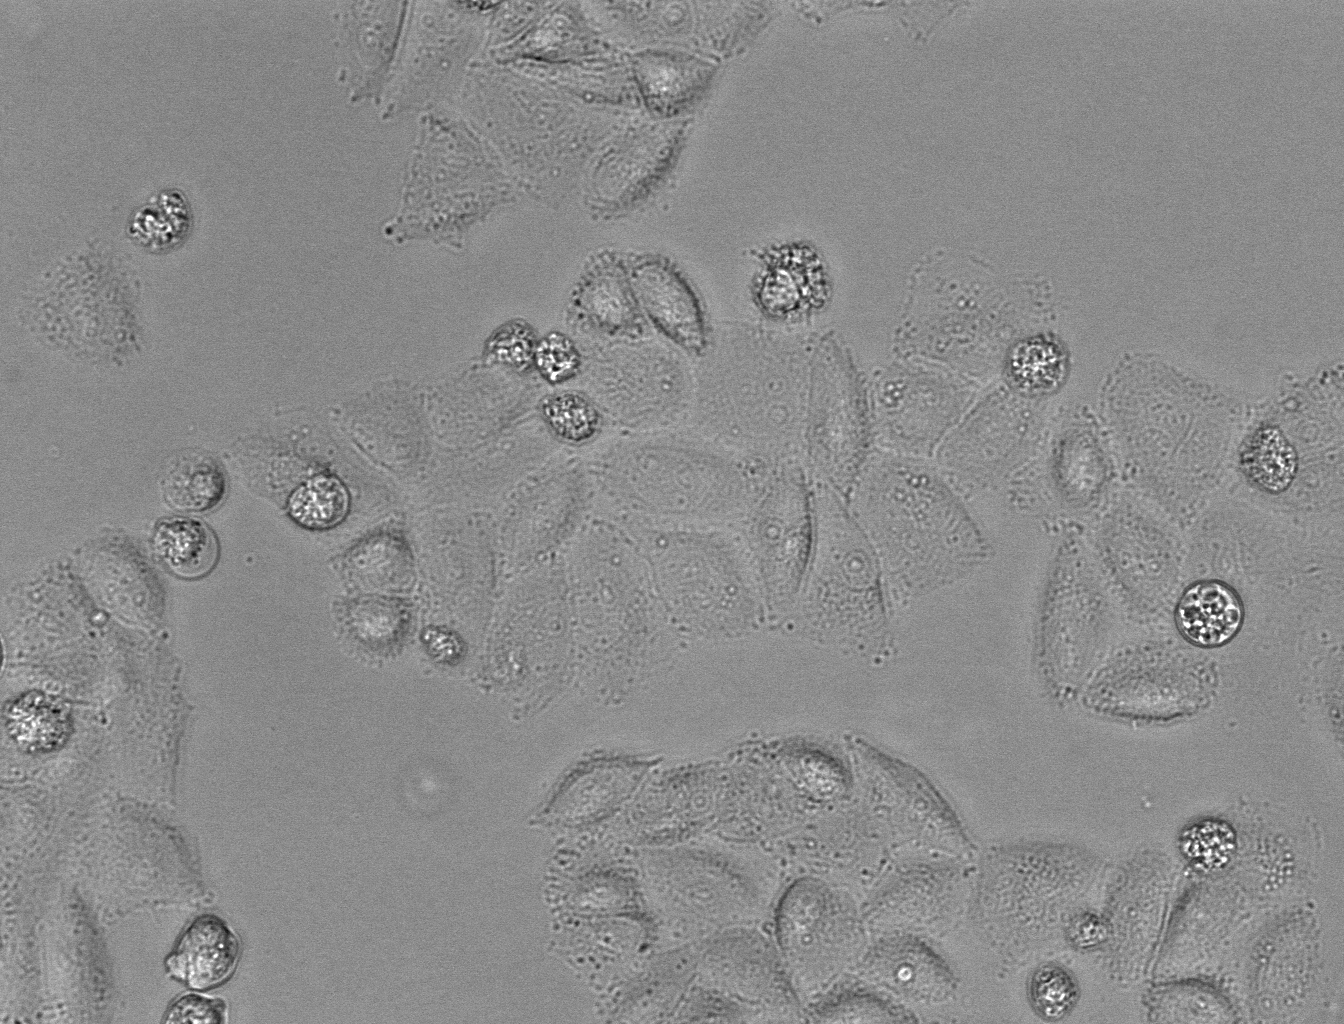
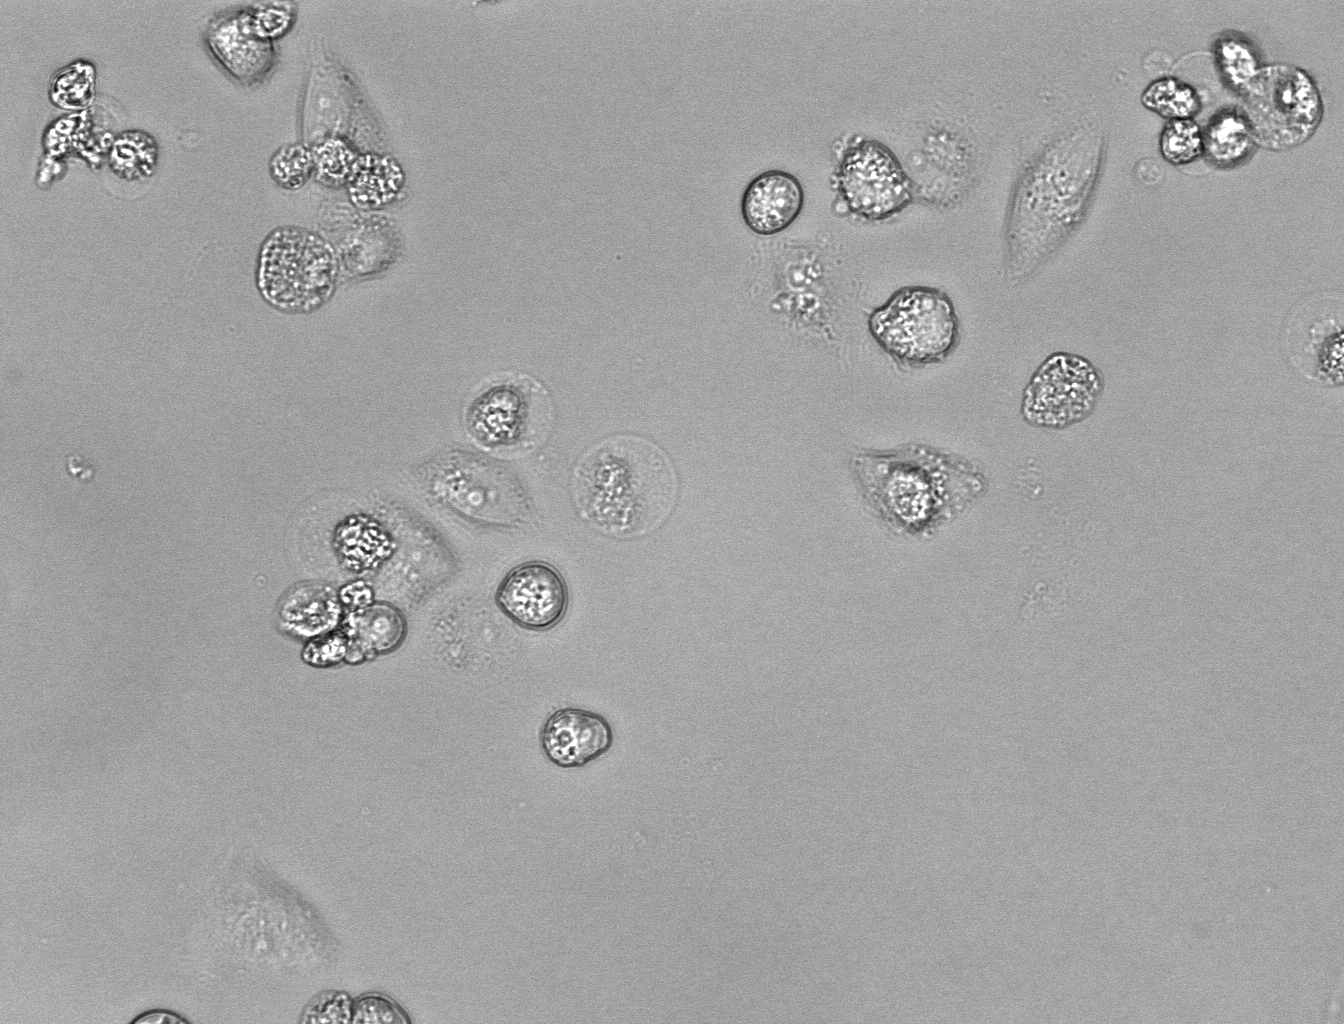
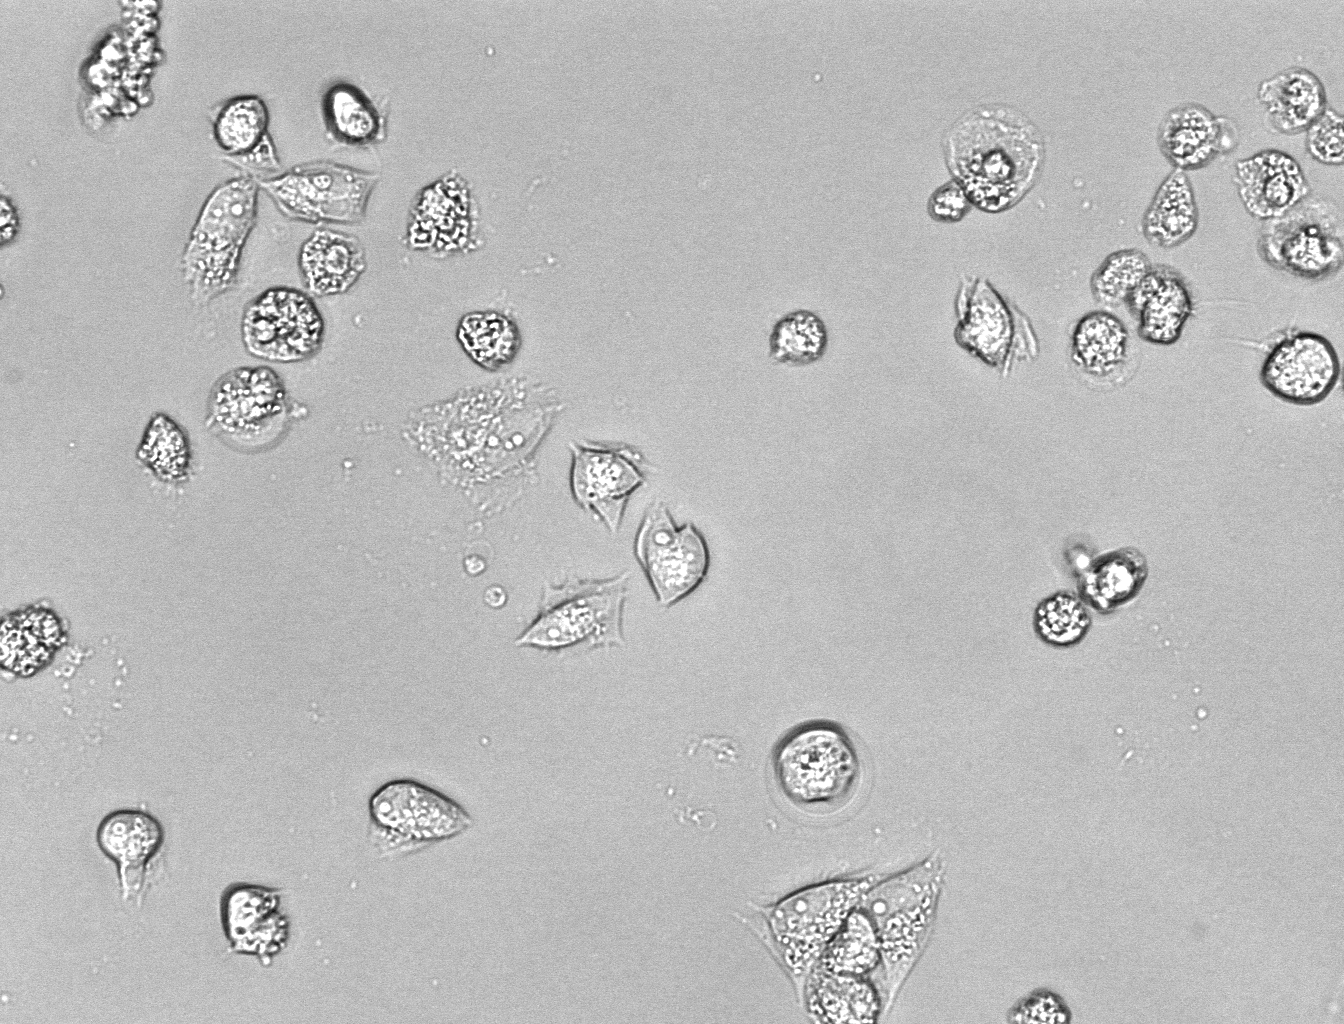
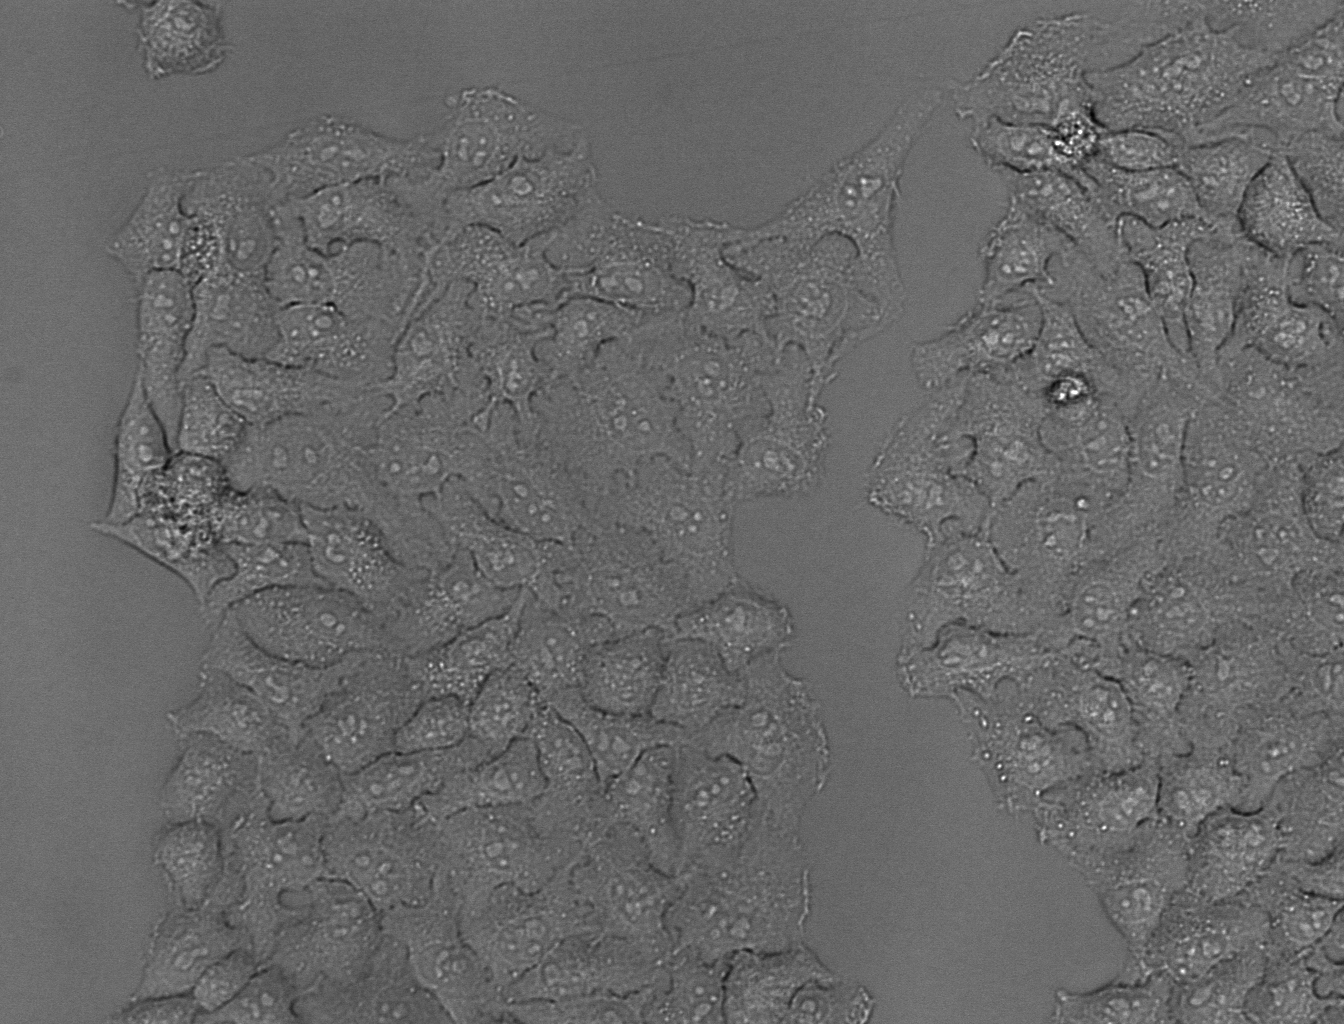
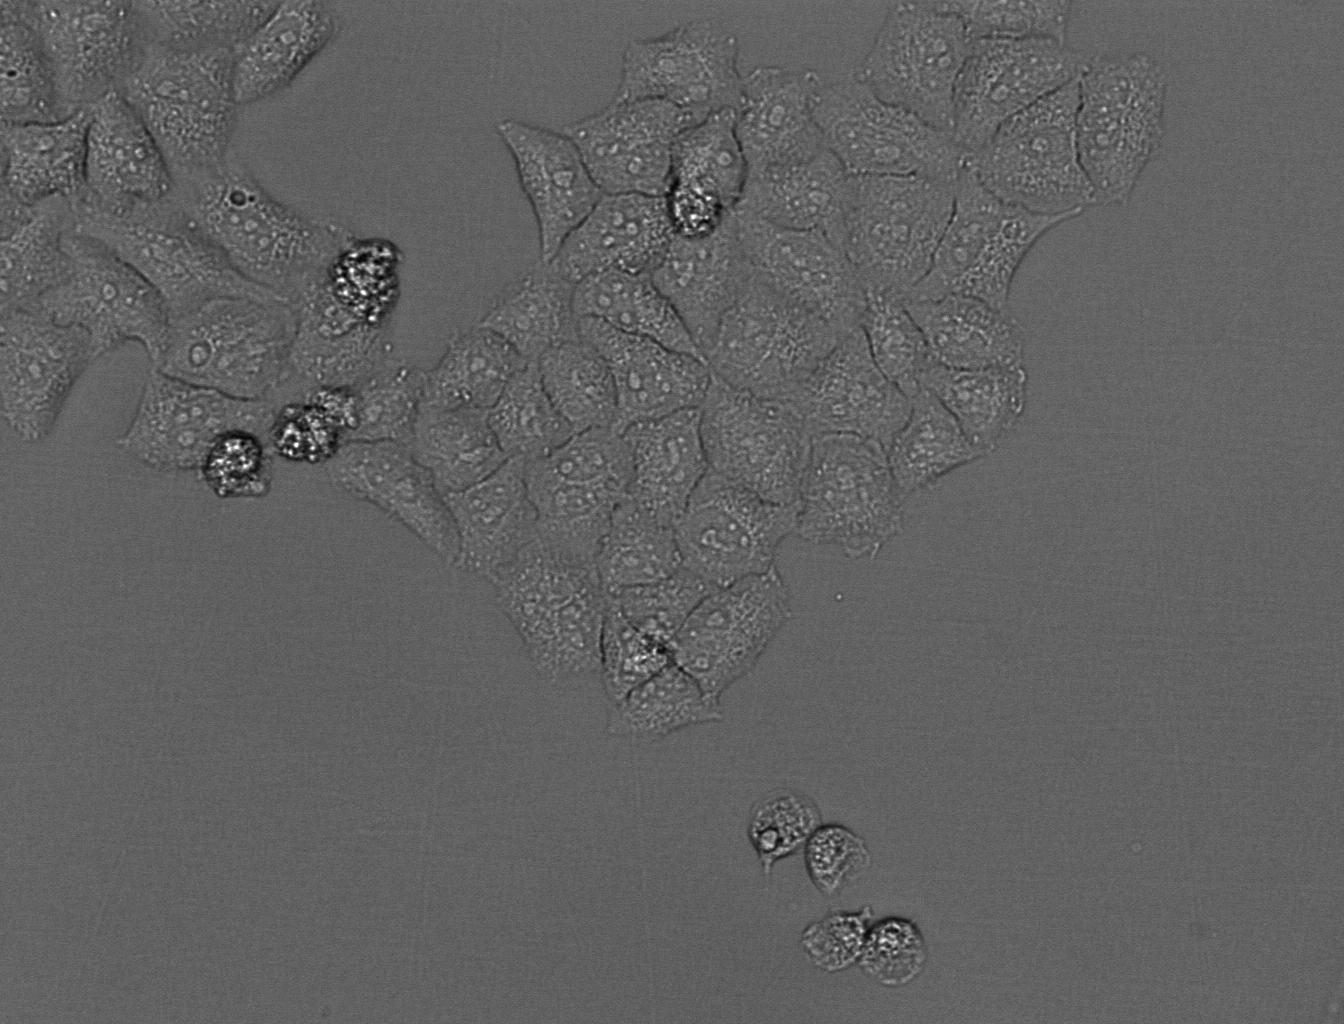
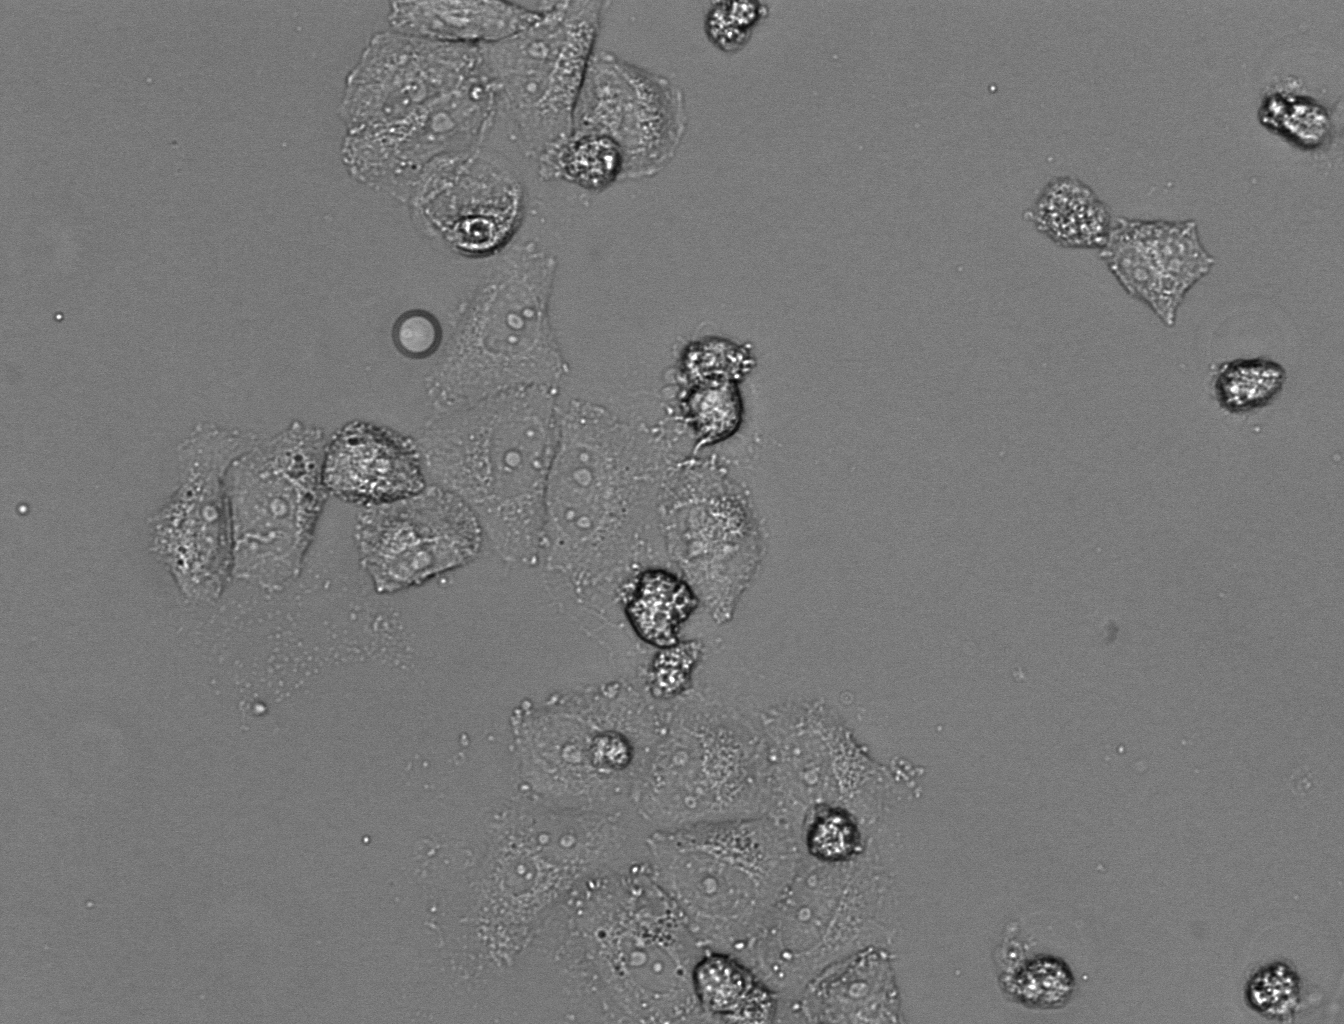
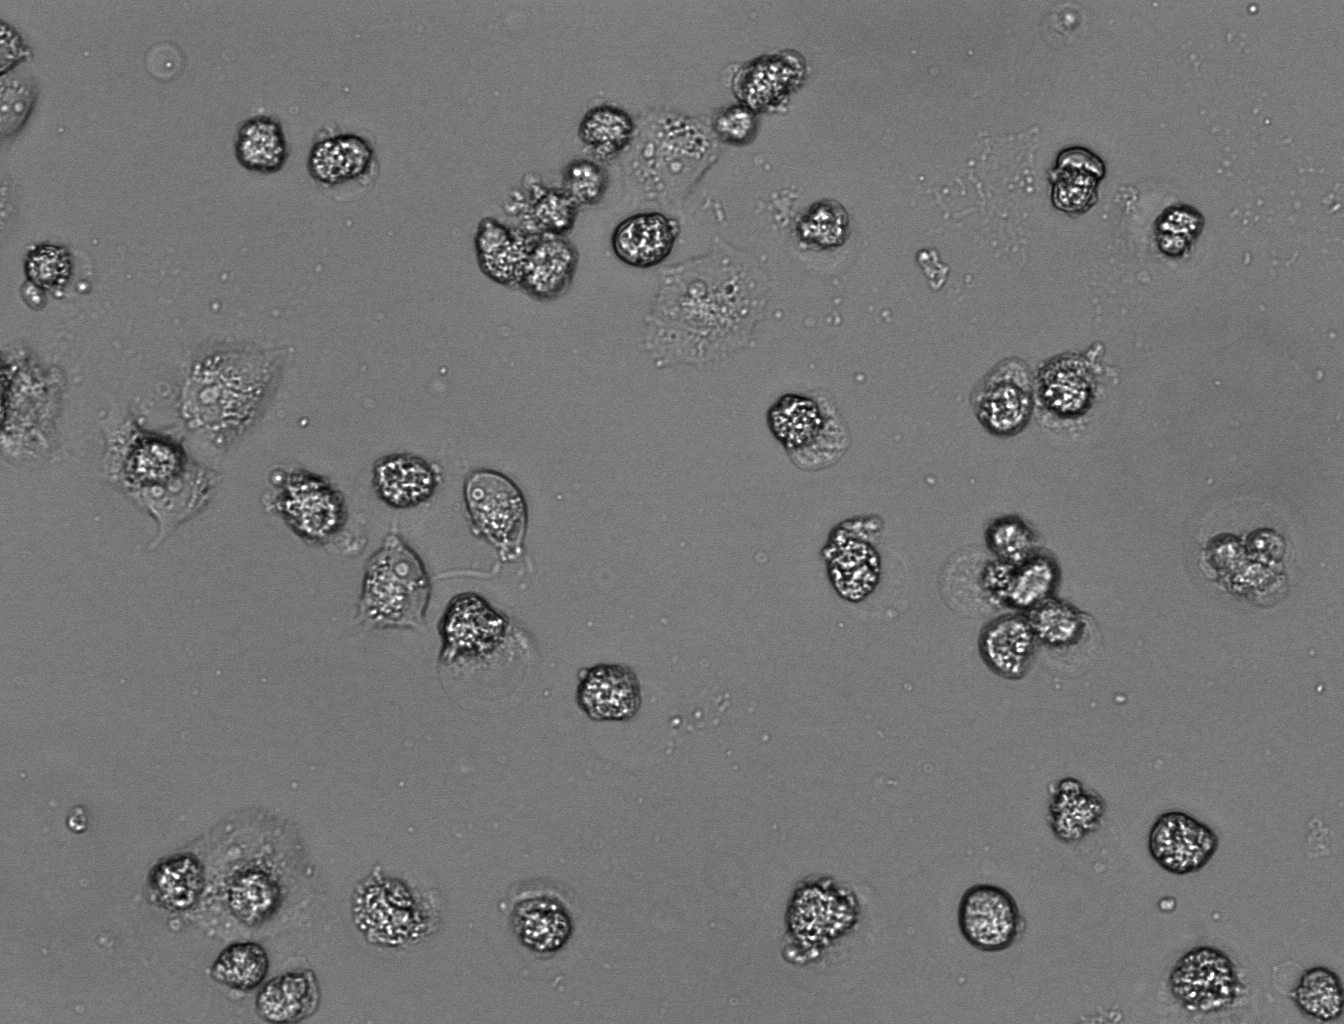
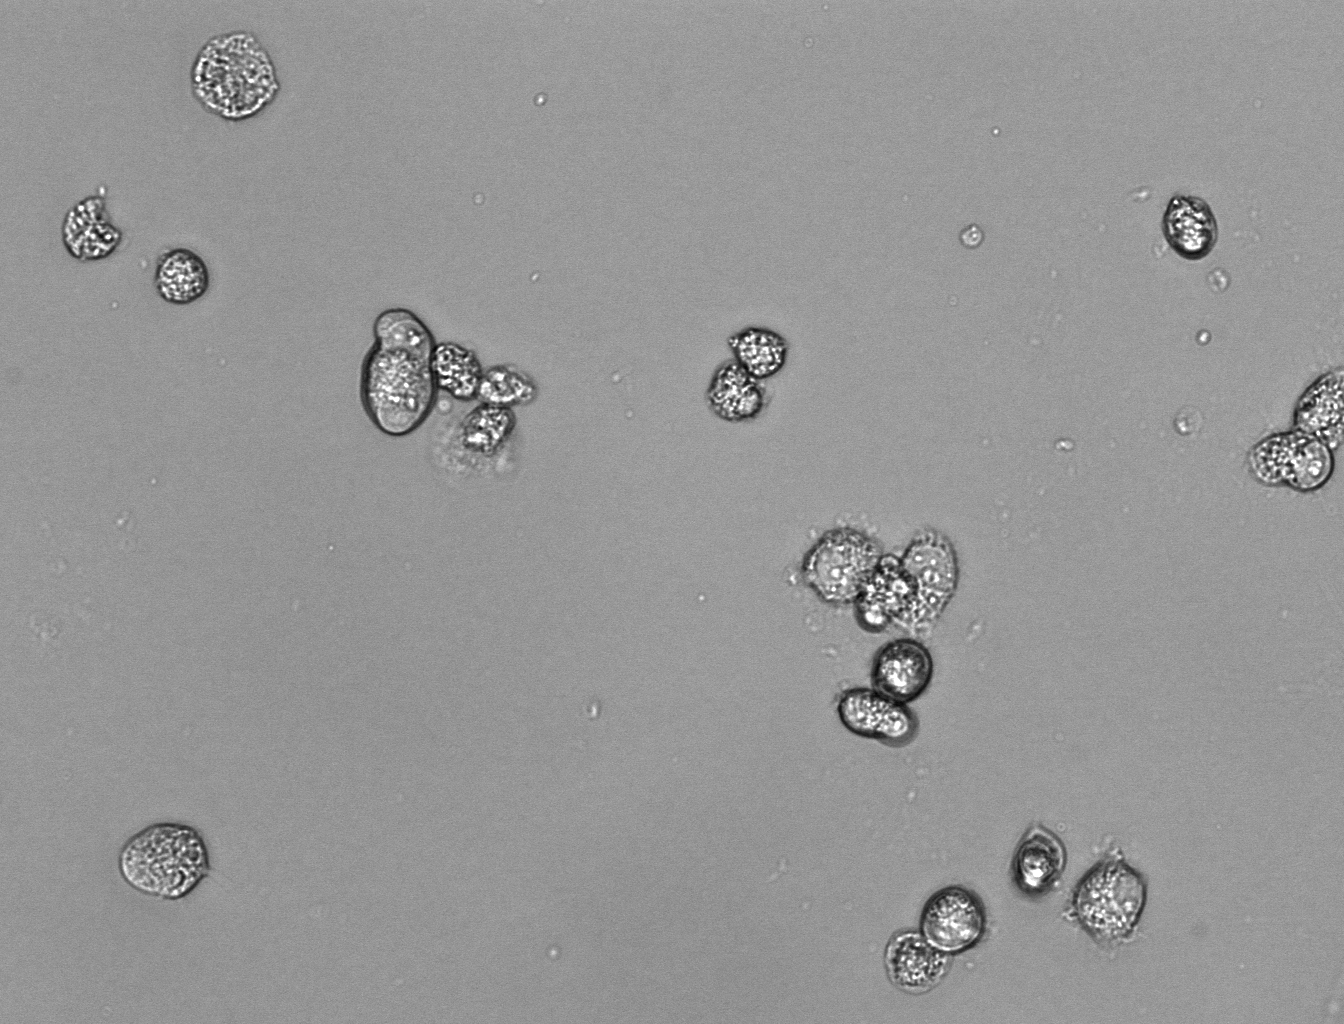
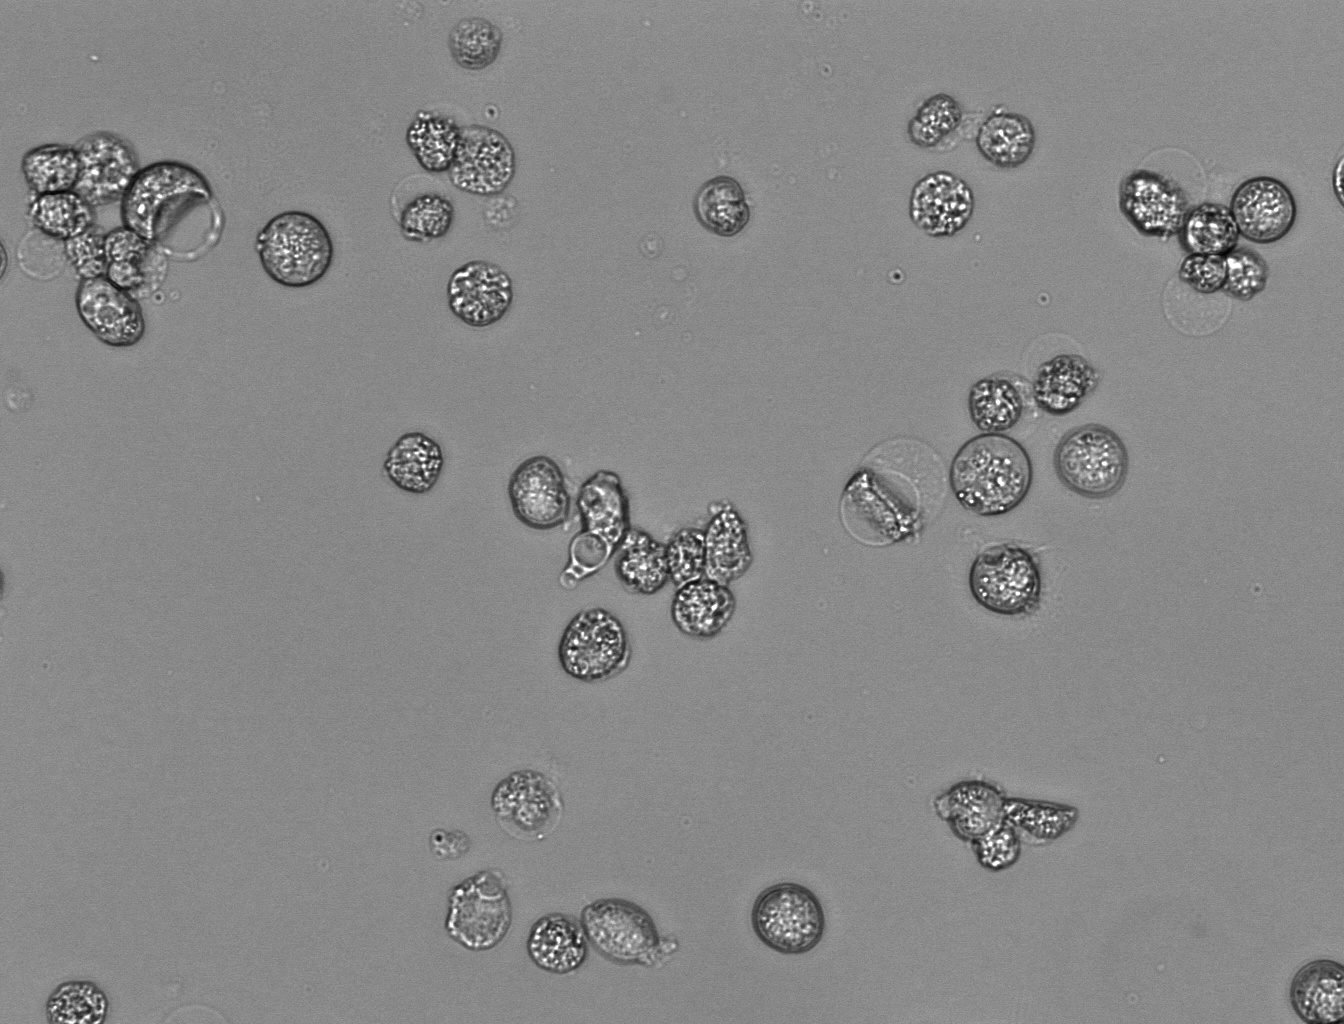
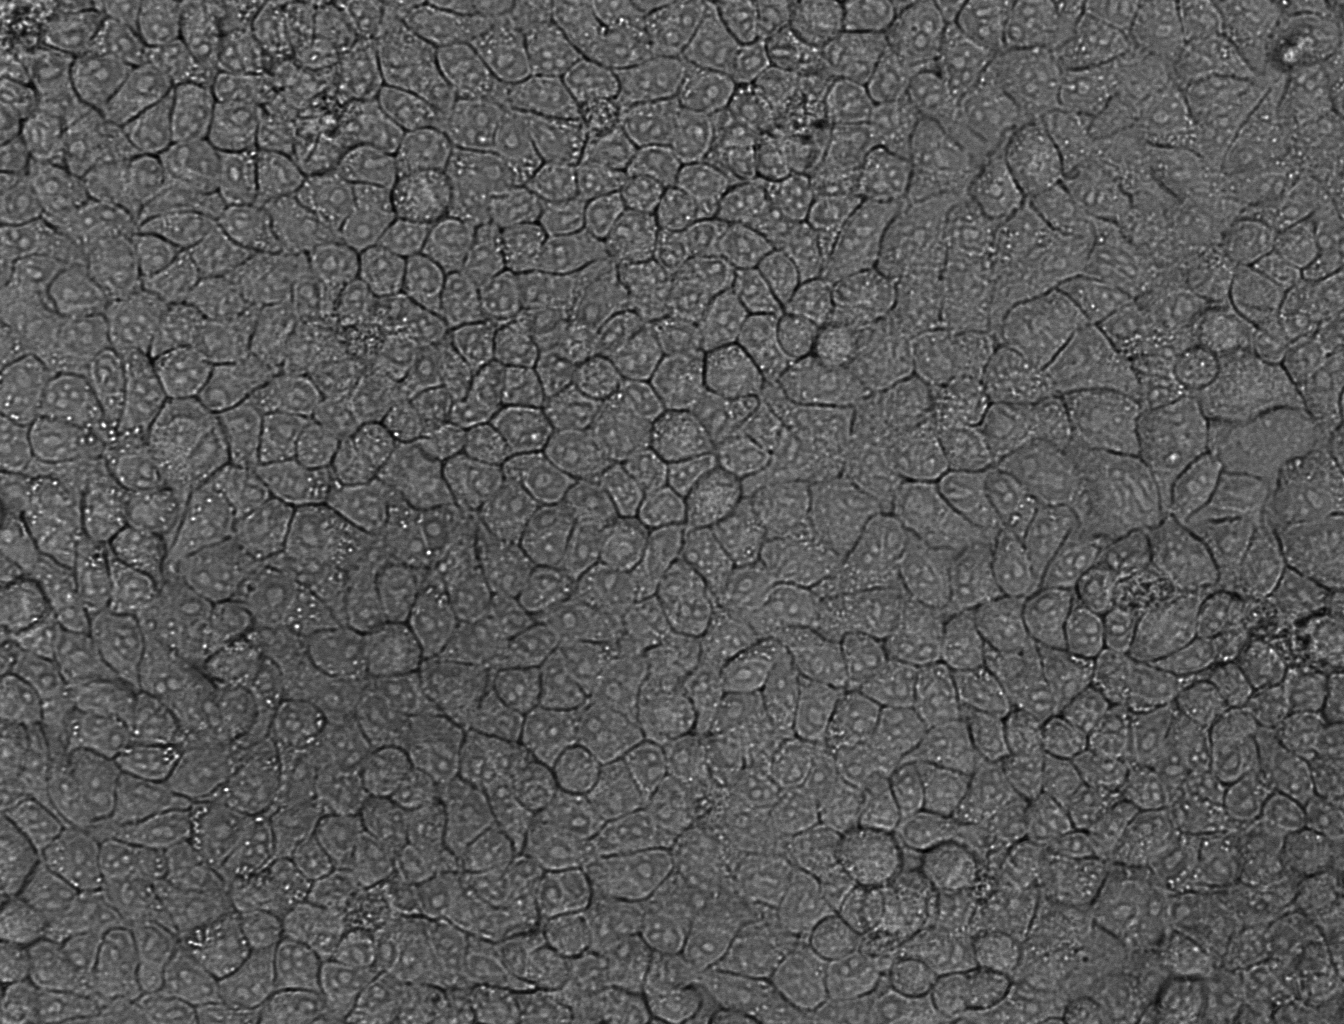
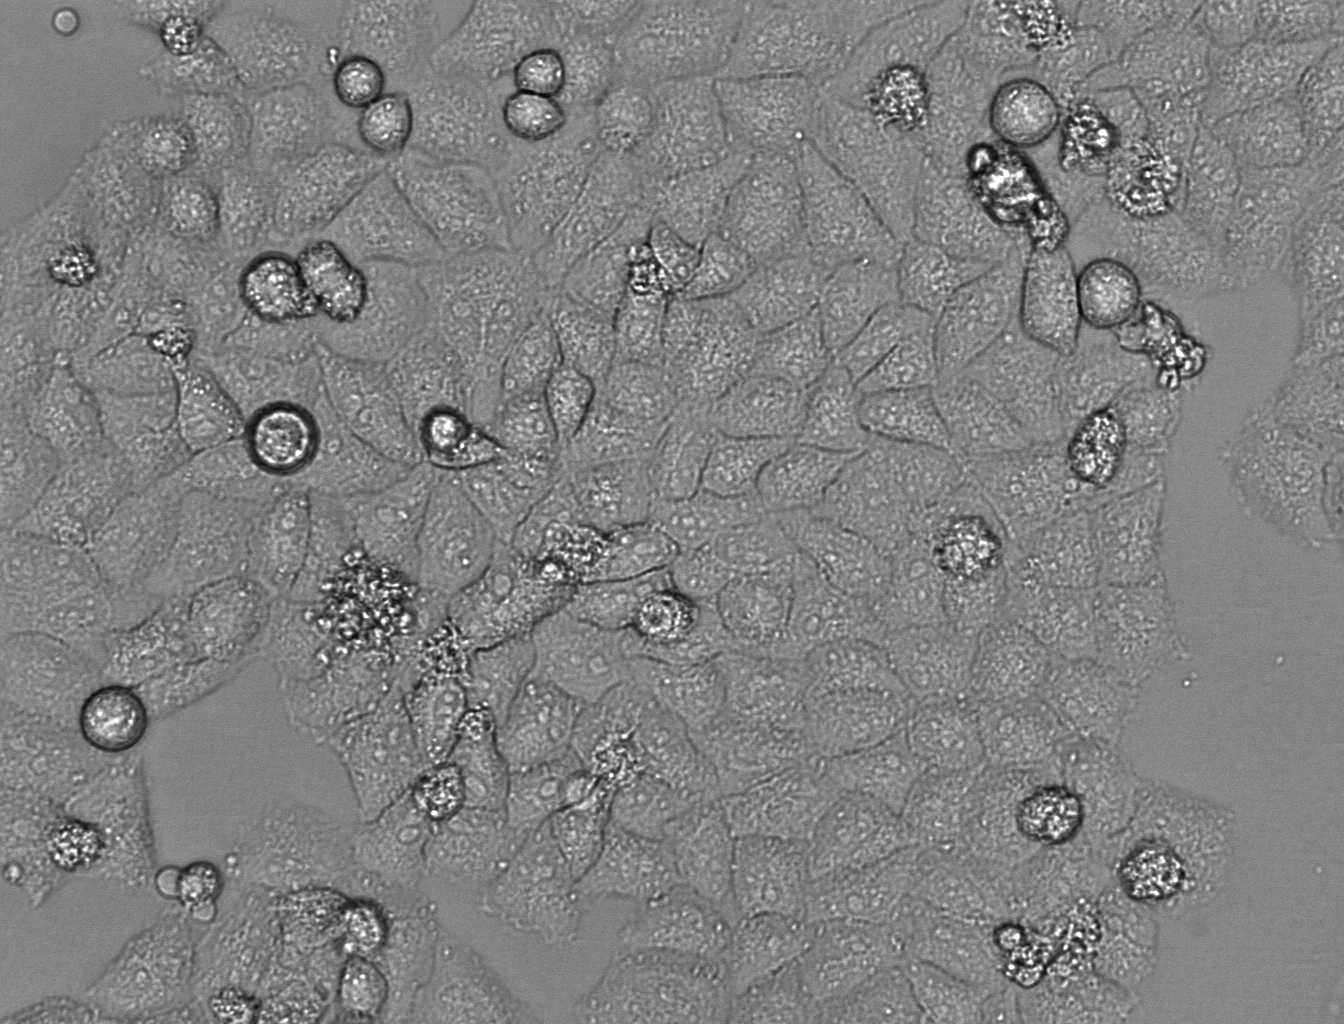
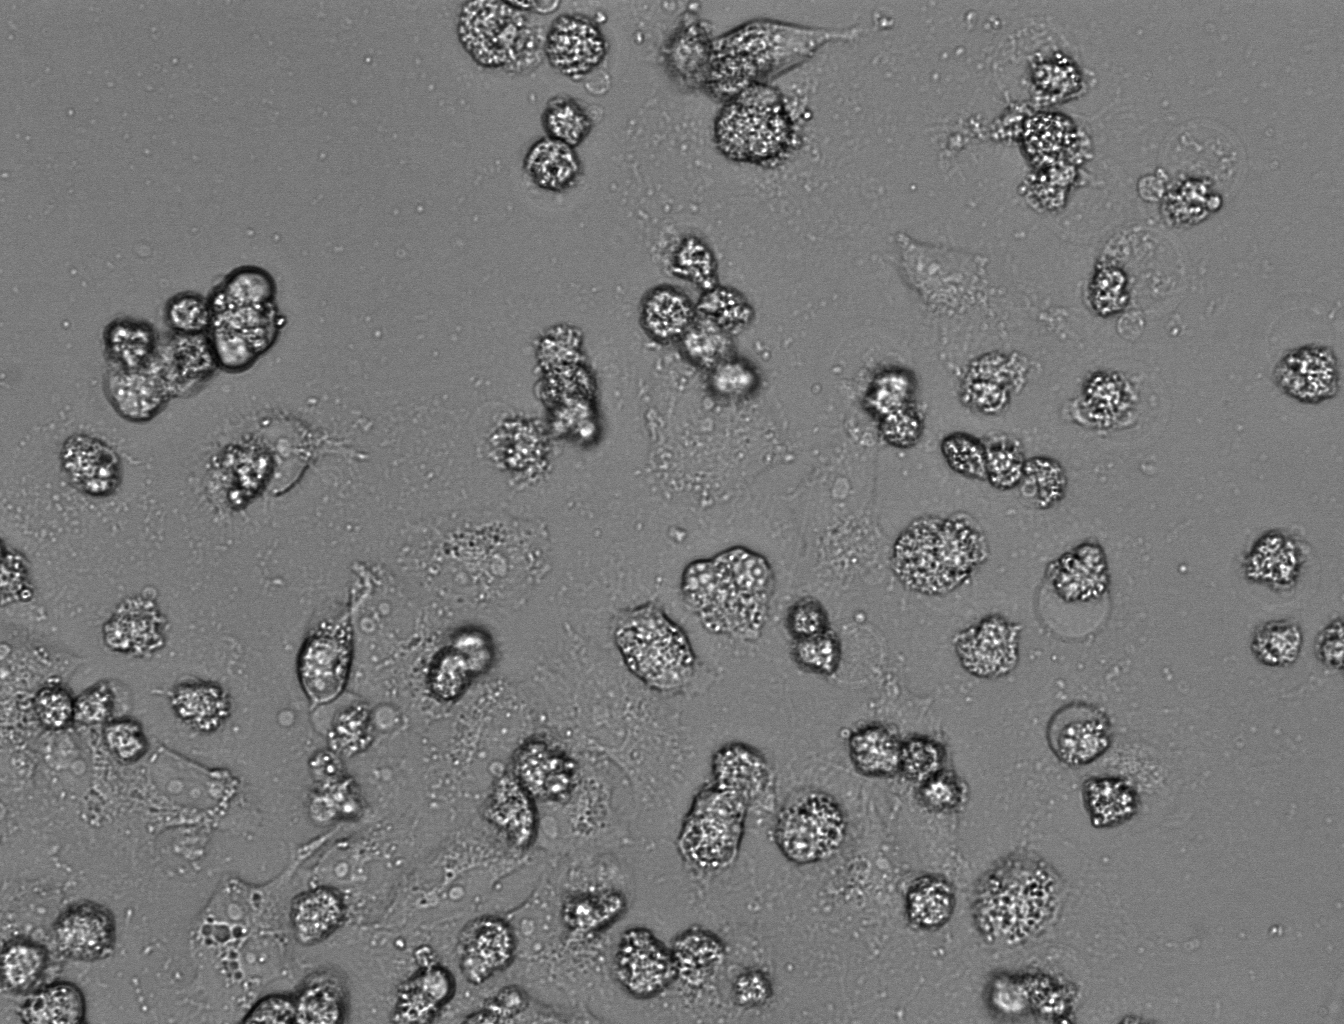
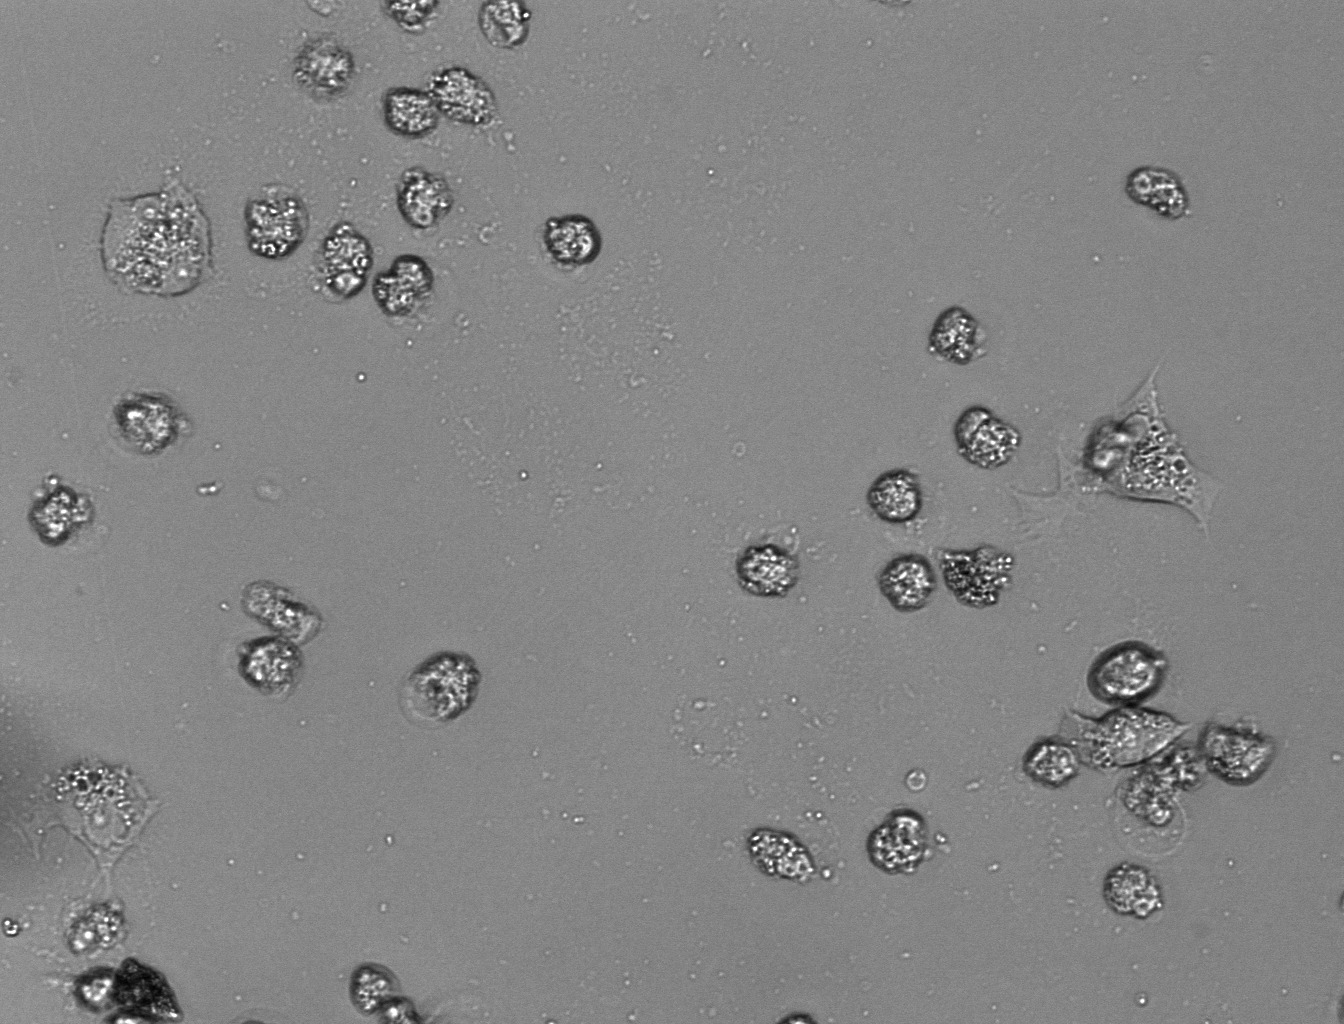
After hours spent on observing the cells and the changes that they have been undergoing we have decided to share some photos from our bright field microscope. We have prepared two 6-wells plates both for HeLa and 143b cell lines: 200.000 cells/well, incubated for 24 hours, adding acrylamide in concentrations 1,2,3,4 and 5mM. Here we present the examples from our intravital observation.
Cell growth assay
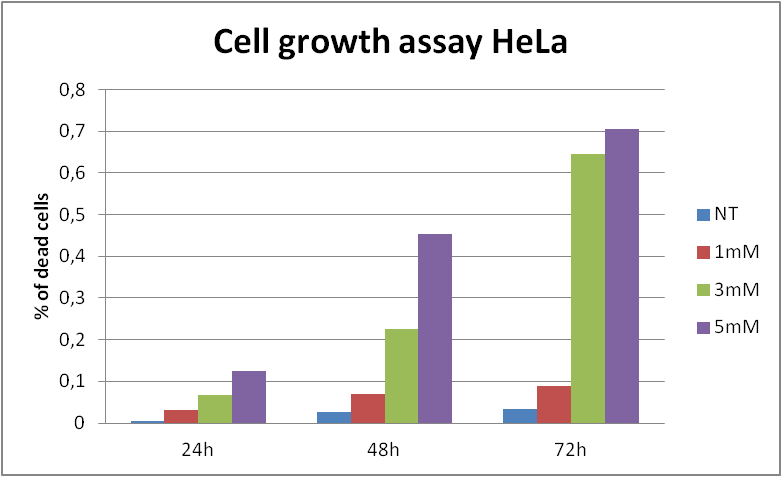
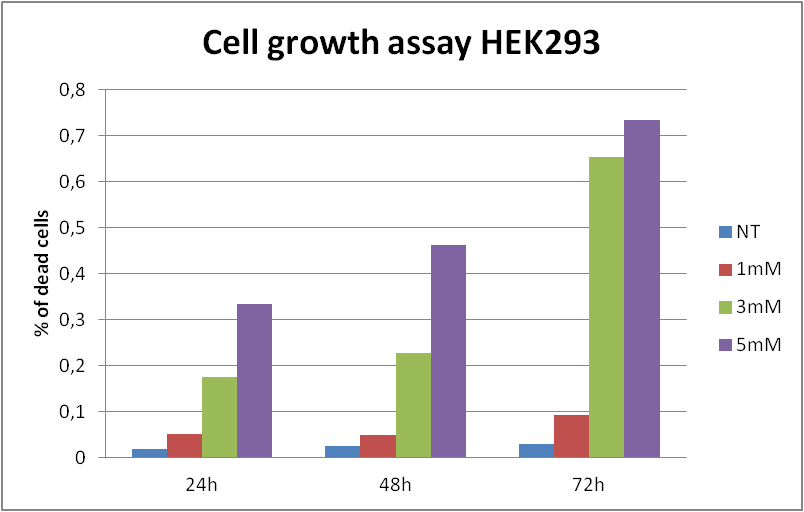
As we wanted to bring under scrutiny the results obtained from AlamarBlue assay we have decided to carry out the cell growth assay. This would enable us to state whether the loss of cell viability, that we have observed, was caused by decrease in cell division (so the cytostatic effect of acrylamide) or by cell death (so the cytotoxic effect of acrylamide).
First of all we have carried out preliminary assay to lay down the adequate cells amount per well. The results show that the cells reached proper confluence for the following concentrations:
- 300.000 cells per well for HeLa
- 100.000 cells per well for 143b
- 600.000 cells per well for HEK293
We have prepared 6-wells plates for HeLa, HEK293 and 143b cell lines. After 24 hours incubation we added acrylamide in following concentrations: 1,3 and 5mM for HeLa and HEK and 1,2 and 5mM for 143b. We have conducted the assay three times and juxtaposed the results.
We have counted cell number after 24, 48 and 72 hour according to the protocol. Usage of Trypan Blue additionally enabled us to count the amount of dead cells and find the proportion between acrylamide concentration, alive and dead cells.
So the results are as follows:
Results for HeLa
| HeLa cell growth 24h | ||||||
|---|---|---|---|---|---|---|
| Acrylamide concentration | live cells number | percent of dead cells | ||||
| NC | 1.368.000 | 0,6 | ||||
| 1mM | 1.124.000 | 3,2 | ||||
| 3mM | 814.000 | 7,1 | ||||
| 5mM | 716.000 | 14,2 | ||||
| HeLa cell growth 48h | ||||||
|---|---|---|---|---|---|---|
| Acrylamide concentration | live cells number | percent of dead cells | ||||
| NC | 2.200.000 | 2,8 | ||||
| 1mM | 1.400.000 | 7,4 | ||||
| 3mM | 664.000 | 29 | ||||
| 5mM | 300.000 | 85,4 | ||||
| HeLa cell growth 72h | ||||||
|---|---|---|---|---|---|---|
| Acrylamide concentration | live cells number | percent of dead cells | ||||
| NC | 3.848.000 | 3,4 | ||||
| 1mM | 2.255.200 | 9,7 | ||||
| 3mM | 354.160 | 182 | ||||
| 5mM | 234.360 | 240 | ||||
Results for HEK293
| HEK293 cell growth 24h | ||||||
|---|---|---|---|---|---|---|
| Acrylamide concentration | live cells number | percent of dead cells | ||||
| NC | 2.255.000 | 2 | ||||
| 1mM | 1.756.000 | 5,4 | ||||
| 3mM | 1.273.000 | 21 | ||||
| 5mM | 536.250 | 50 | ||||
| HEKcell growth 48h | ||||||
|---|---|---|---|---|---|---|
| Acrylamide concentration | live cells number | percent of dead cells | ||||
| NC | 4.096.354 | 2.5 | ||||
| 1mM | 2.461.000 | 5.1 | ||||
| 3mM | 1.091.104 | 29.4 | ||||
| 5mM | 489.583 | 85.6 | ||||
| HEK cell growth 72h | ||||||
|---|---|---|---|---|---|---|
| Acrylamide concentration | live cells number | percent of dead cells | ||||
| NC | 4.583.200 | 3,05 | ||||
| 1mM | 2.598.800 | 10,2 | ||||
| 3mM | 531.000 | 188 | ||||
| 5mM | 316.000 | 277 | ||||
Results for 143b
| 143b cell growth 24h | ||||||
|---|---|---|---|---|---|---|
| Acrylamide concentration | live cells number | percent of dead cells | ||||
| NC | ||||||
| 1mM | ||||||
| 3mM | ||||||
| 5mM | ||||||
| 143b cell growth 48h | ||||||
|---|---|---|---|---|---|---|
| Acrylamide concentration | live cells number | percent of dead cells | ||||
| NC | ||||||
| 1mM | ||||||
| 3mM | ||||||
| 5mM | ||||||
| 143b cell growth 72h | ||||||
|---|---|---|---|---|---|---|
| Acrylamide concentration | live cells number | percent of dead cells | ||||
| NC | ||||||
| 1mM | ||||||
| 3mM | ||||||
| 5mM | ||||||
 "
"
