 "
"
Team:UANL Mty-Mexico/Results
From 2013.igem.org
Results at a glance

Figure 1 shows the predicted secondary structures of the two synthetic RNATs implemented in our project (designed by Neupert et al. and iGEM TuDelft 2008, respectively). So far, we detected fluorescence only with the 37ºC responsive RNAT, which controls mCherry's translation.
Figure 2 shows the visual appearance of cultures grown at 37ºC containing Part:BBa_K1140006 (37ºC RNAT_mCherry construction) (figure 2a), a non-fluorescent control (figure 2b), and a standard constitutively expressing RFP (figure 2c)


The synthetic RNAT proved to regulate expression in response to temperature changes. Fluorescence of cultures carrying our construction increases almost 4x from 31 to 37ºC (figure 3).
Surprisingly, we obtained different behaviors in clones transformed with the same DNA (figure 4). We suspected variations in plasmid copy number (PCN) to be the potential cause of phenotypic discrepancies among clones.


To look into this possibility, we examined plasmid DNA concentration (yielded from plasmid miniprep) as an indirect measurement of PCN. Even if there exists a large variation among repetitions, M12 clone appears to have consistently smaller plasmid concentrations (figure 5). This result encourages us to further investigate PCN as the potential cause of phenotypic variations among clones.
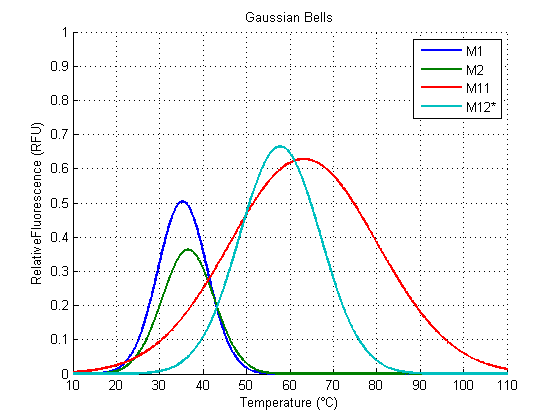
Mathematically, we found that a simple gaussian function fits our data well, and it provides us a way to quantify the strength (amplitude), optimal value (horizontal shift), and definition or clearness (width) of our RNAT activity (figure 6). It also allows for comparisons between different RNAT, as well as being potentially predictive for non verified temperatures.
What is in the charts?
All our experiments were performed in E. coli K12. For each measure in a given temperature, the system was left until a point in which we were sure the O.D of the cell culture and the production of the protein were in equilibrium, steady, and uniform, before the cells population started to decrease (which we found was 17h). The charts in our wiki show the fluorescence of our constructions relative to a standard constitutively expressing RFP, with values that go from 0 to 1. We took as a standard for the RFUs the amount of fluorescence emitted by an E. coli K12 culture transformed with Part:BBa_E1010 (the amount of fluorescence emitted by our culture was calculated by dividing the fluorescence of the sample by the fluorescence of the standard). Fluorescence values of a non-fluorescent control (noise) were subtracted from each measurement before calculating the relative fluorescence.