Team:ETH Zurich/Experiments 5
From 2013.igem.org
| Line 40: | Line 40: | ||
[[File:Facs data.jpg|right|620px|thumb|<b>Figure 4: Single cell data of the wild type BBa_R0062 promoter vs. the pluxR mutant</b> The histogram plots of eGFP levels for each tested OHHL concentration, culturing condition and corresponding promoter.In orange experiments on agar plates. In black experiments in liquid cultures.On the top the data of the wild type luxR promoter. On the bottom the data of the luxR promoter variant.]] | [[File:Facs data.jpg|right|620px|thumb|<b>Figure 4: Single cell data of the wild type BBa_R0062 promoter vs. the pluxR mutant</b> The histogram plots of eGFP levels for each tested OHHL concentration, culturing condition and corresponding promoter.In orange experiments on agar plates. In black experiments in liquid cultures.On the top the data of the wild type luxR promoter. On the bottom the data of the luxR promoter variant.]] | ||
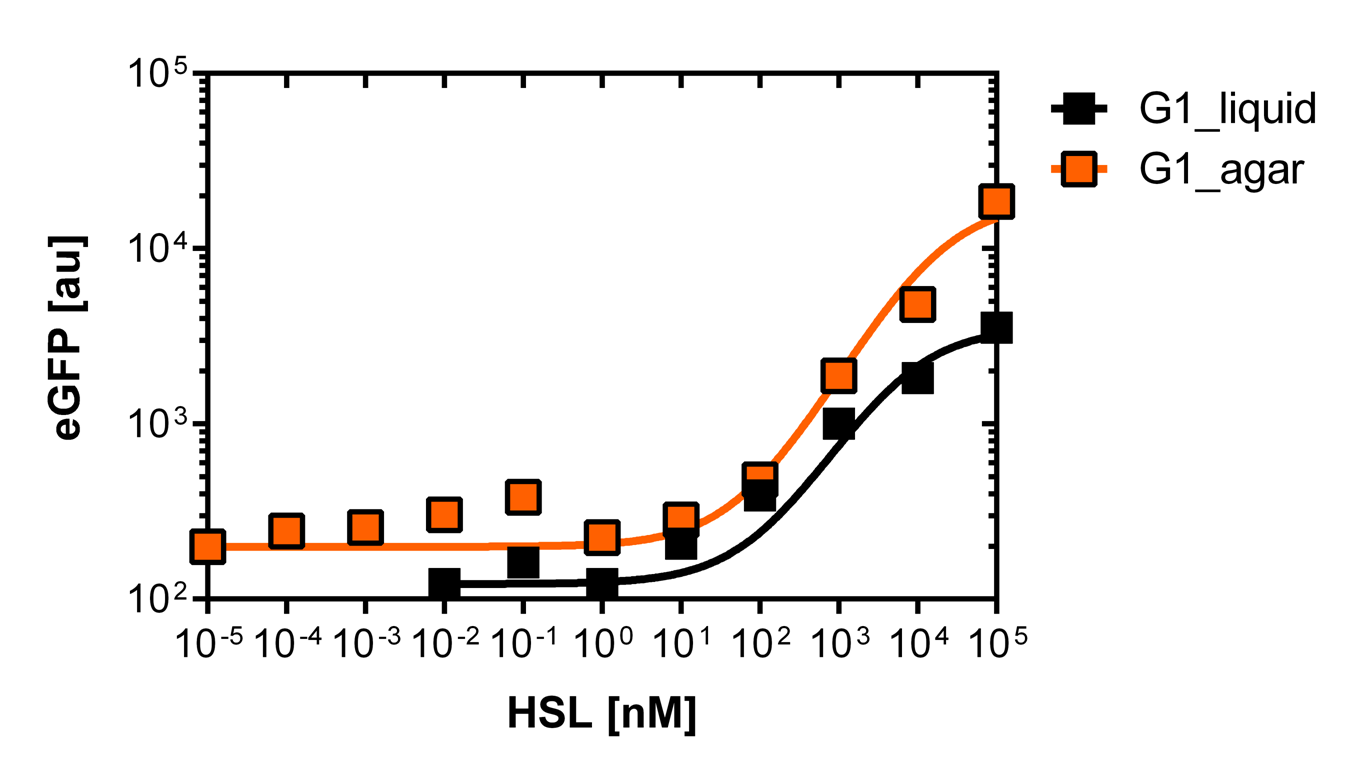
| - | [[File:G1_plate.png|400px|left|thumb|<b>Figure 5: Sensitivity curve of the G1 (pluxR variant BBa_K1216007) on agar plates and liquid culture</b><br>For the liquid culture we got :EC<sub>50</sub>=6482nM, R<sup>2</sup>=0.97, n=0.8;<br> For the agar plates we got :EC<sub>50</sub>= | + | [[File:G1_plate.png|400px|left|thumb|<b>Figure 5: Sensitivity curve of the G1 (pluxR variant BBa_K1216007) on agar plates and liquid culture</b><br>For the liquid culture we got :EC<sub>50</sub>=6482nM, R<sup>2</sup>=0.97, n=0.8;<br> For the agar plates we got :EC<sub>50</sub>=12'555nM, R<sup>2</sup>=0.93, n=0.8]] |
<br clear="all"/> | <br clear="all"/> | ||
<b>In liquid culture</b><br><br> | <b>In liquid culture</b><br><br> | ||
| - | <p align="justify">The direct plot of both sensitivity curves (Figure 6) shows the shifted sensitivity of the luxR promoter in comparison to the wild type BBa_R0062 promoter. The EC<sub>50</sub> shifted from 0.02nM for the wild type BBA_R0062 to 6'250 nM for the luxR variant promoter which is equal to a | + | <p align="justify">The direct plot of both sensitivity curves (Figure 6) shows the shifted sensitivity of the luxR promoter in comparison to the wild type BBa_R0062 promoter. The EC<sub>50</sub> shifted from 0.02nM for the wild type BBA_R0062 to 6'250 nM for the luxR variant promoter which is equal to a 300'000 fold increase.</p> |
<br clear="all"/> | <br clear="all"/> | ||
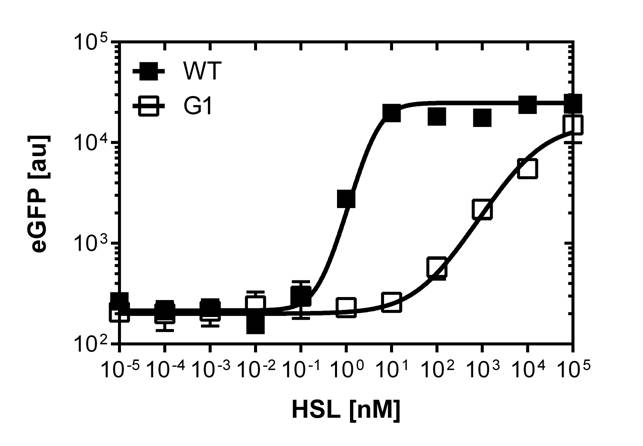
[[File:Comparison.png|left|400px|thumb|<b>Figure 6: Comparison of the Wild Type pluxR and the pluxR mutant sensitivity curves in liquid culture</b> using the BD LSRFortessa™ Flow Cytometer System<br>For the wild type :EC<sub>50</sub>=0.02nM, R<sup>2</sup>=0.84, n=1.7<br>For G1 we got :EC<sub>50</sub>=6482nM, R<sup>2</sup>=0.97, n=0.8]] | [[File:Comparison.png|left|400px|thumb|<b>Figure 6: Comparison of the Wild Type pluxR and the pluxR mutant sensitivity curves in liquid culture</b> using the BD LSRFortessa™ Flow Cytometer System<br>For the wild type :EC<sub>50</sub>=0.02nM, R<sup>2</sup>=0.84, n=1.7<br>For G1 we got :EC<sub>50</sub>=6482nM, R<sup>2</sup>=0.97, n=0.8]] | ||
| Line 51: | Line 51: | ||
<p align="justify"><b>On agar plates</b> | <p align="justify"><b>On agar plates</b> | ||
| - | <br><br>The direct plot of both sensitivity curves (Figure 6) shows the shifted sensitivity of the luxR promoter in comparison to the wild type BBa_R0062 promoter. The EC<sub>50</sub> shifted from 4.45nM for the wild type BBA_R0062 to | + | <br><br>The direct plot of both sensitivity curves (Figure 6) shows the shifted sensitivity of the luxR promoter in comparison to the wild type BBa_R0062 promoter. The EC<sub>50</sub> shifted from 4.45nM for the wild type BBA_R0062 to 12'555 nM for the luxR variant promoter which is equal to a 2800 fold increase. Therefore, comparing with the results from cells growing in liquid culture an increase of 220 and 2 times for wild type BBa_R0062 and pluxR variant respectively. If you want to know more about the methods please click [https://2013.igem.org/wiki/index.php?title=Team:ETH_Zurich/Materials#micro_plate here]<br><br></p> |
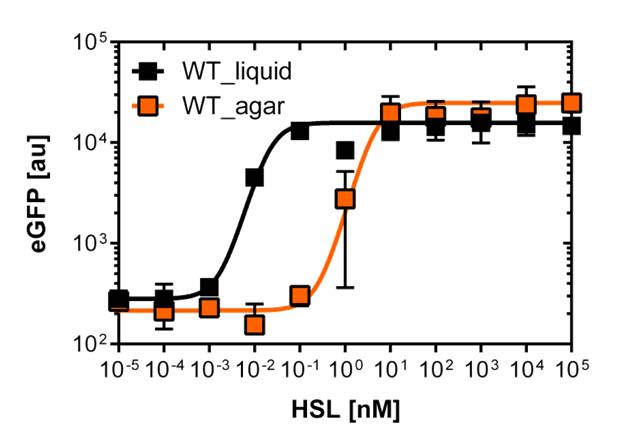
| - | [[File:WT_and_G1_on_agar_plates.jpg|400px|left|thumb|<b>Figure 7: Comparison of the sensivity of the wild type promoter and the mutated luxR promoter on agar plates</b><br>For the wild type we got :EC50=4.45nM, R2=0.80, n=1.7<br>For the pLuxR variant we got :EC<sub>50</sub>= | + | [[File:WT_and_G1_on_agar_plates.jpg|400px|left|thumb|<b>Figure 7: Comparison of the sensivity of the wild type promoter and the mutated luxR promoter on agar plates</b><br>For the wild type we got :EC50=4.45nM, R2=0.80, n=1.7<br>For the pLuxR variant we got :EC<sub>50</sub>=12'555nM, R2=0.93, n=0.8]] |
<br clear="all"/> | <br clear="all"/> | ||
Revision as of 20:46, 4 October 2013
High pass filters
The detection of different OHHL levels depending on the number of mines requires filters in our detection system. We decided to create a high pass filter library by doing site directed mutagenesis of the wild type [http://parts.igem.org/Part:BBa_R0062 BBa_R0062 PluxR]. The sites for mutagenesis were chosen from literature (2) (see Figure 1).
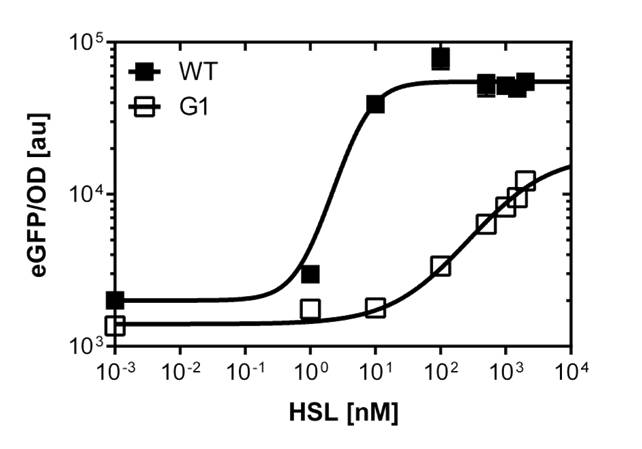
We were able to isolate a promoter having a lower expression level and being less sensitive than the wild type promoter (Figure 2). The promoter is called [http://parts.igem.org/Part:BBa_K1216007?title=Part:BBa_K1216007 PluxR variant BBa_K1216007] (G1, according to its initial position in the deep well plate).
Those two different promoters were used to create two high pass filter to detect different OHHL concentrations. The two promoters were analyzed not only in liquid culture by 96-well plate assays and single cell analysis (FACS) but also for E.coli on agar plate. Interestingly the EC50 sensitivity (half maximal effective concentration, EC50) is different between cells in liquid culture and cells on agar plates.
Site directed saturation mutagenesis PCR of the BBa_R0062 PluxR

We did site directed saturation mutagenisis of specific sites of the lux box according to the results taken from literature (2)(see Figure 2).
We mutated the promoter directly in the BBa_J09855 construct and cloned it into a eGFP gene as a reporter to be able to screen for differences in the dose response curves. In the end we isolated one mutated promoter which shows a shift in sensitivity (see section below)
Fluorescence data analysis
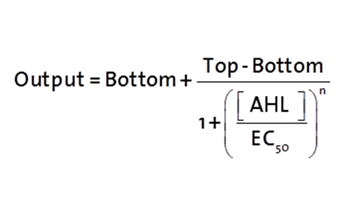
The fitting of the following graphs was performed using this equation :
Output = eGFP levels [au]
Top = maximal eGFP level [au]("full induction")
Bottom = minimal eGFP level [au](“leakiness”)
n = Hill coefficient (“cooperativity”)
EC50 = Half-maximal effective concentration (“sensitivity”)
[AHL]=OHHL concentration [nM]
Native OHHL tests using microtiter plates
In order to select mutated luxR promoters we need to know about the sensitivity.Thus, we carried out dose response cruves using the Tecan Infinite M200 plate reader. The test range was inspired form literature (1).
The results are shown in Figure 2.
Dose response curves of luxR promoters under single cell analysis
Liquid culture and agar plate OHHL detection comparison
Here we employed single cell flow cytometry to obtain high quality fluorescence data of each promoter under different OHHL concentrations.we started by analyzing cells grown in liquid culture, then we shifted to agar plate format in order to fit to our project. We obtained different EC50 values between cells in liquid culture and in agar plates for each luxR promoter (see Figure 3, 4 and 5).See methods for the protocol

In liquid culture
The direct plot of both sensitivity curves (Figure 6) shows the shifted sensitivity of the luxR promoter in comparison to the wild type BBa_R0062 promoter. The EC50 shifted from 0.02nM for the wild type BBA_R0062 to 6'250 nM for the luxR variant promoter which is equal to a 300'000 fold increase.
On agar plates
The direct plot of both sensitivity curves (Figure 6) shows the shifted sensitivity of the luxR promoter in comparison to the wild type BBa_R0062 promoter. The EC50 shifted from 4.45nM for the wild type BBA_R0062 to 12'555 nM for the luxR variant promoter which is equal to a 2800 fold increase. Therefore, comparing with the results from cells growing in liquid culture an increase of 220 and 2 times for wild type BBa_R0062 and pluxR variant respectively. If you want to know more about the methods please click here
Rational design of additional luxR variants with partial sensitivity recovery based on the G1 mutant
According to initial model predictions confirmed by successive experimental validation the G1 promoter sensitivity is too low to drive a significant response in the concentration gradient established by our sender cells.
We need a collection of promoters with a set of EC50 values between the wild type and G1 itself.
Since G1 has been obtained through two random mutations: 4T>A and 16C>G reverting one of the two, we reasoned, should result in a LuxR binding strength closer to the wild type.
To test this hypothesis we ordered oligos encompassing all the possible combination of single position mutants (See list) and plan to experimentally characterize, and eventually deposit in the registry, all the resulting pLux variants. In parallel we used degenerate oligos to generate a small library (16 members) containing all the combination of double mutants for the two G1 key position to verify if all the double mutants show similar EC50.
References
(1) M Geske G.D.,Evaluation of a focused library of N-aryl L-homoserine lactones reveals a new set of potent quorum sensing modulators.
(2) Luis Caetano A Mutational Analysis Defines Vibrio fischeri LuxR Binding Sites
 "
"


