Team:ETH Zurich/Experiments 2
From 2013.igem.org
| (13 intermediate revisions not shown) | |||
| Line 12: | Line 12: | ||
It is vital to know the exact diffusion pattern of AHL from the mine to have an idea of the placement of the colonies on the agar-mine field. By studying the diffusion time and distance of AHL around the sender, we were able to confirm the <b>honey-comb pattern</b> as the design of the mine grid. | It is vital to know the exact diffusion pattern of AHL from the mine to have an idea of the placement of the colonies on the agar-mine field. By studying the diffusion time and distance of AHL around the sender, we were able to confirm the <b>honey-comb pattern</b> as the design of the mine grid. | ||
| - | [[File:AHLdiffusion_5h.png| | + | [[File:AHLdiffusion_5h.png|550px|center|thumb| <b> Figure 2.1 Spiral diffusion experiment after 5h of incubation using the P<sub>Lac</sub>-LuxR-P<sub>LuxR</sub> (J09855) (P<sub>lac</sub> LuxR P<sub>luxR</sub>) construct and a GFP reporter.</b> On the left image (1) shows the picture at 395 nm excitation wavelength, and on the right image (2) the grey-scale of image (1). A drop of AHL (10 uM, 100 uM, 1 mM) was placed on the central colony.]] |
| - | [[File:AHLdiffusion_23h.png| | + | [[File:AHLdiffusion_23h.png|550px|center|thumb| <b> Figure 2.2 Spiral diffusion experiment after 23h of incubation using the P<sub>Lac</sub>-LuxR-P<sub>LuxR</sub> (J09855) construct and a GFP reporter.</b> On the left image (1) shows the picture at 395nm excitation wavelength, and on the right image (2) the greyscale of image (1). A drop of AHL (10 uM, 100uM, 1mM) was placed on the central colony.]] |
| - | <p align= "justify">The figures 2.1 and 2.2 show diffusion tests using receiver cells with GFP as reporter expressed with part(Plac-LuxR-pLuxR [http://parts.igem.org/Part:BBa_J09855 J09855]). As our sender cells | + | <p align= "justify">The figures 2.1 and 2.2 show diffusion tests using receiver cells with GFP as reporter expressed with part(Plac-LuxR-pLuxR [http://parts.igem.org/Part:BBa_J09855 J09855]). As our sender cells produce AHL, initial diffusion tests were performed to determine the AHL interaction in the non-mines. We studied the GFP expression in the non-mines in a spiral with increasing distance from the source of diffusion with 1uM, 10uM, 10mM. The origin of diffusion: a drop of AHL was pipetted on the central colony. Figure 2.1 after 5 h of incubation and Figure 2.2 after 23 h of incubation at 37°C. The progression of the AHL throught the agar was interpreted via the GFP fluorescence.(If you want to know more about the methods please click [https://2013.igem.org/Team:ETH_Zurich/Materials#spiraldiffusion here].) From these experiments, a preliminary idea about the diffusion time and distance of AHL was achieved. In order to determine of diffusion pattern in the game set-up, we tested the sender cells which produced AHL constitutively (see below Diffusion tests using sender-receiver set-up).</p> |
<br clear="all"> | <br clear="all"> | ||
<h1>Diffusion tests using sender-receiver set-up</h1> | <h1>Diffusion tests using sender-receiver set-up</h1> | ||
| - | <p align= "justify">In our biological circuit design, the sender | + | <p align= "justify">In our biological circuit design, the sender produces signalling molecule AHL. This molecule diffuses in and out of cells and thereby communicates between cells. As the AHL molecule diffuses it enters the neighboring non-mine cells. The non-mine cells are equipped with [https://2013.igem.org/Team:ETH_Zurich/Processing_2 promoters] that have different AHL sensitivities. This communication between mines and non-mines is vital in order to express the different output [https://2013.igem.org/Team:ETH_Zurich/Experiments_7 hydrolases.] This is because the hydrolases are expressed under the control of P<sub>LuxR</sub> promoters which are induced by AHL that are diffused from the mines. Hence diffusion tests were performed to test diffusion time and distance of AHL from the sender to the receiver.</p> |
<br clear="all"> | <br clear="all"> | ||
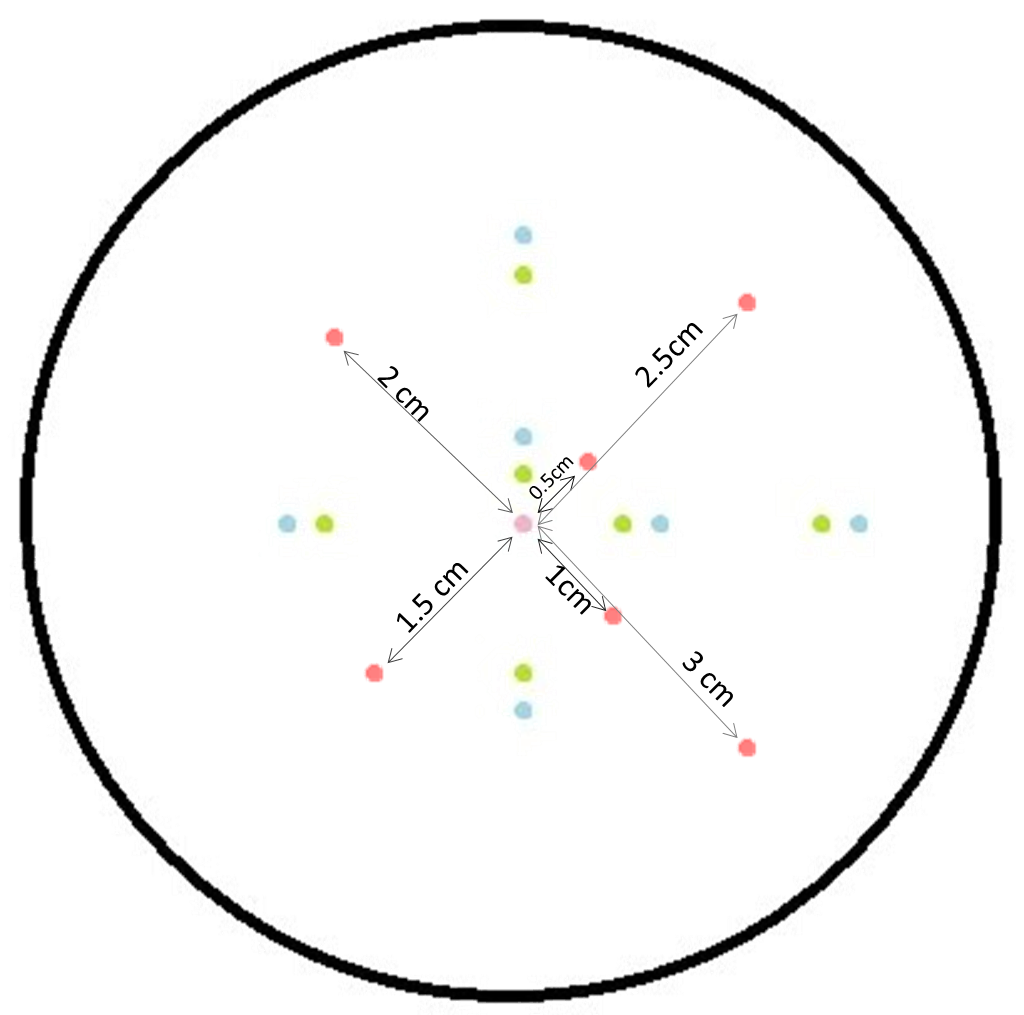
[[File:J23100_labelled_sender_diffusion.png|300px|left|thumb| <b> Figure 3.1 Schematic diagram of sender-GFP receiver in a sprial pattern to study diffusion of AHL from sender to receiver </b>]] | [[File:J23100_labelled_sender_diffusion.png|300px|left|thumb| <b> Figure 3.1 Schematic diagram of sender-GFP receiver in a sprial pattern to study diffusion of AHL from sender to receiver </b>]] | ||
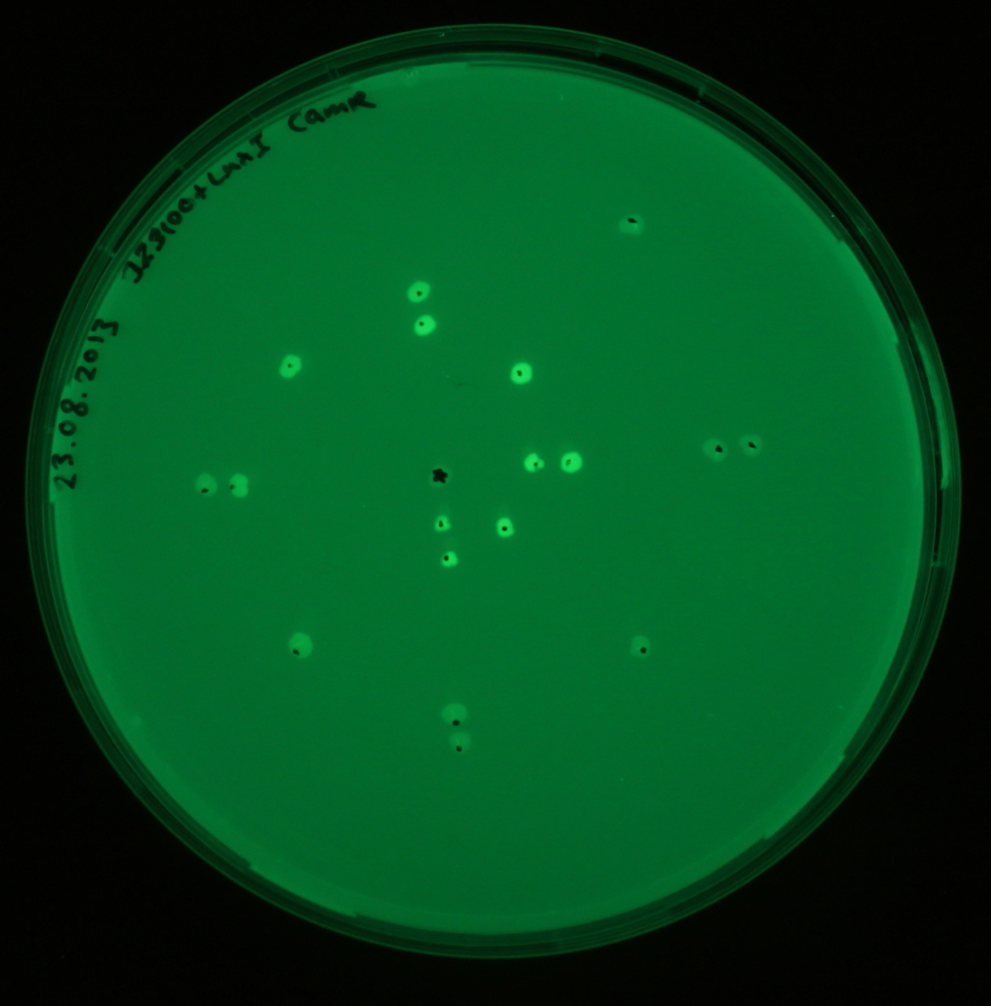
[[File:Diffusion_GFP_j23100_angela.png|300px|right|thumb| <b> Figure 3.2 GFP Fluorescence image of Spiral diffusion experiment using the Plac-LuxR-pLuxR (J09855) construct and a GFP reporter </b>]] | [[File:Diffusion_GFP_j23100_angela.png|300px|right|thumb| <b> Figure 3.2 GFP Fluorescence image of Spiral diffusion experiment using the Plac-LuxR-pLuxR (J09855) construct and a GFP reporter </b>]] | ||
| - | <p align= "justify">The figure to the left shows the schematic diagram of the placement of the sender colony in the center and GFP receiver at several distances. The GFP receivers are placed at different distances from the sender colony. As labelled in the figure the GFP receivers are placed at 0. | + | <p align= "justify">The figure to the left shows the schematic diagram of the placement of the sender colony in the center and GFP receiver at several distances. The GFP receivers are placed at different distances from the sender colony. As labelled in the figure the GFP receivers are placed at 0.5 cm, 1 cm, 1.5 cm, 2 cm, 2.5 cm and 3 cm from the sender colony. The red dot is the sender colony and the green dots are the controls without GFP. The blue and green colors are plated as replicates with in the same plates as front and back colonies. By checking the florescence in the receiver colonies, we were able to find the diffusion distance from the sender colonies. As sources of AHL, the sender colonies were equipped with [[http://parts.igem.org/Part:BBa_J23110 constitutive promoters] that produced [http://parts.igem.org/Part:BBa_K805016 luxI] and hence [https://2013.igem.org/Team:ETH_Zurich/pre_proc AHL]. The picture to the right shows the fluorescence image of the experiment after an overnight incubation at 37°C.</p> |
<br clear="all"> | <br clear="all"> | ||
<br> | <br> | ||
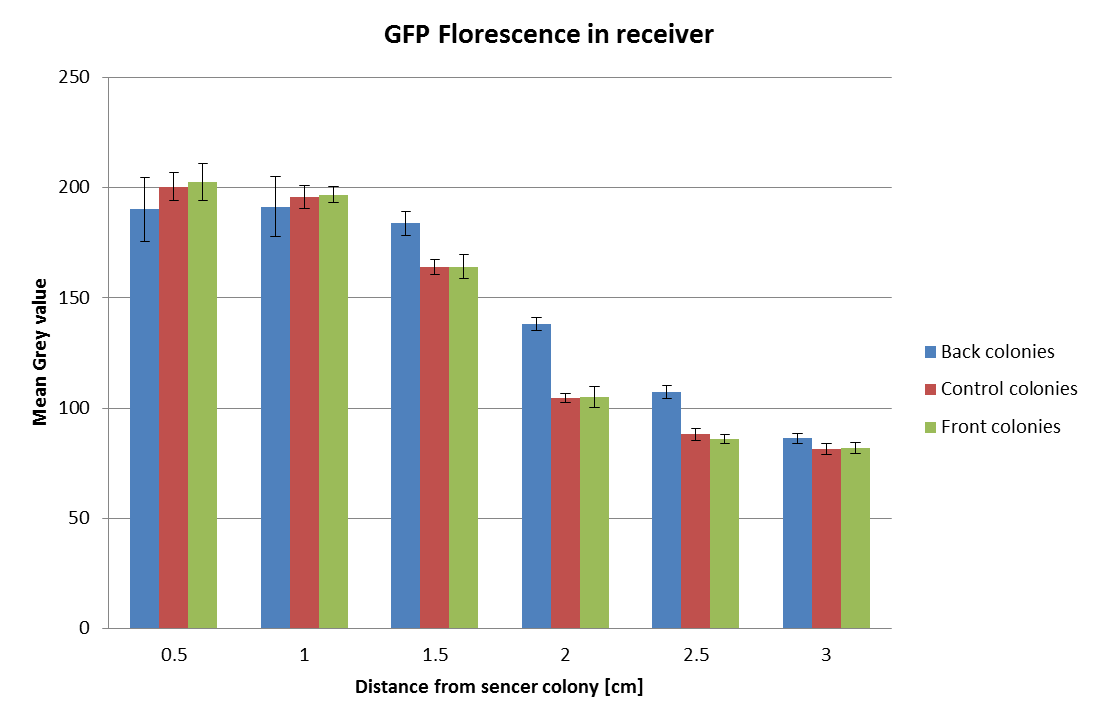
| - | The GFP fluorescence from the above experiment was analyzed with ImageJ. The gray-scale values of the fluorescence was determined for each of the three colonies at each distance. The mean of the grey-scale fluorescence was computed and plotted against distance of the GFP receivers from the sender colony. | + | The GFP fluorescence from the above experiment was analyzed with ImageJ. The gray-scale values of the fluorescence was determined for each of the three colonies at each distance. The mean of the grey-scale fluorescence was computed and plotted against distance of the GFP receivers from the sender colony. From this experiment we were able to clearly identify a distance of nearly 1-2 cm ideal for the diffusion of AHL from the sender to the receiver. |
| - | [[File: | + | [[File:Last_minute_y_angela.png|500px|center|thumb|<b>Figure 3.3 Graph of florescence observed in the GFP receivers plotted with distance from the sender colony</b>]] |
<br clear="all"> | <br clear="all"> | ||
| Line 35: | Line 35: | ||
<h1>Diffusion tests of AHL in double layer agar</h1> | <h1>Diffusion tests of AHL in double layer agar</h1> | ||
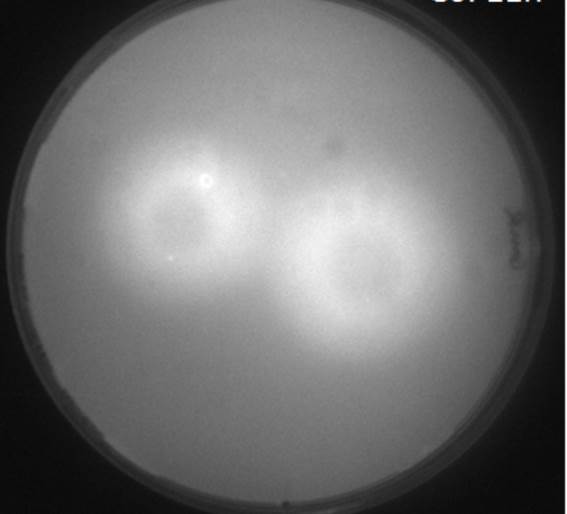
| - | [[File:Diffusion_C6.jpg|right|250px|thumb|<b>Figure | + | [[File:Diffusion_C6.jpg|right|250px|thumb|<b>Figure 4.1: Scanned image of GFP Fluorescence of AHL Diffusion with GFP receiver cells with two senders</b>]] |
<p align= "justify"> | <p align= "justify"> | ||
In order to visualize the AHL diffusion, experiments were carried out, using GFP as reporter. We started with using the part Plac-LuxR-pLuxR [http://parts.igem.org/Part:BBa_J09855 BBa_J09855] cloned with GFP as our receiver. We tested the sender with part [http://parts.igem.org/Part:BBa_K805016 BBa_K805016] under a constitutive promoter. double-layer agar tests [https://2013.igem.org/Team:ETH_Zurich/Materials (See protocol)] were performed with the GFP receiver cells spread evenly as a top layer agar, and the 1.5 μl sender cells as source of signal AHL. The diffusion pattern was measured over '''12 hours''' with a molecular imaging system. The distance of diffusion was noted as '''1.5 cm''' as the radial diffusion distance across the sender colony. | In order to visualize the AHL diffusion, experiments were carried out, using GFP as reporter. We started with using the part Plac-LuxR-pLuxR [http://parts.igem.org/Part:BBa_J09855 BBa_J09855] cloned with GFP as our receiver. We tested the sender with part [http://parts.igem.org/Part:BBa_K805016 BBa_K805016] under a constitutive promoter. double-layer agar tests [https://2013.igem.org/Team:ETH_Zurich/Materials (See protocol)] were performed with the GFP receiver cells spread evenly as a top layer agar, and the 1.5 μl sender cells as source of signal AHL. The diffusion pattern was measured over '''12 hours''' with a molecular imaging system. The distance of diffusion was noted as '''1.5 cm''' as the radial diffusion distance across the sender colony. | ||
The time and distance data from these experiments were used for the [https://2013.igem.org/Team:ETH_Zurich/Modeling/Reaction_Diffusion_AHL spatio-temporal model] of the AHL diffusion. </p> | The time and distance data from these experiments were used for the [https://2013.igem.org/Team:ETH_Zurich/Modeling/Reaction_Diffusion_AHL spatio-temporal model] of the AHL diffusion. </p> | ||
<br clear="all"/> | <br clear="all"/> | ||
| - | [[File:Diffusion.jpg|left|200px|thumb|<b>Figure | + | [[File:Diffusion.jpg|left|200px|thumb|<b>Figure 4.2: Scanned image of GFP fluorescence of AHL Diffusion test to check diffusion time and distance</b> ]] |
| - | [[File:GFP_profile.png|right|360px|thumb|<b>Figure | + | [[File:GFP_profile.png|right|360px|thumb|<b>Figure 4.3: <i>ImageJ</i> analysis of fluorescence peak showing radial diffusion around one sender colony</b>]] |
<p align= "justify">The image to the left shows the GFP fluorescence in a double layer agar experiment after 11 hours. In order to quantify the time and distance of diffusion of AHL from the sender to the GFP receiver, we analyzed the scanned image of the plate with the image processing program <i>ImageJ</i> . The analysis from <i>ImageJ</i> is shown in the picture to the right. The picture shows the GFP fluorescence in gray scale with distance in inches. The distance of diffusion can be seen as 1,2 inches, that is nearly 3 cm. Hence, for the further experiments, the colonies were placed apart from each other at a distance of '''1.5 cm''' in a hexagonal manner.</p> | <p align= "justify">The image to the left shows the GFP fluorescence in a double layer agar experiment after 11 hours. In order to quantify the time and distance of diffusion of AHL from the sender to the GFP receiver, we analyzed the scanned image of the plate with the image processing program <i>ImageJ</i> . The analysis from <i>ImageJ</i> is shown in the picture to the right. The picture shows the GFP fluorescence in gray scale with distance in inches. The distance of diffusion can be seen as 1,2 inches, that is nearly 3 cm. Hence, for the further experiments, the colonies were placed apart from each other at a distance of '''1.5 cm''' in a hexagonal manner.</p> | ||
<br clear="all"/> | <br clear="all"/> | ||
Latest revision as of 00:22, 29 October 2013
Contents |
Signaling molecule AHL
N-3-Oxo-Hexanoyl-l-Homoserine Lactone belongs to the family of Acylated Homoserine Lactones (AHL).
In our project , we use the LuxI-LuxR quorum sensing system to drive the signal from the sender to the receiver cells. The LuxI sender construct produces AHL. The AHL diffuses in the agar to reach the receiver cells containing LuxR which in turn triggers the hydrolase expression in the receiver colonies. The receiver cells comprise promoters that are tuned to express specific hydrolases depending on the amount of incoming AHL. The AHL diffusion is very important in that it drives the enzyme (hydrolase) expression in the non-mines depending on different high pass filters. The AHL concentration processed by the receiver cells depends on the number of mine colonies. Through an enzyme-susbtrate reaction that generates a colored product the player obtains information about the number of mines surrounding a non-mine.
Diffusion tests using AHL and a spiral receiver cell set-up
It is vital to know the exact diffusion pattern of AHL from the mine to have an idea of the placement of the colonies on the agar-mine field. By studying the diffusion time and distance of AHL around the sender, we were able to confirm the honey-comb pattern as the design of the mine grid.
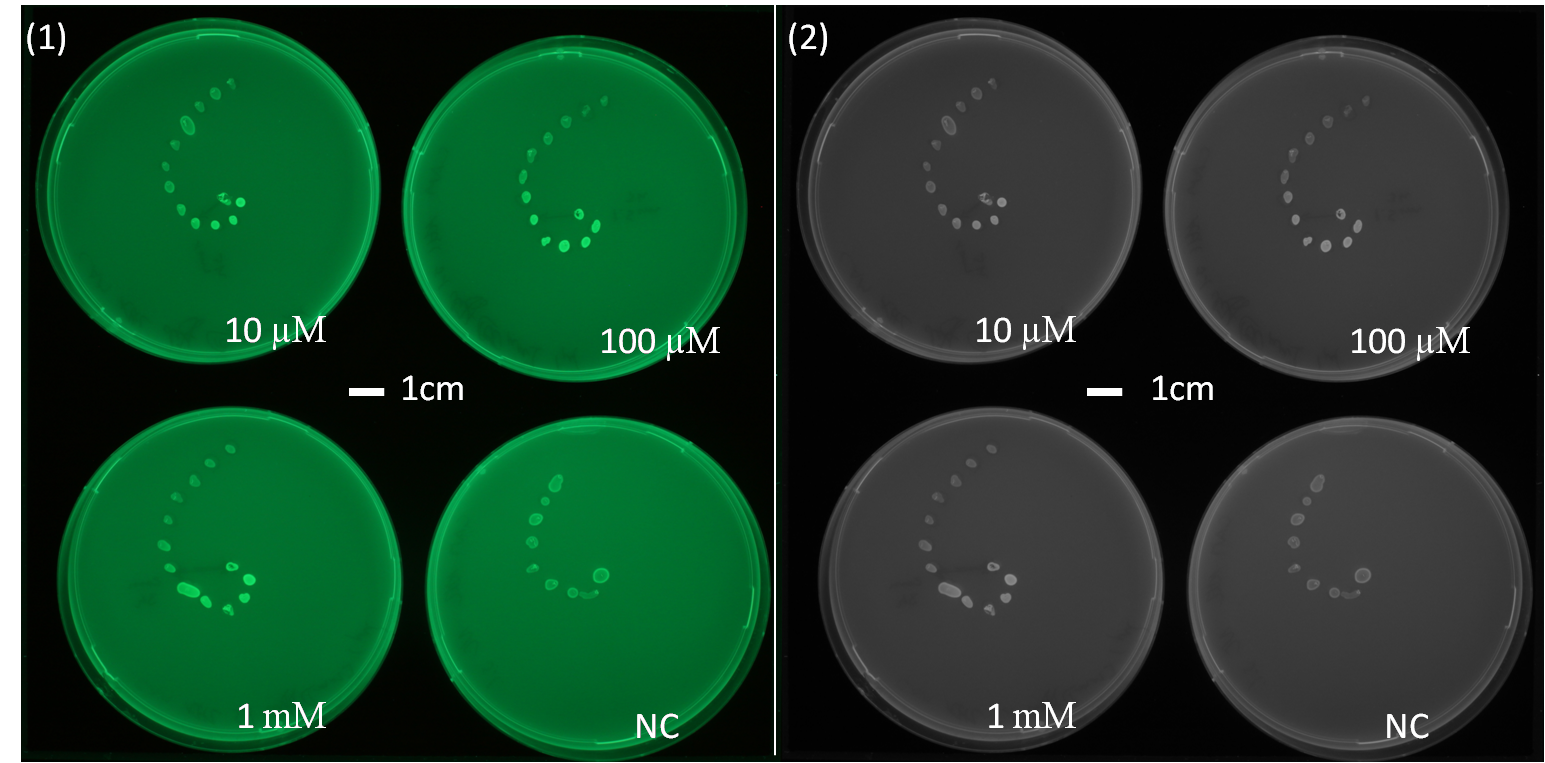
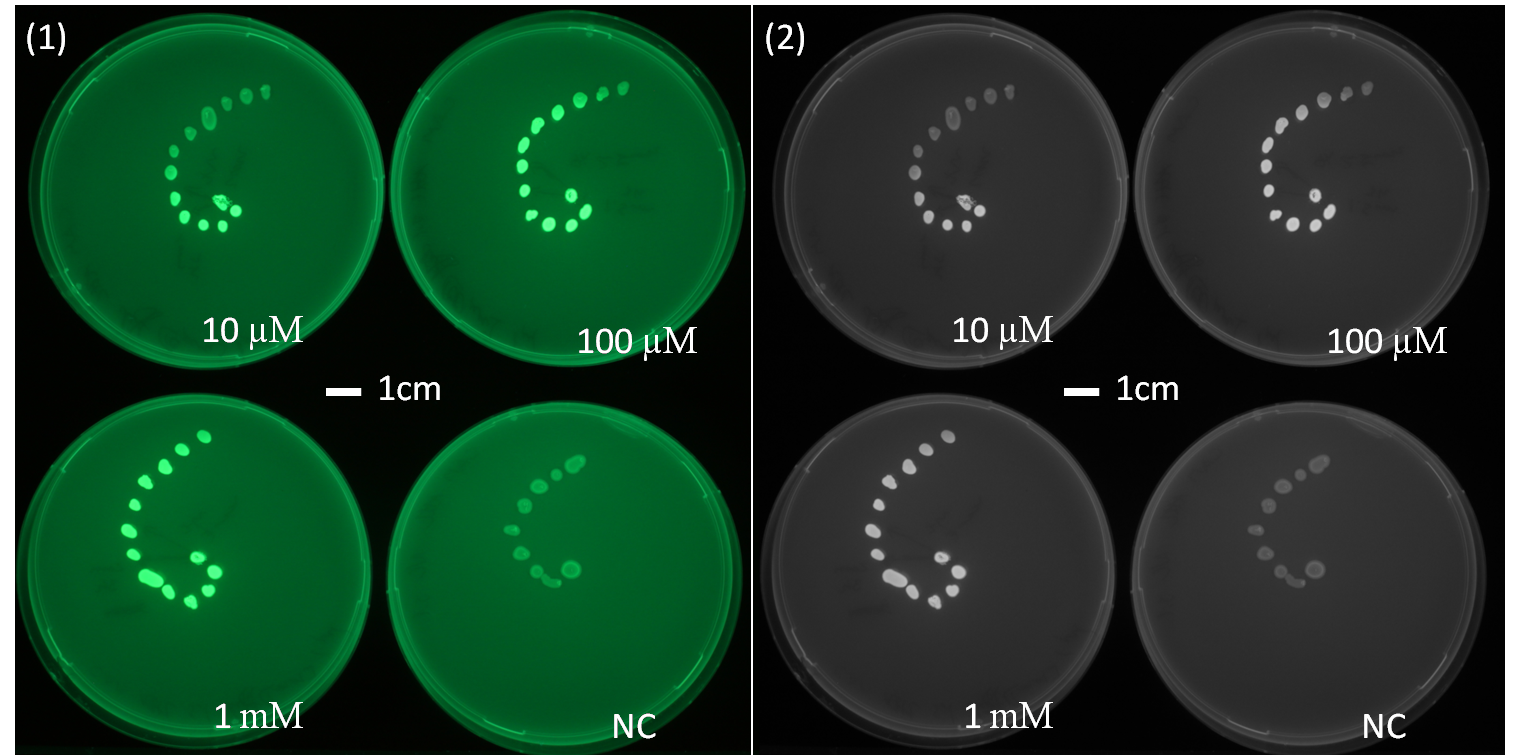
The figures 2.1 and 2.2 show diffusion tests using receiver cells with GFP as reporter expressed with part(Plac-LuxR-pLuxR [http://parts.igem.org/Part:BBa_J09855 J09855]). As our sender cells produce AHL, initial diffusion tests were performed to determine the AHL interaction in the non-mines. We studied the GFP expression in the non-mines in a spiral with increasing distance from the source of diffusion with 1uM, 10uM, 10mM. The origin of diffusion: a drop of AHL was pipetted on the central colony. Figure 2.1 after 5 h of incubation and Figure 2.2 after 23 h of incubation at 37°C. The progression of the AHL throught the agar was interpreted via the GFP fluorescence.(If you want to know more about the methods please click here.) From these experiments, a preliminary idea about the diffusion time and distance of AHL was achieved. In order to determine of diffusion pattern in the game set-up, we tested the sender cells which produced AHL constitutively (see below Diffusion tests using sender-receiver set-up).
Diffusion tests using sender-receiver set-up
In our biological circuit design, the sender produces signalling molecule AHL. This molecule diffuses in and out of cells and thereby communicates between cells. As the AHL molecule diffuses it enters the neighboring non-mine cells. The non-mine cells are equipped with promoters that have different AHL sensitivities. This communication between mines and non-mines is vital in order to express the different output hydrolases. This is because the hydrolases are expressed under the control of PLuxR promoters which are induced by AHL that are diffused from the mines. Hence diffusion tests were performed to test diffusion time and distance of AHL from the sender to the receiver.
The figure to the left shows the schematic diagram of the placement of the sender colony in the center and GFP receiver at several distances. The GFP receivers are placed at different distances from the sender colony. As labelled in the figure the GFP receivers are placed at 0.5 cm, 1 cm, 1.5 cm, 2 cm, 2.5 cm and 3 cm from the sender colony. The red dot is the sender colony and the green dots are the controls without GFP. The blue and green colors are plated as replicates with in the same plates as front and back colonies. By checking the florescence in the receiver colonies, we were able to find the diffusion distance from the sender colonies. As sources of AHL, the sender colonies were equipped with [[http://parts.igem.org/Part:BBa_J23110 constitutive promoters] that produced [http://parts.igem.org/Part:BBa_K805016 luxI] and hence AHL. The picture to the right shows the fluorescence image of the experiment after an overnight incubation at 37°C.
The GFP fluorescence from the above experiment was analyzed with ImageJ. The gray-scale values of the fluorescence was determined for each of the three colonies at each distance. The mean of the grey-scale fluorescence was computed and plotted against distance of the GFP receivers from the sender colony. From this experiment we were able to clearly identify a distance of nearly 1-2 cm ideal for the diffusion of AHL from the sender to the receiver.
Diffusion tests of AHL in double layer agar
In order to visualize the AHL diffusion, experiments were carried out, using GFP as reporter. We started with using the part Plac-LuxR-pLuxR [http://parts.igem.org/Part:BBa_J09855 BBa_J09855] cloned with GFP as our receiver. We tested the sender with part [http://parts.igem.org/Part:BBa_K805016 BBa_K805016] under a constitutive promoter. double-layer agar tests (See protocol) were performed with the GFP receiver cells spread evenly as a top layer agar, and the 1.5 μl sender cells as source of signal AHL. The diffusion pattern was measured over 12 hours with a molecular imaging system. The distance of diffusion was noted as 1.5 cm as the radial diffusion distance across the sender colony. The time and distance data from these experiments were used for the spatio-temporal model of the AHL diffusion.
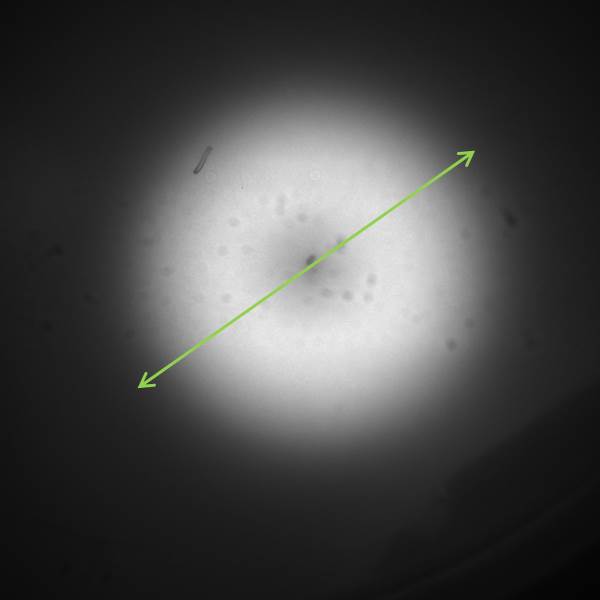
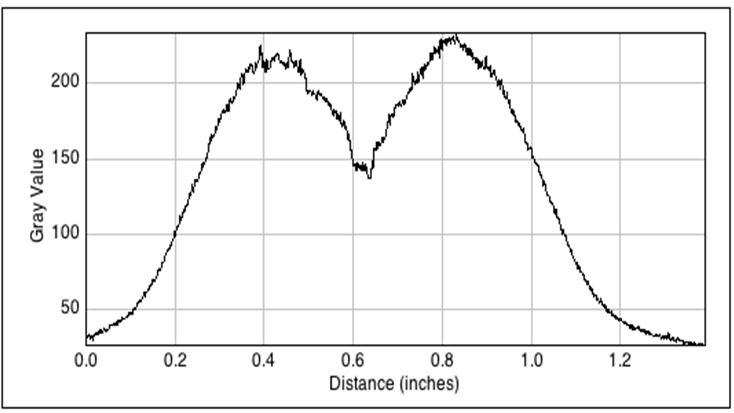
The image to the left shows the GFP fluorescence in a double layer agar experiment after 11 hours. In order to quantify the time and distance of diffusion of AHL from the sender to the GFP receiver, we analyzed the scanned image of the plate with the image processing program ImageJ . The analysis from ImageJ is shown in the picture to the right. The picture shows the GFP fluorescence in gray scale with distance in inches. The distance of diffusion can be seen as 1,2 inches, that is nearly 3 cm. Hence, for the further experiments, the colonies were placed apart from each other at a distance of 1.5 cm in a hexagonal manner.
 "
"

