Team:Colombia Uniandes/Implementation
From 2013.igem.org
Trafalmejo (Talk | contribs) |
Trafalmejo (Talk | contribs) |
||
| (25 intermediate revisions not shown) | |||
| Line 1: | Line 1: | ||
{{Http://2013.igem.org/Team:Colombia Uniandes/Bootstrap}} | {{Http://2013.igem.org/Team:Colombia Uniandes/Bootstrap}} | ||
| + | <html> | ||
| + | <div class="container"> | ||
| + | <div class="span11"> | ||
| + | <h2><center> Implementation </center></h2> | ||
| + | <div class="accordion" id="accordion2"> | ||
| + | <div class="accordion-group"> | ||
| + | <div class="accordion-heading"> | ||
| + | <a class="accordion-toggle" data-toggle="collapse" data-parent="#accordion2" href="#collapseOne"> | ||
| + | Nickel removal system | ||
| + | </a> | ||
| + | </div> | ||
| + | <div id="collapseOne" class="accordion-body collapse"> | ||
| + | <div class="accordion-inner"> | ||
| + | <h3>Nickel removal system</h3> | ||
| + | </html> | ||
| + | For the nickel removal system we wanted our bacteria to be able to detect and remove nickel when its concentration is above the limits accepted by the government. After reading all the legal policies of contaminated water in Colombia, USA and Latin America it was found that the maximum legal concentration of nickel approved is '''0.1mg/L'''. Considering this value we proved the mathematical model and design our circuit. | ||
<html> | <html> | ||
| + | </div> | ||
| + | </div> | ||
| + | </div> | ||
| + | <div class="accordion-group"> | ||
| + | <div class="accordion-heading"> | ||
| + | <a class="accordion-toggle" data-toggle="collapse" data-parent="#accordion2" href="#collapseTwo"> | ||
| + | Glucocorticoid detection system | ||
| + | </a> | ||
| + | </div> | ||
| + | <div id="collapseTwo" class="accordion-body collapse"> | ||
| + | <div class="accordion-inner"> | ||
| + | <h3> Glucocorticoid detection system</h3> | ||
| - | + | The Glucocorticoid (GC) detection system can be used to detect stress in any mammal from a sample of tissue. While doing the mathematical model we wanted to establish the base line for the levels of GC that our system was going to be able detect. We wanted that the base line to be used as a reference point of stress in all mammals. Nevertheless, it was found that the stress level of GC varies a lot depending on the animal and the tissue sample. | |
| - | + | ||
| - | + | ||
| - | + | ||
| - | + | ||
| - | + | ||
| - | + | To the mathematical model this variation of stress levels was a problem, because we needed to test the model with an established threshold and see if the system was turned on at this value. In order to solve the problem we decided to test for the model with stress condition in humans, given the fact that the permit of the Ethical Committee were easier to obtain for human samples than animal samples, making the lab verification more feasible. | |
| + | |||
| + | <h4> Determination of the stress threshold in Humans </h4> | ||
| + | |||
| + | In humans, changes in plasma cortisol levels are currently linked to stressful conditions. Nevertheless as cortisol levels vary within a circadian rhythm, in order to identify whereas if someone is stressed or not, it is necessary to identify normal or base conditions for each hour of the day. This information will act as the threshold for our system. | ||
| + | |||
| + | <div class="center" style="width: auto; margin-left: auto; margin-right: auto;"> | ||
| + | Table1. Baseline of Cortisol levels within different hours of the Day for Men and Women obtained from curve in (Kupfer, 1996) | ||
</div> | </div> | ||
| + | </html> | ||
| + | [[File:StressLevels.jpg|400x450px|center]] | ||
| + | <html> | ||
| + | According to (Kupfer, 1996) Acute stress conditions elevate mean plasma cortisol levels in every hour of the day between 20 to 50%. According to this information we created a profile for male, female and mean of an increase of 20% and 50% in cortisol levels. This will give us an interval to determine whereas the subject of experimentation is stressed. | ||
| + | |||
| + | <div class="center" style="width: auto; margin-left: auto; margin-right: auto;"> | ||
| + | Table2. Stress related cortisol levels form male, female and mean. (Kupfer, 1996) | ||
| + | </div> | ||
| + | </html> | ||
| + | [[File:StressLevels1.jpg|500x550px|center]] | ||
| + | |||
| + | To summarize this information we plotted the values for each sample (Male, Female and Mean) comparing normal values with both increases (20% and 50%). The area within the curves of 20% increase and 50% increase is the area in which our system will determine the presence of stress. | ||
| + | |||
| + | [[File:StressLevelsMales.jpg|500x550px|center]] | ||
| + | <div class="center" style="width: auto; margin-left: auto; margin-right: auto;"> | ||
| + | Figure 1. Scatter Plot of changes in Cortisol Levels (nmol/L) in Males, depending on the hour of the day. | ||
| + | </div> | ||
| + | |||
| + | |||
| + | [[File:StressLevelsFemales.jpg|500x550px|center]] | ||
| + | |||
| + | <div class="center" style="width: auto; margin-left: auto; margin-right: auto;"> | ||
| + | Figure 2. Scatter Plot of changes in Cortisol Levels (nmol/L) in Females, depending on the hour of the day. | ||
| + | </div> | ||
| + | |||
| + | In order to use our system to detect stress in both males and females, we’ll use the mean values between them to establish the threshold. Thus, we’ll use the shaded area within the curves identified in figure 4. | ||
| + | |||
| + | [[File:StressLevelsMean.jpg|500x550px|center]] | ||
| + | <div class="center" style="width: auto; margin-left: auto; margin-right: auto;"> | ||
| + | Figure 3. Scatter Plot of changes in Cortisol Levels (nmol/L) in the Mean between Males and Females, depending on the hour of the day with shaded area of threshold identified. | ||
| + | </div> | ||
| + | |||
| + | As seen in the Figures above the GC concentration varies a lot during the day and the concentration of GC during stress conditions is approximately 30% more than the normal values. For testing the model we chose a normal value of 155nM, which is the average concentration of GC in blood during daytime (8am-5pm) and the activation of the system was tested for GC concentration 30% above this value. | ||
| + | |||
| + | Our circuit was constructed to turned be off at 155nM con GC and turned on at 200nM approximately. This means that for sample different from humans the base line needs to be found and depending on the results a some dilutions of the sample should be done. | ||
| + | <html> | ||
| + | |||
| + | </div> | ||
| + | </div> | ||
| + | </div> | ||
| + | <div class="accordion-group"> | ||
| + | <div class="accordion-heading"> | ||
| + | <a class="accordion-toggle" data-toggle="collapse" data-parent="#accordion3" href="#collapseThree"> | ||
| + | References | ||
| + | </a> | ||
| + | </div> | ||
| + | <div id="collapseThree" class="accordion-body collapse"> | ||
| + | <div class="accordion-inner"> | ||
| + | <h3>References:</h3> | ||
| + | Kupfer, J. (1996). Effects of Gender and Age on the Levels Rhythmicity. Journal of Clinical Endocrinology and Metabolism, 2468–2473. </div> | ||
| + | </div> | ||
| + | </div> | ||
| + | </div> | ||
| + | </div> | ||
| + | </div> | ||
</html> | </html> | ||
Latest revision as of 15:26, 26 September 2013
Implementation
Nickel removal system
For the nickel removal system we wanted our bacteria to be able to detect and remove nickel when its concentration is above the limits accepted by the government. After reading all the legal policies of contaminated water in Colombia, USA and Latin America it was found that the maximum legal concentration of nickel approved is 0.1mg/L. Considering this value we proved the mathematical model and design our circuit.
Glucocorticoid detection system
The Glucocorticoid (GC) detection system can be used to detect stress in any mammal from a sample of tissue. While doing the mathematical model we wanted to establish the base line for the levels of GC that our system was going to be able detect. We wanted that the base line to be used as a reference point of stress in all mammals. Nevertheless, it was found that the stress level of GC varies a lot depending on the animal and the tissue sample.
To the mathematical model this variation of stress levels was a problem, because we needed to test the model with an established threshold and see if the system was turned on at this value. In order to solve the problem we decided to test for the model with stress condition in humans, given the fact that the permit of the Ethical Committee were easier to obtain for human samples than animal samples, making the lab verification more feasible.
Determination of the stress threshold in Humans
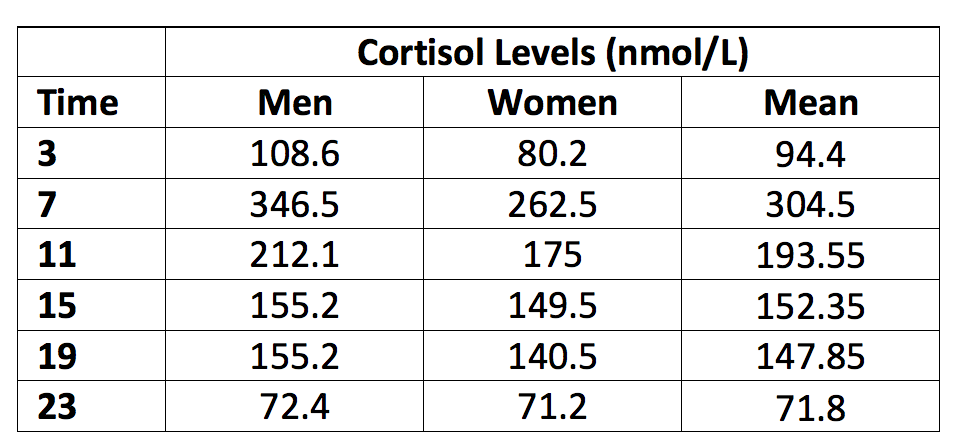
In humans, changes in plasma cortisol levels are currently linked to stressful conditions. Nevertheless as cortisol levels vary within a circadian rhythm, in order to identify whereas if someone is stressed or not, it is necessary to identify normal or base conditions for each hour of the day. This information will act as the threshold for our system.
Table1. Baseline of Cortisol levels within different hours of the Day for Men and Women obtained from curve in (Kupfer, 1996)
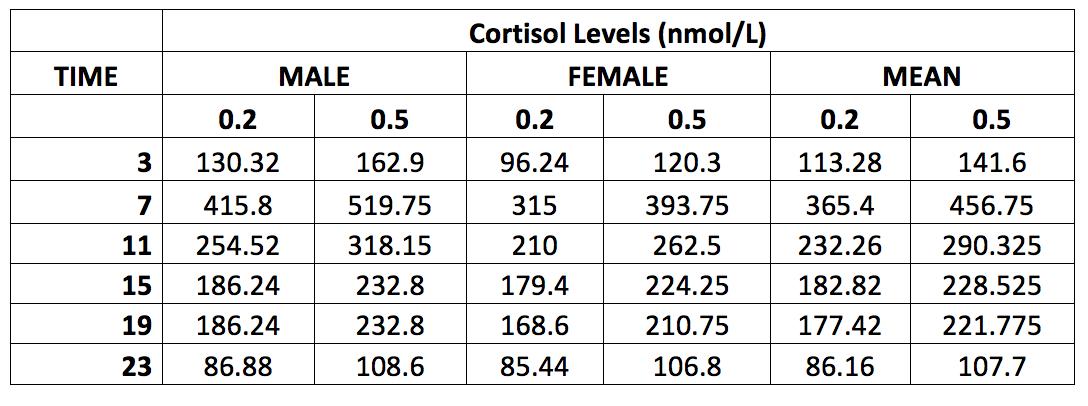
According to (Kupfer, 1996) Acute stress conditions elevate mean plasma cortisol levels in every hour of the day between 20 to 50%. According to this information we created a profile for male, female and mean of an increase of 20% and 50% in cortisol levels. This will give us an interval to determine whereas the subject of experimentation is stressed.
Table2. Stress related cortisol levels form male, female and mean. (Kupfer, 1996)
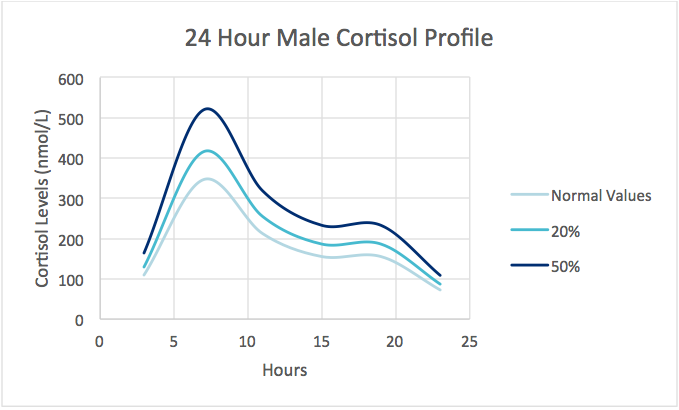
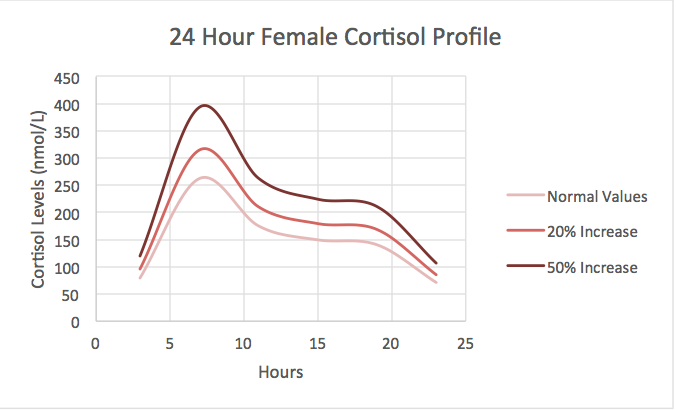
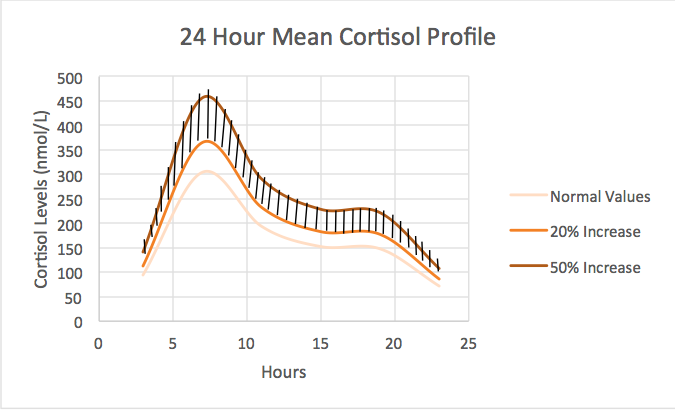
To summarize this information we plotted the values for each sample (Male, Female and Mean) comparing normal values with both increases (20% and 50%). The area within the curves of 20% increase and 50% increase is the area in which our system will determine the presence of stress.
Figure 1. Scatter Plot of changes in Cortisol Levels (nmol/L) in Males, depending on the hour of the day.
Figure 2. Scatter Plot of changes in Cortisol Levels (nmol/L) in Females, depending on the hour of the day.
In order to use our system to detect stress in both males and females, we’ll use the mean values between them to establish the threshold. Thus, we’ll use the shaded area within the curves identified in figure 4.
Figure 3. Scatter Plot of changes in Cortisol Levels (nmol/L) in the Mean between Males and Females, depending on the hour of the day with shaded area of threshold identified.
As seen in the Figures above the GC concentration varies a lot during the day and the concentration of GC during stress conditions is approximately 30% more than the normal values. For testing the model we chose a normal value of 155nM, which is the average concentration of GC in blood during daytime (8am-5pm) and the activation of the system was tested for GC concentration 30% above this value.
Our circuit was constructed to turned be off at 155nM con GC and turned on at 200nM approximately. This means that for sample different from humans the base line needs to be found and depending on the results a some dilutions of the sample should be done.
References:
Kupfer, J. (1996). Effects of Gender and Age on the Levels Rhythmicity. Journal of Clinical Endocrinology and Metabolism, 2468–2473.
Implementation
Nickel removal system
For the nickel removal system we wanted our bacteria to be able to detect and remove nickel when its concentration is above the limits accepted by the government. After reading all the legal policies of contaminated water in Colombia, USA and Latin America it was found that the maximum legal concentration of nickel approved is 0.1mg/L. Considering this value we proved the mathematical model and design our circuit.Glucocorticoid detection system
The Glucocorticoid (GC) detection system can be used to detect stress in any mammal from a sample of tissue. While doing the mathematical model we wanted to establish the base line for the levels of GC that our system was going to be able detect. We wanted that the base line to be used as a reference point of stress in all mammals. Nevertheless, it was found that the stress level of GC varies a lot depending on the animal and the tissue sample. To the mathematical model this variation of stress levels was a problem, because we needed to test the model with an established threshold and see if the system was turned on at this value. In order to solve the problem we decided to test for the model with stress condition in humans, given the fact that the permit of the Ethical Committee were easier to obtain for human samples than animal samples, making the lab verification more feasible.Determination of the stress threshold in Humans
In humans, changes in plasma cortisol levels are currently linked to stressful conditions. Nevertheless as cortisol levels vary within a circadian rhythm, in order to identify whereas if someone is stressed or not, it is necessary to identify normal or base conditions for each hour of the day. This information will act as the threshold for our system.According to (Kupfer, 1996) Acute stress conditions elevate mean plasma cortisol levels in every hour of the day between 20 to 50%. According to this information we created a profile for male, female and mean of an increase of 20% and 50% in cortisol levels. This will give us an interval to determine whereas the subject of experimentation is stressed.
To summarize this information we plotted the values for each sample (Male, Female and Mean) comparing normal values with both increases (20% and 50%). The area within the curves of 20% increase and 50% increase is the area in which our system will determine the presence of stress.
Figure 1. Scatter Plot of changes in Cortisol Levels (nmol/L) in Males, depending on the hour of the day.
Figure 2. Scatter Plot of changes in Cortisol Levels (nmol/L) in Females, depending on the hour of the day.
In order to use our system to detect stress in both males and females, we’ll use the mean values between them to establish the threshold. Thus, we’ll use the shaded area within the curves identified in figure 4.
Figure 3. Scatter Plot of changes in Cortisol Levels (nmol/L) in the Mean between Males and Females, depending on the hour of the day with shaded area of threshold identified.
As seen in the Figures above the GC concentration varies a lot during the day and the concentration of GC during stress conditions is approximately 30% more than the normal values. For testing the model we chose a normal value of 155nM, which is the average concentration of GC in blood during daytime (8am-5pm) and the activation of the system was tested for GC concentration 30% above this value.
Our circuit was constructed to turned be off at 155nM con GC and turned on at 200nM approximately. This means that for sample different from humans the base line needs to be found and depending on the results a some dilutions of the sample should be done.
 "
"


