Team:ETH Zurich/Experiments 6
From 2013.igem.org
| Line 9: | Line 9: | ||
The picture to the left shows the scanned image of GFP fluorescence after 11 hours of incubation. The green circles mark the mine colonies. The receiver colonies are those that process the OHHL that diffused from the sender colonies. The difference in fluorescence in the receiver colonies correlates directly to the number of adjacent mine colonies. The data from this experiment shows almost complete agreement with the [https://2013.igem.org/Team:ETH_Zurich/Modeling/Reaction_Diffusion_OOHL spatio-temporal model]. | The picture to the left shows the scanned image of GFP fluorescence after 11 hours of incubation. The green circles mark the mine colonies. The receiver colonies are those that process the OHHL that diffused from the sender colonies. The difference in fluorescence in the receiver colonies correlates directly to the number of adjacent mine colonies. The data from this experiment shows almost complete agreement with the [https://2013.igem.org/Team:ETH_Zurich/Modeling/Reaction_Diffusion_OOHL spatio-temporal model]. | ||
<br><br><br><br><br> | <br><br><br><br><br> | ||
| - | [[File:GFP graph.png|right| | + | <br> |
| + | |||
| + | [[File:GFP graph.png|right|370px|thumb|<b>Figure 2: </b> Graph showing analysis of GFP fluorescence around one ,two and three mines around a non-mine at time intervals.]] | ||
Revision as of 00:30, 5 October 2013
Contents |
GFP diffusion tests with sender cells and wild-type pLux receiver constructs
Diffusion experiments were performed to study OHHL diffusion from the sender colonies to the receiver colonies. The colonies were placed in a hexagonal grid pattern such that every colony can have either zero, one, two or three mine colonies adjacent to it. Depending on the number of mines around a non-mine colony, more OHHL will be processed in the receiver colonies due to the higher number of mines. 1.5μl of the receiver and sender cultures were plated according to a hexagonal grid pattern on an agar plate. We then investigated the diffusion patterns by scanning the plate with a molecular imaging software. Images of the GFP fluorescence were taken at time intervals of 1.5hours after the first detection of fluorescence. Images taken after 11 hours showed GFP saturation.
The picture to the left shows the scanned image of GFP fluorescence after 11 hours of incubation. The green circles mark the mine colonies. The receiver colonies are those that process the OHHL that diffused from the sender colonies. The difference in fluorescence in the receiver colonies correlates directly to the number of adjacent mine colonies. The data from this experiment shows almost complete agreement with the spatio-temporal model.
GFP diffusion tests with sender cells and mutated pluxR promoter receiver constructs
Also the mutant promoter [http://parts.igem.org/Part:BBa_K1216007 BBa_K1216007] we obtained through site-saturation mutagenesis was tested in the hexagonal grid experiment with LuxI sender cells. The sensitivity for OHHL was too low and we did not see any induction after 11h. The results are consistent with the model predictions and led to the rational design of additional promoter mutants, where either one of the two point mutions was changed back with the goal to recover some of the sensitivity of the wild type.
Optimization of LuxR production regulation to reduce basal reporter activation
Already with the GFP reporter we encountered leakiness in the absence of OHHL. We tested the GFP expression of different constructs in liquid culture over time. With a construct without any GFP we defined zero fluorescence. We used a pLuxR-GFP construct without LuxR protein to show the expression that results from the leakiness of the promoter alone. By testing the complete pLac-Lux-pLuxR-GFP receiver construct with and without induction through OHHL we see in addition the activation of pLuxR through LuxR alone. The constructs tested are described in Figure 4. Combining the results we could show that most of the leakiness comes from activation of the pLux promoter through LuxR alone, meaning in the absence of OHHL (Figure 5).
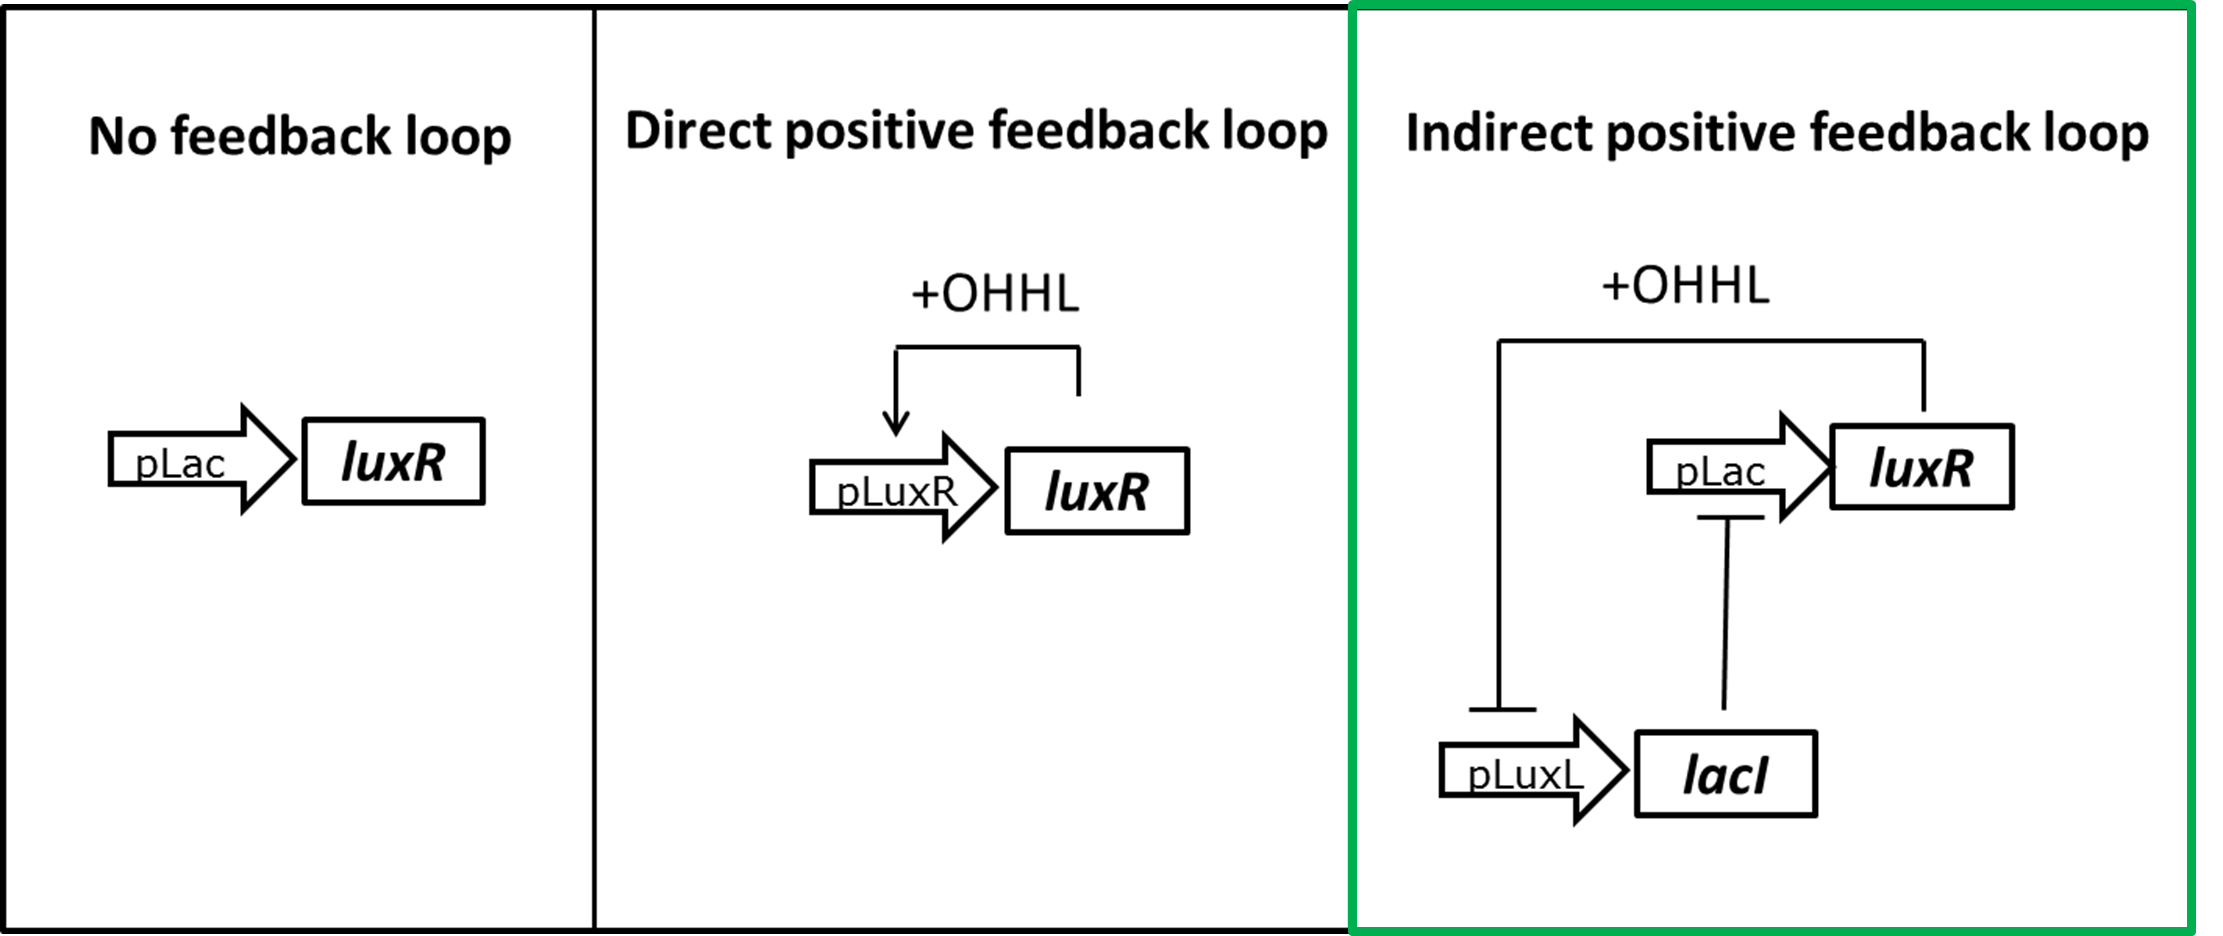
Expecting the hydrolase reporter system to be even more sensitive we designed different strategies to reduce the level of LuxR in the uninduced state (Figure 6). The overall idea was to change from a constant expression of LuxR to an OHHL dependent induction. One possibility would be to place the luxR gene under it's own pLuxR promoter. Only upon induction with OHHL LuxR would be produced. Or we could either use a constant LacI expression to inhibit LuxR production in the uninduced state. By placing the lacI gene under a negatively LuxR/OHHL regulated promoter pLuxL a positive feedback loop for LuxR expression is formed.
 "
"


