Team:Bielefeld-Germany/Labjournal/August
From 2013.igem.org
| Line 28: | Line 28: | ||
* Start of the subproject Riboflavin | * Start of the subproject Riboflavin | ||
| + | |||
| + | *MFC: Successfully printed out decent-looking model of a fuel cell out of ABS at hackerspace Bielefeld and smoothened its surface by vaporizing it over boiling acetone. | ||
<br><br><br><br> | <br><br><br><br> | ||
Revision as of 02:51, 5 October 2013
August
Milestones
- Our great expert Dr. Falk Harnisch has answered numerous questions about our project and helped us very well.
- gldA BioBrick (<bbpart>BBa_K1172201</bbpart>) was examined.
- gldA Biobrick Devices with different promotors and RBS could be added: (<bbpart>BBa_K1172203</bbpart>, <bbpart>BBa_K1172204</bbpart>, <bbpart>BBa_K1172205</bbpart>)
- oprF BioBrick <bbpart>BBa_K1172501</bbpart> is available.
- oprF Biobrick was functionalized with different promotors and RBS: (<bbpart>BBa_K1172502</bbpart>, <bbpart>BBa_K1172503</bbpart>, <bbpart>BBa_K1172504</bbpart>, <bbpart>BBa_K1172505</bbpart>, <bbpart>BBa_K1172507</bbpart>)
- Successful protein expression and overproduction of glycerol dehydrogenase. SDS-PAGE shows gldA at expected size.
- Start of the subproject Riboflavin
- MFC: Successfully printed out decent-looking model of a fuel cell out of ABS at hackerspace Bielefeld and smoothened its surface by vaporizing it over boiling acetone.
Week 14
Organization
- We had a second radio interview in the Bielefeld university campus radio ([http://www.radiohertz.de radio 87.9 hertz]) to introduce our project and the iGEM competition.
- Having an expert interview with Dr. Falk Harnisch from the Helmholtz Institute in Leipzig, who has got a great knowledge in the field of MFC.
MFC
Mediators
- Glycerol dehydrogenase
- Gradient PCR on the <bbpart>BBa_J04450</bbpart> Biobrick with Forward and Reverse Primer pSB1C3 gldA to amplify pSB1C3 backbone with gldA specific overlaps for Gibson assembly. The optimal Primer binding temperature was 60 °C.

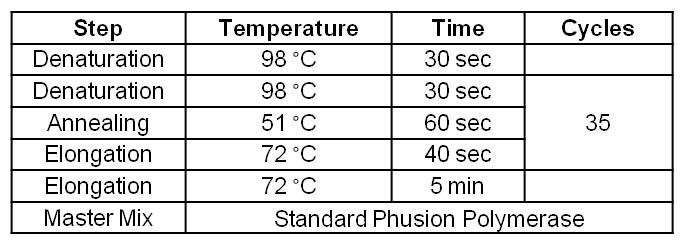
Table 1: Optimal Phusion PCR program for amplification of pSB1C3 with gldA and oprF specific overlaps for Gibson assembly.

Figure 1: Agarosegel from gradient PCR on <bbpart>BBa_J04450</bbpart> pSB1C3 plasmid with forward and reverse primer pSB1C3 gldA to amplify pSB1C3 backbone with gldA specific overlaps for Gibson assembly. As marker we used [http://www.thermoscientificbio.com/nucleic-acid-electrophoresis/generuler-1-kb-dna-ladder-ready-to-use-250-to-10000-bp GeneRuler™ 1 kb DNA Ladder from Thermo Scientific].
- Optimization of PCR on the gldA gene of Escherichia coli with temperature gradient PCR using Forward and Reverse gldA Primer. The optimal Primer binding temperature was 60 °C.
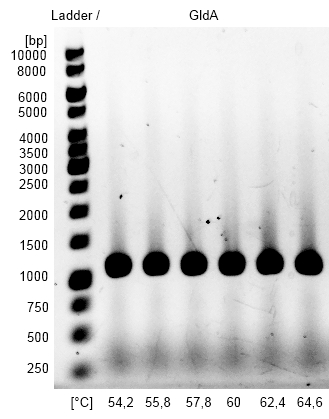
Figure2: Agarosegel from gradient PCR on genome DNA of Escherichia coli KRX with forward and reverse primer gldA to amplify gldA for Gibson Assembly. As marker we used [http://www.thermoscientificbio.com/nucleic-acid-electrophoresis/generuler-1-kb-dna-ladder-ready-to-use-250-to-10000-bp GeneRuler™ 1 kb DNA Ladder fromThermo Scientific].
- gldA PCR product and the corresponding pSB1C3 Gibson backbone were isolated by Agarose gel electrophorese and purificated.
- Gibson Assembly with optimized gldA PCR product and pSB1C3 PCR product with gldA specific overlaps using Gibson Assembly with 3:1 molar ratio of insert to vector with 100 ng insert.
- gldA BioBrick was successfully cloned into pSB1C3 shipping vector.
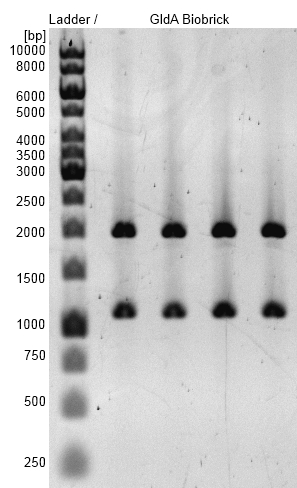
Figure 3: Agarosegel with [http://www.thermoscientificbio.com/nucleic-acid-electrophoresis/generuler-1-kb-dna-ladder-ready-to-use-250-to-10000-bp GeneRuler™ 1 kb DNA Ladder from Thermo Scientific] as marker. Bands are showing restriction analysis from cloning of gldA into pSB1C3 shipping vector with Gibson Assembly. Bands are at the expected size of 1100 bp (GldA) and 2000 bp (pSB1C3). gldA BioBrick (<bbpart>BBa_K1172201</bbpart>) was examined.
- gldA BioBrick plasmid (<bbpart>BBa_K1172201</bbpart>) was examined by restriction analysis with restriction enzymes EcoRI und XbaI. Bands are at the expected size of 1100 bp (gldA) and 2000 bp (pSB1C3).
Cytochromes
- Restriction of ccmAH and psB1C3 and Suffix-Insertion
- The backbone and shipping vector psB1C3 was cut with EcoRI, SpeI, the insert ccmAH with EcoRI and XbaI to perfom a standard suffix insertion.
- We used approx. 200 ng insert and 42 ng vector, which represents a 2-fold molar excess of insert.
- The Ligation was incubated for 15 min at 37°C, followed by a heat-inactivation at 80°C for 20 min.
- The subsequent PAGE did not yield any positiv results, probably due to the use of buffer and enzymes from two different manufactures.
- Validation of all intermediate products via PAGE
- A gel electrophoresis was performed to ensure that all former products have the correct size and this could be ruled out as an error source.
- It showed that all products were indeed correct.
- Amplification of psB1C3 with insert-specific primers
- The backbone and shipping plasmid psB1C3 was amplified with the new designed insert-specific primers for mtrCAB. These primers have a specific overlap complementary to 20nt at the beginning and end of the insert. This was necessary, because we had to deal with constant religation of the vector. We investigated this issue and found out, that prefix and suffix of the psB1C3 vector have a very similarity, which facilates religation. The correct band was extracted from the gel and cleaned up.
- NanoDrop:
- 4-0108-301: 1.1 ng/ul
- 4-0108-302: 1.0 ng/ul
- Gibson-Assembly of psB1C3 and fragment 1,2 and 3 of the mtrCAB cluster
- After thawing on ice, a total amount of 5 ul DNA is added and the whole mixture is incubated at 50°C for approx. 60min.
- psB1C3 (4-0108-301): 2.2 ng
- Fragment1 (4-2607-304): 13.1 ng
- Fragment2 (4-2707-004): 16.9 ng
- Fragment3 (4-2607-301): 14.4 ng
- Notes:The inserts were not equimolar and not added in a 3-fold excess to the vector
- Transformation to self-made electrocompetent E.coli cells. A total volume of 1ul could be used.
- The Transformation did not yield any positive colonies, which could be due to the wrong ratio of fragments and vector (see notes above).
Biosafety
- We did Gibson-Assembly according to the typical Gibson-Assembly protocol with the different purified plasmids. :
- Fragment: "pSB1C3_plac_alr+ pSB1C3_alr_rev"+"pSB1C3_plac_pre+ pSB1C3_alr_suf",
- "pSB1C3_alr_fwd+ pSB1C3_alr_rev"+"pSB1C3_alr_pre+ pSB1C3_alr_suf",
- "araC_d1+ araC_d2"+"araC_d3+ araC_d4", with pKO4
- After the Gibson Assembly we transformated the Gibson fragments into self produced competent E.coli KRX cells and plated the cells on LB+CM20-plates
Porines
- Gradient PCR on the <bbpart>BBa_J04450</bbpart> Biobrick with Forward and Reverse Primer pSB1C3 oprF to amplify pSB1C3 backbone with oprF specific overlaps for Gibson assembly. The optimal Primer Binding temperature was 60 °C.


Nanowires
- Screening of colonies from Gibson Assembly by plasmid restriction analysis shows fragments of 2000 bp, which corresponds to religated pSB1C3.
- The negative result of several new Gibson Assembly attempts and subsequent analysis of the clones by plasmid restriction analysis illustrate the difficulty of using very big gene clusters in orders of 7000-9000 bp for Gibson Assembly.
- Based on this result and the not very promising prospects for a functional expression of nanowires in Escherichia coli the nanowire project was stopped until further notice to focus on other project aspects.
Week 15
Organization
- The [http://www1.wdr.de/themen/index.html TV station WDR] made a video with us about our project. This can be seen in the OWL local time, a television program of the WDR.
MFC
Mediators
- Glycerol dehydrogenase
- The following parts were [http://parts.igem.org/Help:2013_DNA_Distribution isolated from 2013 Distribution Kit] and transformed into Escherichia coli KRX strain:
- <bbpart>BBa_K608002</bbpart> (<bbpart>J23104</bbpart> + <bbpart>B0034</bbpart>)
- <bbpart>BBa_K608003</bbpart> (<bbpart>J23104</bbpart> + <bbpart>B0032</bbpart>)
- <bbpart>BBa_K608004</bbpart> (<bbpart>J23104</bbpart> + <bbpart>B0031</bbpart>)
- <bbpart>BBa_K608006</bbpart> (<bbpart>J23110</bbpart> + <bbpart>B0032</bbpart>)
- <bbpart>BBa_K608007</bbpart> (<bbpart>J23110</bbpart> + <bbpart>B0031</bbpart>)
- <bbpart>BBa_K525998</bbpart> (T7 Promotor + <bbpart>B0034</bbpart>)
- <bbpart>BBa_K081005</bbpart> (<bbpart>J23100</bbpart> + <bbpart>B0030</bbpart>)
- Plasmids were isolated for later Suffix Insertion.
- gldA BioBrick plasmid (<bbpart>BBa_K1172201</bbpart>) was examined by sequencing.
- The following parts were [http://parts.igem.org/Help:2013_DNA_Distribution isolated from 2013 Distribution Kit] and transformed into Escherichia coli KRX strain:
Cytochromes
- The vector <bbpart>BBa_J04500</bbpart> which consists of an IPTG inducible lac promoter and a ribosome binding site was isolated from the 2013 Plate 3
- J04500......4-1508-011......89.9ng/ul
- The vector was subsequently digested with the enzymes EcoRI and SpeI and dephosphorylated afterwards to enable suffix insertion.
- Another attempt on a Gibson assembly of the mtrCAB cluster was made.
- Psb1c3.....4-1508-301......18.0 ng/ul......1.0 ul......18ng
- Frag1......4-1408-301......95.0 ng/ul......1.0 ul......95ng
- Frag2......4-1408-302......20.8 ng/ul......2.0 ul......40ng
- Frag3......4-1408-303......45.4 ng/ul......1.0 ul......45ng
- Notes: molar excess not considered.
- The assembly seemed succesfull at first sight. Besides some red colonies due to not entirely clean vector template, the isolated white colonies had a plasmid high concentration.
- A restriction analysis with the enzymes XbaI and PstI was analysed via PAGE and showed allegedly correct bands, which admittedly seemed a little to low.
!!missing picture!!
- It later became clear that the assembly itself worked, the problem was a wrong fragment3, which was amplified and then isolated by mistake and used in the following.
Biosafety
- We did plasmid isolation with different samples. The first six samples used from the distribution plates and transformed into KRX electro competent cells to concentrate the DNA. The other samples were taken after the transformation. The reason for the red and white colony samples is that we wanted to use the Biobrick of Bettencourt 2012 but they were not physically in the parts registry. We asked Bettencourt to send us the Biobricks. After a week we got the Biobrick but after plating the sample there were red and white colonies. We decided to check both of them.:
- BBa_I13541 A: 95,1 ng/µL (9-88-451)
- BBa_I13541 B: 165,1 ng/µL (9-88-452)
- BBa_K914004 A white: 198,8 ng/µL (9-88-453)
- BBa_K914004 B white: 204,9 ng/µL (9-88-454)
- BBa_K914004 A red: 476,5 ng/µL (9-88-455)
- BBa_K914004 B red: 400,9 ng/µL (9-88-456)
- AraC_del A: 82,4 ng/µL (9-88-457)
- AraC_del B: 64,5 ng/µL (9-88-458)
- pSB1C3_alr A: 120,4 ng/µL (9-88-459)
- pSB1C3_alr B: 168,4 ng/µL (9-88-460)
- pSB1C3_alr C: 137,2 ng/µL (9-88-461)
- ptac_alr A: 24,7ng/µL (9-108-451)
- ptac_alr B: 39,6 ng/µL (9-108-452)
Porines
- Optimization of PCR on the oprF gene of Pseudomonas fluorescens with temperature gradient PCR using Forward and Reverse oprF Primer. The optimal Primer binding temperature was 51 °C.
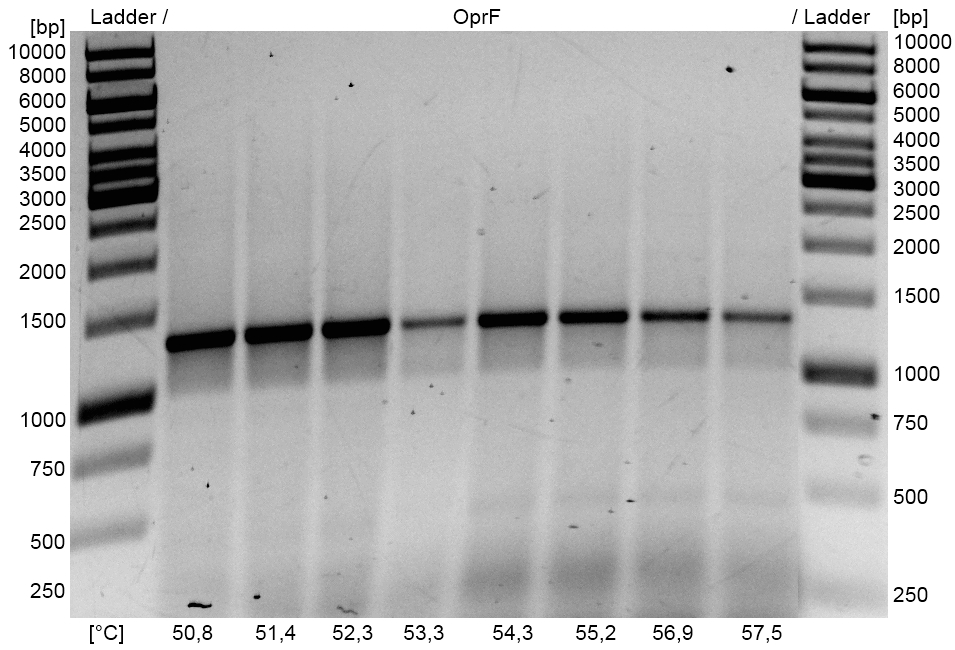
- oprF PCR product and the corresponding pSB1C3 Gibson backbone were isolated by Agarose gel electrophorese and purificated.
- Gibson Assembly with optimized oprF PCR product and pSB1C3 PCR product with oprF specific overlaps using Gibson Assembly with 3:1 molar ratio of insert to vector with 100 ng insert.
- oprF BioBrick was successfully cloned into pSB1C3 shipping vector.

- oprF BioBrick plasmid <bbpart>BBa_K1172501</bbpart> was examined by restriction analysis with restriction enzymes EcoRI and XbaI. Bands are at the expected size of 1300 bp (OprF) and 2000 bp (pSB1C3).
- oprF BioBrick plasmid <bbpart>BBa_K1172501</bbpart> was examined by sequencing.
Week 16
Organization
- Final preparations for CeBiTec pupil academy in the next week.
MFC
Mediators
- Glycerol dehydrogenase
- Adding the following parts with promoter and RBS to the gldA Biobrick <bbpart>BBa_K1172201</bbpart> by Standard Biobrick assembly Suffix Insertion modified from Silver lab: <bbpart>BBa_K525998</bbpart>, <bbpart>BBa_J04500</bbpart> and <bbpart>BBa_K608006</bbpart>
- Promotor insertion was examined by restriction analysis and the following gldA Biobrick Devices with promotor and RBS could be added:
- <bbpart>BBa_K1172203</bbpart>: <bbpart>BBa_K1172201</bbpart> + <bbpart>BBa_K525998</bbpart>
- <bbpart>BBa_K1172204</bbpart>: <bbpart>BBa_K1172201</bbpart> + <bbpart>BBa_J04500</bbpart>
- <bbpart>BBa_K1172205</bbpart>: <bbpart>BBa_K1172201</bbpart> + <bbpart>BBa_K608006</bbpart>

Figure 7: Agarose gel with [http://www.thermoscientificbio.com/nucleic-acid-electrophoresis/generuler-1-kb-dna-ladder-ready-to-use-250-to-10000-bp GeneRuler™ 1 kb DNA Ladder from Thermo Scientific] as marker. Bands are showing restriction analysis from suffix insertion of GldA (<bbpart>BBa_K1172201</bbpart>) into <bbpart>BBa_K525998</bbpart>, <bbpart>BBa_J04500</bbpart> and <bbpart>BBa_K608006</bbpart> with Standard BioBrick assembly Suffix Insertion modified from Silver lab. Bands are at the expected size. gldA BioBrick devices (<bbpart>BBa_K1172203</bbpart>, <bbpart>BBa_K1172204</bbpart>, <bbpart>BBa_K1172205</bbpart>) were examined.
- gldA BioBrick plasmid (<bbpart>BBa_K1172201</bbpart>) with different promotors and RBS were examined by restriction analysis with restriction enzymes EcoRI und XbaI for part <bbpart>BBa_K1172205</bbpart> and with restriction enzyme EcoRI for parts <bbpart>BBa_K1172203</bbpart> and <bbpart>BBa_K1172204</bbpart>. All bands are at the expected size.
Cytochromes
- The Gibson assembly with the wrong insert (see week 15) was further analysed and the mistake was uncovered.
- A restriction analysis with the enzymes HincII and NaeI showed an unexpected pattern of bands in the PAGE, which raised the suspicion of an incorrect fragment. A further investigation of the labjournal revealed the mistake. A sequencing confirmed it.
Biosafety
- We wanted to use Barnase (RNase Ba) from Bacillus amyloliquefaciens as a degradation part of our safety system. Because of this we first had to isolate the whole genome of it and get the barnase gene out with specially designed primer. We used different species because we didn't exactly know which species expresses the barnase. We isolated the genomes and measured the DNA concentration of Bacillus amyloliquefaciens
- DMS-1061: 20ng/µL (9-138-451)
- Wild type H 10A1: 766,6 ng/µL (9-138-452)
- Wild type R+M+ 10A3: 825,2 ng/µL (9-138-453)
- Wild type DSMZ7: 25,8 ng/µL (9-138-454)
- We did restriction analysis of the plasmids from 8.8.2013 to check if there is the correct insert in the vectors. We used the restriction enzymes EcoR1 and Pst1 to cut the vector. The analysis did not show the right bands on the right higth apart from BBa_I13541.
- BBa_I13541, BBa_K914004 white colony, BBa_K914004 red colony, araC, alr
- Result: failed
- Further we did colony-PCR to check the insert. The gel also didn't show the right bands apart from BBa_I13541. We used 1 µL of a in 50µl resuspended colony suspension and the normal PCR protocol.:
- BBa_I15341, BBa_K194004 white, BBa_K194004 red, pSB1C3_alr, ptac_alr+insertprimern
- Result: failed
- BBa_I15341, BBa_K194004 white, BBa_K194004 red, pSB1C3_alr, ptac_alr+insertprimern
- We also did a restriction analysis of our samples because we guessed that there was the alanine racemase in it. We cut the vector also with EcoR1 and Pst1 but the gel didn't show the right bands by the right hight:
- Alr 1,2,3,4
- Result: no bands as expected
Porines
- Adding the following parts with promoter and RBS to the oprF BioBrick <bbpart>BBa_K1172501</bbpart> by Standard BioBrick assembly Suffix Insertion modified from Silver lab: <bbpart>BBa_K525998</bbpart>, <bbpart>BBa_J04500</bbpart>, <bbpart>BBa_K608002</bbpart>, <bbpart>BBa_K608006</bbpart>, <bbpart>BBa_K608007</bbpart>.
- Promotor insertion was examined by restriction analysis and the following oprF Biobrick Devices with promotor and RBS could be added:
- <bbpart>BBa_K1172502</bbpart>: <bbpart>BBa_K1172501</bbpart> + <bbpart>BBa_K525998</bbpart>
- <bbpart>BBa_K1172503</bbpart>: <bbpart>BBa_K1172501</bbpart> + <bbpart>BBa_J04500</bbpart>
- <bbpart>BBa_K1172504</bbpart>: <bbpart>BBa_K1172501</bbpart> + <bbpart>BBa_K608007</bbpart>
- <bbpart>BBa_K1172505</bbpart>: <bbpart>BBa_K1172501</bbpart> + <bbpart>BBa_K608006</bbpart>
- <bbpart>BBa_K1172507</bbpart>: <bbpart>BBa_K1172501</bbpart> + <bbpart>BBa_K608002</bbpart>
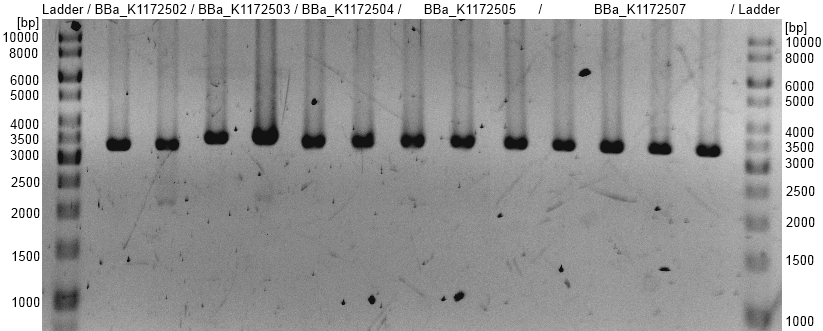
- oprF BioBrick plasmid (<bbpart>BBa_K1172501</bbpart>) with different promotors and RBS was examined by restriction analysis with restriction enzymes EcoRI. All bands are at the expected size and show a successful suffix insertion.
Week 17
Organization
- Our Team will participate at the conference ‘[http://www.naturkundemuseum-berlin.de/besucherinfos/archiv-kongress-60-jahre-dna 60 Years of DNA]’ in Berlin on 14. September.
MFC
Mediators
- Glycerol dehydrogenase
- Escherichia coli KRX strain and modified E. coli KRX with pSB1C3 and <bbpart>BBa_K1172203</bbpart>, <bbpart>BBa_K1172204</bbpart> and <bbpart>BBa_K1172205</bbpart> was cultivated over night, with induction of gene expression for <bbpart>BBa_K1172203</bbpart> by 0,5 % L-rhamnose and for <bbpart>BBa_K1172204</bbpart> by 0,7 mM IPTG. Ribolysation of over night culture for total cell disruption. After centrifugation 15 min at maximal speed supernatant was prepared for SDS-PAGE.
- SDS-PAGE shows protein Glycerol dehydrogenase at expected size of 40 kDa. In contrast to Escherichia coli KRX wild type, weak Anderson promoter (<bbpart>BBa_K1172205</bbpart>) shows only a slightly stronger band, whereas T7 (<bbpart>BBa_K1172203</bbpart>) and Lac (<bbpart>BBa_K1172204</bbpart>) promotor show a strong band, which is equated with a strong expression and overproduction of GldA.

Figure 9: SDS-PAGE with [http://www.thermoscientific.com/ecomm/servlet/productsdetail_11152___13576050_-1 Prestained Protein Ladder from Thermo Scientific] as marker. Comparison of protein expression between Escherichia coli KRX wild type and Escherichia coli KRX with <bbpart>BBa_K1172205</bbpart>, <bbpart>BBa_K1172204</bbpart> and <bbpart>BBa_K1172203</bbpart> after total cell disruption. The right-hand gel was loaded with a higher protein concentration. SDS-PAGE shows protein Glycerol dehydrogenase at expected size of 40 kDa. Enhanced overproduction with increasing promotor strength.
- For showing an endogenous mediator production, the plan is to establish a fast NADH assay by direct using supernatant after cell disruption and testing specific NADH fluorescens with excitation at 340 nm and emission at 460 nm.
- First NADH assay test shows the need of a cell washing step, because of high background signals with LB-medium.
- Riboflavin
- This is our first entry regarding the subproject riboflavin. Please make sure to read the chapter Genetic Approach in the overview section aforegoing. It supplies you with all the information necessary for a good understanding of the following labjournal entries on riboflavin.
- We were able to profit from the experiences we had already gained while working on other cloning subprojects. So we started right away with designing specific pSB1C3-gibson-primers. This way, we supplied every one of our four desired parts with an unique pSB1C3 with overlaps that were homologues to the ends of the insert. Thus, we were able to shut down the religation problem (see Failbook).
- pSB1C3_fwd_norM (43 bp)
GCGACAGCGTGCACCATTAATACTAGTAGCGGCCGCTGCAGTC - pSB1C3_rev_norM (43 bp)
TGAAAGCCTGAATGTTTCATCTCTAGAAGCGGCCGCGAATTCC - pSB1C3_fwd_RibC (44 bp)
GTTTTAACGGACTATCTTAATACTAGTAGCGGCCGCTGCAGTCC - pSB1C3_rev_RibC (43 bp)
TGAACTATACCAGTAAACATCTCTAGAAGCGGCCGCGAATTCC - pSB1C3_fwd_Rib (43 bp)
AGCTTGAACAACAGTTGTAATACTAGTAGCGGCCGCTGCAGTC - pSB1C3_rev_Rib (43 bp)
TCGAGTACTGACCAATTCATCTCTAGAAGCGGCCGCGAATTCC - pSB1C3_fwd_Rib_nus (43 bp)
AACTGGTTGCACGTAAGTAATACTAGTAGCGGCCGCTGCAGTC - Rib_rev_Gibson (50 bp)
TGGCTTGAACTATACCAGTAAACATTTACAACTGTTGTTCAAGCTGTTGC - RibC_fwd_Gibson (54 bp)
GCAACAGCTTGAACAACAGTTGTAAATGTTTACTGGTATAGTTCAAGCCACCTG
- pSB1C3_fwd_norM (43 bp)
- Gradient PCR´s with the above "pSB1C3..." Primers and pSB1C3+RFP as template gave good results. Actually, they were that good, that we just cleaned up and pooled all nanotubes for further experiments.
- Meanwhile we started to isolate the genes responsible for riboflavin expression from the genome of shewanella oneidensis (link to genome isolation).
- The following primers were used for isolation and amplification of the four targeted sequences rib, rib-nusB, ribC and norM:
- Rib_fwd (44 bp)
GAATTCGCGGCCGCTTCTAGATGAATTGGTCAGTACTCGATAAC - Rib_rev (42 bp)
CTGCAGCGGCCGCTACTAGTATTACAACTGTTGTTCAAGCTG - Rib_Nus_rev (43 bp)
CTGCAGCGGCCGCTACTAGTATTACTTACGTGCAACCAGTTTG - RibC_fwd (43 bp)
GAATTCGCGGCCGCTTCTAGATGTTTACTGGTATAGTTCAAGC - RibC_rev (42 bp)
CTGCAGCGGCCGCTACTAGTATTAAGATAGTCCGTTAAAACG - norM_fwd (48 bp)
GAATTCGCGGCCGCTTCTAGATGAAACATTCAGGCTTTCAAGCCAAAC - norM_rev (45 bp)
CTGCAGCGGCCGCTACTAGTATTAATGGTGCACGCTGTCGCCTTC
- Rib_fwd (44 bp)
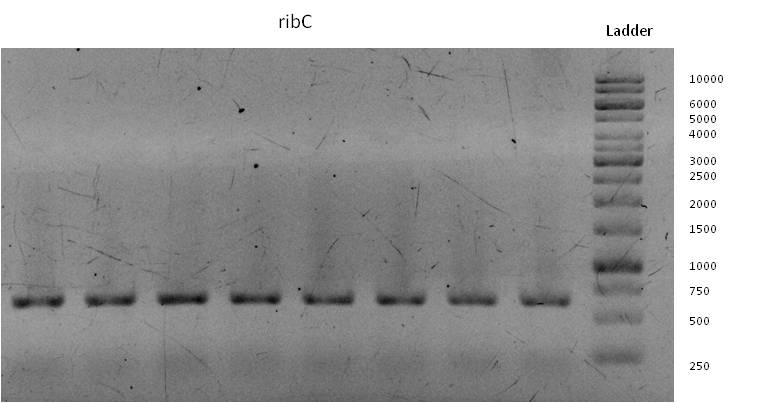
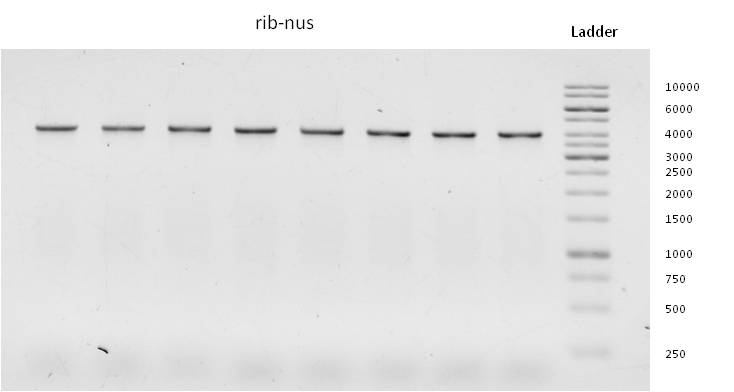
- Through week 17 we were able to gain all desired DNA-sequences by running gradient PCR´s followed by “production-PCR´s” at appropriate annealing temperatures.
- Through week 17 we were able to gain all desired DNA-sequences by running gradient PCR´s followed by “production-PCR´s” at appropriate annealing temperatures.
Cytochromes
- A selection of expression vectors of different strength, that were isolated from the iGEM-plates previously, were digested with the enzymes SpeI and PstI to enable suffix insertion.
- <bbpart>BBa_K608006</bbpart>: Anderson 0.33 + weak RBS
- <bbpart>BBa_K608002</bbpart>: Anderson 0.77 + strong RBS
- <bbpart>BBa_K525998</bbpart>: T7 + strong RBS
- Subsequently the vectors were dephosphorylated and a PCR cleanup was performed.
- <bbpart>BBa_K608006</bbpart>......4-3108-305......16.9 ng/ul
- <bbpart>BBa_K608002</bbpart>......4-3108-305......14.9 ng/ul
- <bbpart>BBa_K525998</bbpart>......4-3108-305......18.3 ng/ul
Biosafety
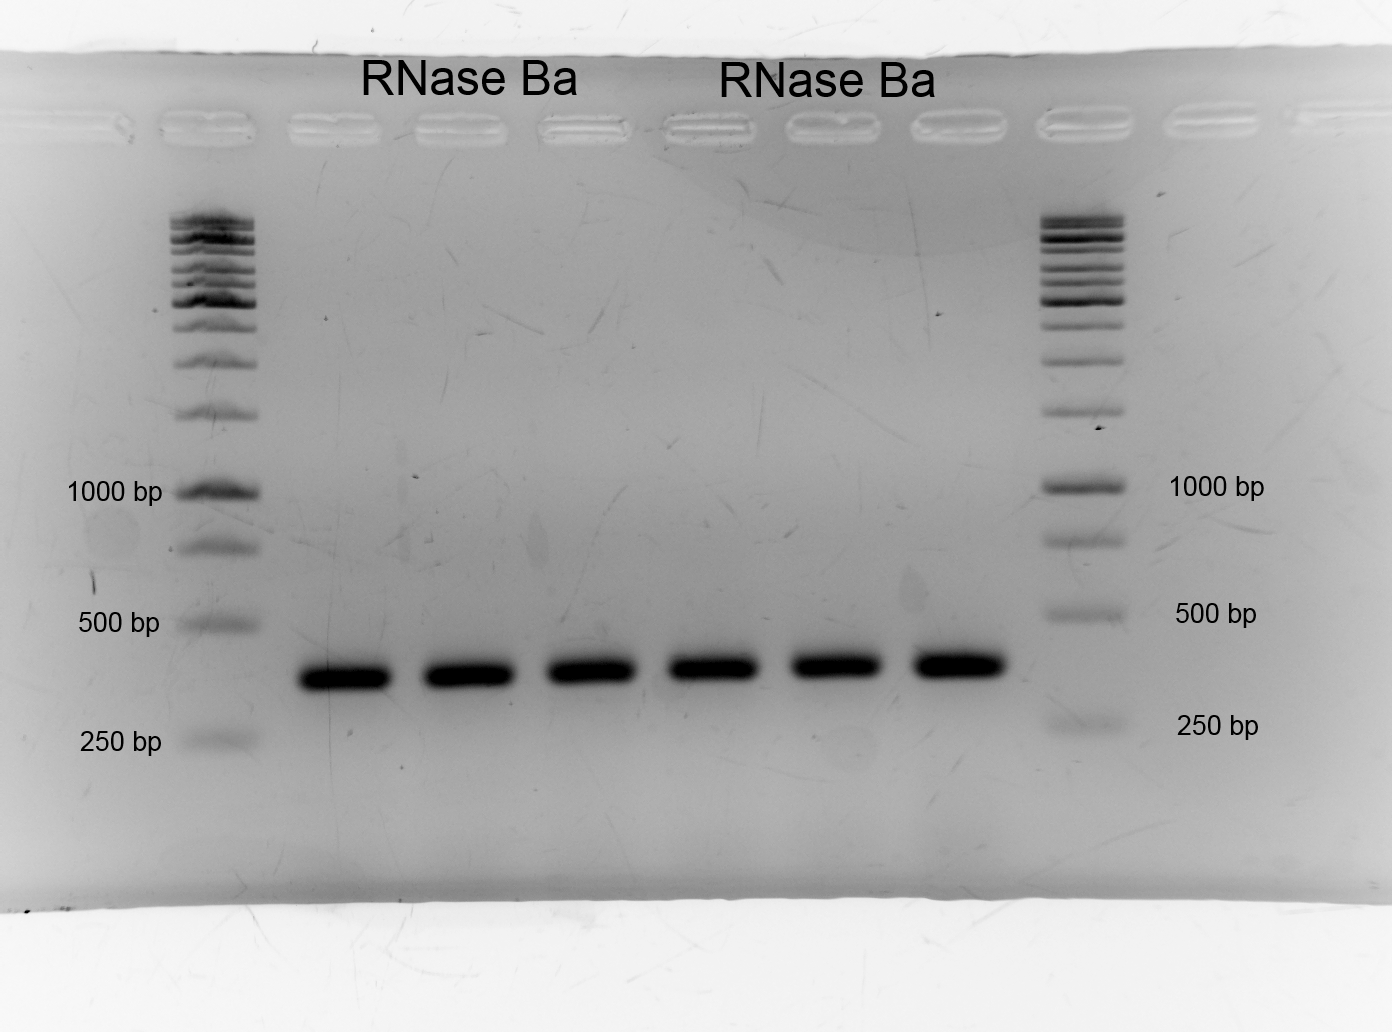
- After we isolated the genome of Bacillus amyloliquefaciens we had to get the barnase. We picked the genome of DSMZ7. We amplified DNase Ba via PCR and designed primer. We had success as the gel shows. As expected the band lies on the higth of 350 bp.:
- Size: 350bp
- After we successfully got the Barnase we had to do gel purification of the fragments. We did this as described in the protocols. After purification we measured the concentration of DNA via nanodrop.:
- RNase Ba fwdrevinsert 27,5ng/µL (9-238-451)
- RNase Ba presufVektor 67,3ng/µL (9-238-452)
- We have produced a knockout. This AraC-Deletion in K12 Δalr Δdadx causes that this K12 E.coli can't produce AraC of itself and that it is dependent of the supplementation of D-alanine or the supplementation of a vector where araC is expressed. The reason for this knockout is that we want to raise plasmid stability of the strain. When the strain isn't able to produce AraC it dies.
- After checking if the araC deletion was successful we plated the colonies 1,5,7,8,14,15.
- We cultivated K12-WT and K12 Δalr Δdadx ΔaraC and produced electro competent cells as it is written in the standard protocol.
- We did Gibson-Assembly with alr, ptac und RNase Ba to clone it into the pSB1C3 shuttle vector.
- After the Assembly we transformated the vectors in E.coli KRX electro competent cells via electroporation for a plasmid isolation.
- We isolateed the plasmids of DNase Ba in pSB1C3. We did restriction analysis with EcoR1 and Pst1 to check if the correct insert is in the pSB1C3. But there were no expected bands.
- Restriction analysis:
- Result: no expected bands!
Porines
- Starting with characterization of Escherichia coli KRX with porin oprF (<bbpart>BBa_K1172501</bbpart> up to <bbpart>BBa_K1172507</bbpart>).
- Testing Hexadecan-Assay for characterization of hydrophobicity of the outer membrane. Using Escherichia coli KRX wild type and comparing it with:
- <bbpart>BBa_K1172504</bbpart>: <bbpart>BBa_K1172501</bbpart> + <bbpart>BBa_K608007</bbpart>
- <bbpart>BBa_K1172505</bbpart>: <bbpart>BBa_K1172501</bbpart> + <bbpart>BBa_K608006</bbpart>
- <bbpart>BBa_K1172507</bbpart>: <bbpart>BBa_K1172501</bbpart> + <bbpart>BBa_K608002</bbpart>
- E. coli KRX with oprF plasmids and Anderson promoters show higher membrane hydrophobicity than wild type. Hydrophobicity is about 37 up to 77 % higher in comparison to the KRX wild type. Assay must be improved because of too high standard deviation.
- Membrane permeability was further tested with two uptake assays. ONPG and NPN uptake assay were performed.
- Performing pre-experiments with different permeabilising chemicals: Isopropanol in water, EDTA in Tris-HCl and β-mercaptoethanol, each with 70% (v/v) concentration. β-mercaptoethanol is most suitable to permeabilize Escherichia coli KRX. β-mercaptoethanol shows 168% relative increase of permeability, EDTA 93% and isopropanol 46%. These data provide a benchmark to assess the oprF expression and membrane permeabilization.
- The values of pre-experiments of Escherichia coli with oprF indicate a successful expression of oprF porin in the outer membrane. The permeability increases by introducing the plasmids with oprF. However, the variation between samples is still too high and needs further optimization.
- Protein isolation of outer membrane porin oprF by Release of periplasmic protein fraction from E. coli by cold osmotic shock for later SDS-PAGE. OprF could not been detected on the PAGE. It seems to be that only periplasmic proteins were isolated whereas outer membrane proteins werere not soluble in the supernatant.

Figure 10: SDS-PAGE with [http://www.thermoscientificbio.com/protein-electrophoresis/pageruler-unstained-protein-ladder Unstained] (Left) and [http://www.thermoscientific.com/ecomm/servlet/productsdetail_11152___13576050_-1 Prestained] (Right) Protein Ladder from Thermo Scientific as marker. Comparison of protein expression between Escherichia coli KRX wild type and Escherichia coli KRX with <bbpart>BBa_K1172502</bbpart>, <bbpart>BBa_K1172503</bbpart>, <bbpart>BBa_K1172504</bbpart>, <bbpart>BBa_K1172505</bbpart> and <bbpart>BBa_K1172507</bbpart> after periplasmic protein fractioning.
 "
"


