Team:ETH Zurich/Experiments 5
From 2013.igem.org
| Line 38: | Line 38: | ||
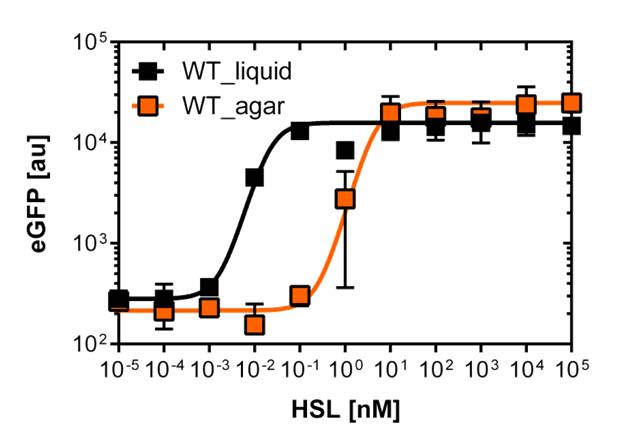
[[File:WTliquidagar.jpg|400px|left|thumb|<b>Figure 5: Sensitivity curve of the Wild Type on agar plates and liquid culture</b> For the liquid culture we got :EC<sub>50</sub>=0.02nM, R<sup>2</sup>=0.84, n=1.7; For the agar plates we got :EC<sub>50</sub>=4.45nM, R<sup>2</sup>=0.80, n=1.7]] | [[File:WTliquidagar.jpg|400px|left|thumb|<b>Figure 5: Sensitivity curve of the Wild Type on agar plates and liquid culture</b> For the liquid culture we got :EC<sub>50</sub>=0.02nM, R<sup>2</sup>=0.84, n=1.7; For the agar plates we got :EC<sub>50</sub>=4.45nM, R<sup>2</sup>=0.80, n=1.7]] | ||
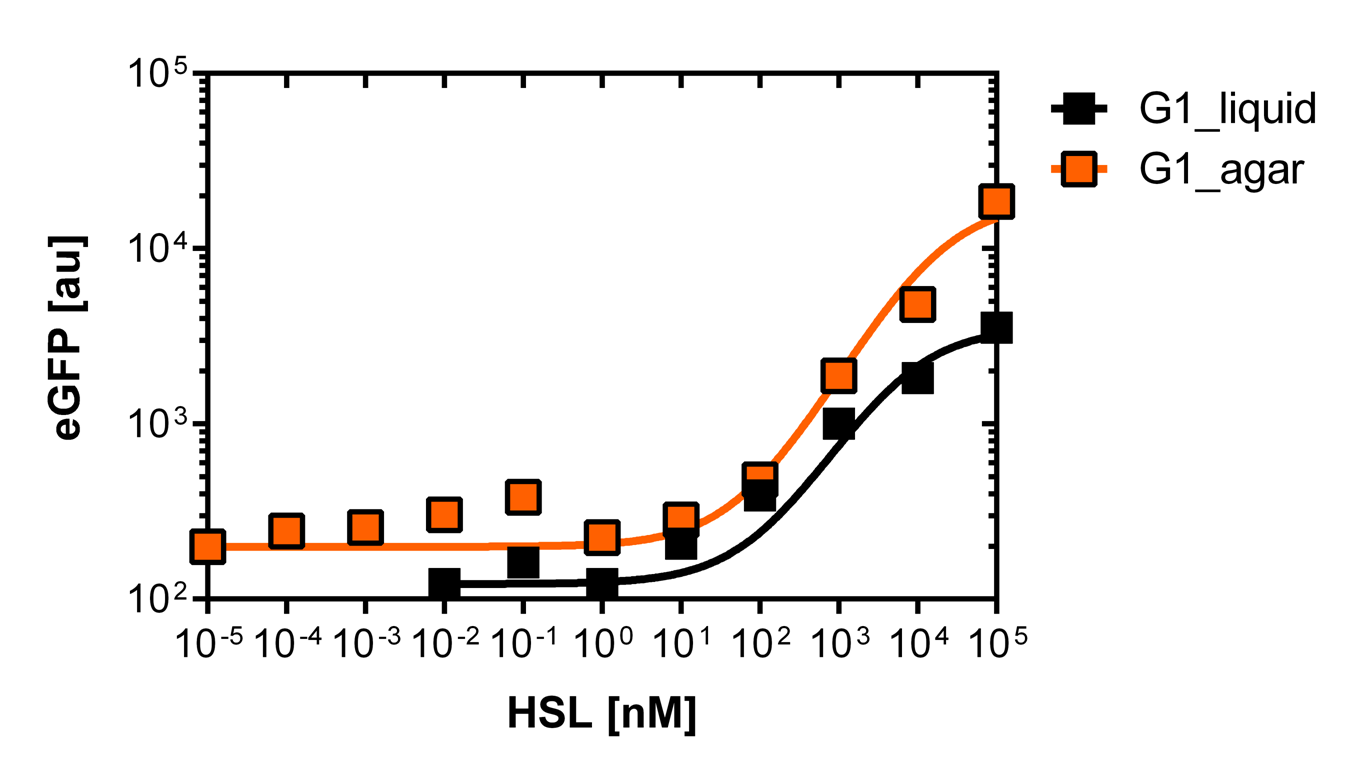
| - | [[File:Facs data.jpg|right| | + | [[File:Facs data.jpg|right|750px|thumb|<b>Figure 3: Facs data of the wild type promoter vs. the pLuxR1 mutant</b> The graph (top) on the top shows the comparison of the sensivity dose response of GFP construct using the wild type promoter. The second graph (bottom)shows the dose response of the GFP construct using the mutated pLuxR1 promoter. The dose response in liquid culture is represented in black. The dose response on agar plates is shown in orange. ]] |
[[File:G1_plate.png|400px|left|thumb|<b>Figure 6: Sensitivity curve of the G1 on agar plates and liquid culture</b><br>For the liquid culture we got :EC<sub>50</sub>=6482nM, R<sup>2</sup>=0.97, n=0.8;<br> For the agar plates we got :EC<sub>50</sub>=17814nM, R<sup>2</sup>=0.93, n=0.8]] | [[File:G1_plate.png|400px|left|thumb|<b>Figure 6: Sensitivity curve of the G1 on agar plates and liquid culture</b><br>For the liquid culture we got :EC<sub>50</sub>=6482nM, R<sup>2</sup>=0.97, n=0.8;<br> For the agar plates we got :EC<sub>50</sub>=17814nM, R<sup>2</sup>=0.93, n=0.8]] | ||
| Line 47: | Line 47: | ||
<p align="justify">The direct plot of both sensivity curves shows the clearly shifted sensivity of the pLuxR1 promoter in comparison to the wild type BBa_R0062 promoter. The EC<sub>50</sub> shit from 0.02nM for the wild type to 6'250 nM for the pLuxR1 promoter is equal to a 312'500 fold increase.<br>The wild type promoter [http://parts.igem.org/Part:BBa_R0062 BBa_R0062 PLuxR] is used for the detection of low OHHL concentrations and therefore be almost activated when one mine cell is in the vincinity of the receiver cell. The wild type promoter induces the expression of GusA, a hydrolase able to convert a specific substrate to a visible red output.The mutated promoter [http://parts.igem.org/Part:BBa_K1216007?title=Part:BBa_K1216007 PluxR1 BBa_K1216007] will be used in our final set-up to only respond to high concentrations of OHHL and therefore be activated, when two sender cells are surrounding the receiver cell, and expressing the [https://2013.igem.org/Team:ETH_Zurich/Experiments_7 AES] hydrolase responsible for the colorimetric conversion of the specific substrate to a visible purple output.</p> | <p align="justify">The direct plot of both sensivity curves shows the clearly shifted sensivity of the pLuxR1 promoter in comparison to the wild type BBa_R0062 promoter. The EC<sub>50</sub> shit from 0.02nM for the wild type to 6'250 nM for the pLuxR1 promoter is equal to a 312'500 fold increase.<br>The wild type promoter [http://parts.igem.org/Part:BBa_R0062 BBa_R0062 PLuxR] is used for the detection of low OHHL concentrations and therefore be almost activated when one mine cell is in the vincinity of the receiver cell. The wild type promoter induces the expression of GusA, a hydrolase able to convert a specific substrate to a visible red output.The mutated promoter [http://parts.igem.org/Part:BBa_K1216007?title=Part:BBa_K1216007 PluxR1 BBa_K1216007] will be used in our final set-up to only respond to high concentrations of OHHL and therefore be activated, when two sender cells are surrounding the receiver cell, and expressing the [https://2013.igem.org/Team:ETH_Zurich/Experiments_7 AES] hydrolase responsible for the colorimetric conversion of the specific substrate to a visible purple output.</p> | ||
<br clear="all"/> | <br clear="all"/> | ||
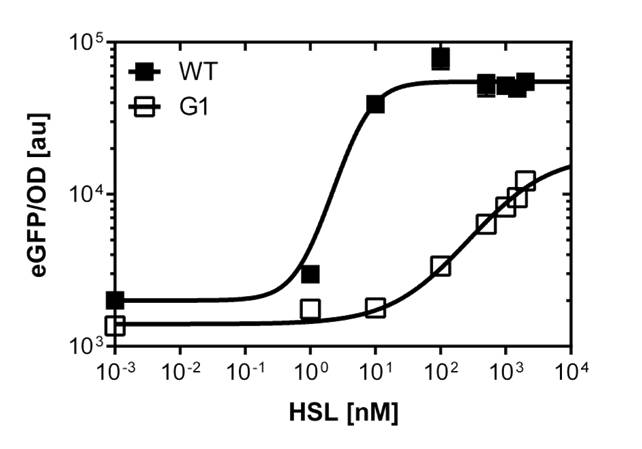
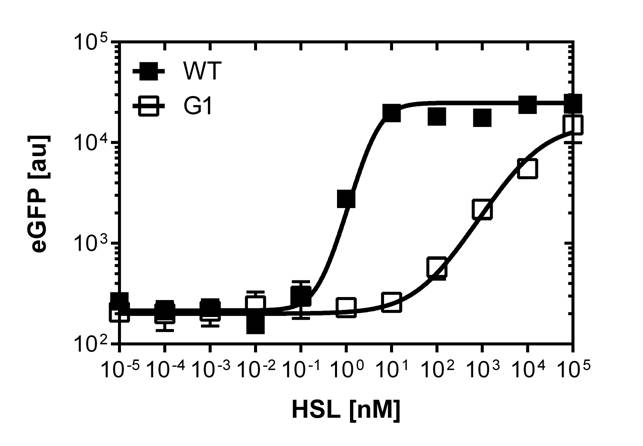
| - | [[File:Comparison.png|left|400px|thumb|<b>Figure 4 | + | [[File:Comparison.png|left|400px|thumb|<b>Figure 4: Comparison of the Wild Type and PluxR1 mutant sensitivity curves in liquid culture</b> using the BD LSRFortessa™ Flow Cytometer System<br>For the wild type :EC<sub>50</sub>=0.02nM, R<sup>2</sup>=0.84, n=1.7<br>For G1 we got :EC<sub>50</sub>=6482nM, R<sup>2</sup>=0.97, n=0.8]] |
<br clear="all"/> | <br clear="all"/> | ||
<p align="justify"><b>On agar plates</b><br><br>For the real colisweeper game we need to know about the behavior of the promoters on agar plates.<br>We set-up an experiment which consists in pooring agar plates containing different OHHL concentration going form 10<sup>-5</sup>nM to 10<sup>5</sup>nM by 10 fold increase. The wild type and the pLuxR1 promoter were streaked onto those plates to analyze the sensivity to OHHL of the wild type and the promoter on an agar plate. After 15hours of incubation at 37 degree celsius some colonies were picked and resuspended in <i>Phosphate Buffered Solution</i> (PBS) for the single cell analysis , using again the BD LSRFortessa™ Flow Cytometer System.</p> | <p align="justify"><b>On agar plates</b><br><br>For the real colisweeper game we need to know about the behavior of the promoters on agar plates.<br>We set-up an experiment which consists in pooring agar plates containing different OHHL concentration going form 10<sup>-5</sup>nM to 10<sup>5</sup>nM by 10 fold increase. The wild type and the pLuxR1 promoter were streaked onto those plates to analyze the sensivity to OHHL of the wild type and the promoter on an agar plate. After 15hours of incubation at 37 degree celsius some colonies were picked and resuspended in <i>Phosphate Buffered Solution</i> (PBS) for the single cell analysis , using again the BD LSRFortessa™ Flow Cytometer System.</p> | ||
| + | [[File:WT_and_G1_on_agar_plates.jpg|400px|left|thumb|<b>Figure 7: Comparison of the sensivity of the wild type promoter and the mutated PluxR1 promoter</b>]] | ||
<br clear="all"/> | <br clear="all"/> | ||
Revision as of 22:25, 2 October 2013
High pass filters
The detection of different OHHL levels depending on the number of mines needs to have filters in our detection system. We decided to create a high pass filter libary by doing site directed mutagenesis of the wild type [http://parts.igem.org/Part:BBa_R0062 BBa_R0062 PLuxR] promoter. The sites for mutagenisis were choosen from literature (1).
We were able to isolate a promoter having a lower expression level and beeing less sensitive than the wild type promoter (Figure 3 ont the left). The promoter is called [http://parts.igem.org/Part:BBa_K1216007?title=Part:BBa_K1216007 PluxR1 BBa_K1216007] according to his initial position in the deep well plate.
Those two different promoters BBa_R0062 and his mutated version are used to created two different high pass filter to detect the different OHHL concentrations. The two promoters were analyzed not only by 96-well plate assay and single cell analysis (FACS) but also for E.coli grown in liquid culture and on agar plate. Interestingly the EC50 value is different for cells in liquid culture versus cells of agar plates.
Native N-3-Oxo-Hexanoyl-l-Homoserine Lactone tests using the Tecan Infinite M200 PRO™ plate reader
In order to select mutated pLuxR promoters we need to know about the sensivity of the wild type construct. The test range was inspired form litterature [1]. We need to adjust the ranges for our E.coli DH5alpha strain in a second run and finally get our sensivity curve over the linear range of [0 nM],[0.25 nM],[0.5 nM],[1 nM],[2 nM],[3 nM],[4 nM],[5 nM],[10 nM],[20 nM],[30 nM],[40 nM] and [50 nM].
The experimental set-up includes a 96-well plate filled with 180 μL LB media , 10uμ of receiver cells and 10μL of different OHHL concentrations, everything in triplicates. (+ blank and negative control). The experiment runs for 16 hours in order to monitor the evolution of fluorescence and later choose the steady state to create the sensivity curve. The raw data is analyzed with GraphPad Prism 6.0.
After determination of the test ranges using the wild type promoter we apply the same protocol to the [http://parts.igem.org/Part:BBa_K1216007?title=Part:BBa_K1216007 PluxR1 BBa_K1216007] mutant in order to compare their sensivity curves. See Figure 1.
Randomized site directed mutagenesis PCR of the BBa_R0062 PluxR
The pLuxR BBa_R0062 wild type promoter was mutated using site directed mutagenesis on specific sites according to the paper [put paper here]
PluxR promoter with different sensitivity analyzed using the single cell analyzer BD LSRFortessa™ Flow Cytometer System
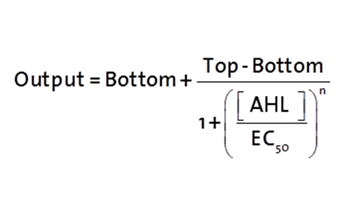
The fitting of the following graphs was perfomed using the previous equation.the equation consists of :
Output = sfGFP levels [au] (“eGFP level”)
Top = maximal sfGFP level [au] (eGFP level at “full induction”)
Bottom = minimal sfGFP level [au] (“leakiness”)
n = Hill coefficient (“cooperativity”)
EC50 = Half-maximal effective concentration (“sensitivity”)
Liquid culture and agar plate OHHL detection comparison
To gain precise data out of our fluorescence analysis, to better characterize the different promoters, we use the single analysis to obtain high throughtput data.
The protocol was the following :
From overnight cultures we inoculate 50 mL Falcon™ tubes containing 5mL LB media, 5 μL OHHL and the antibiotic. We evaluate a range of 10 different concentrations from
10-4nM OHHL to 105nM OHHL by a 10 fold increase, according to the results of the plate reader analysis. The measurements were done in duplicates.

In liquid culture
The direct plot of both sensivity curves shows the clearly shifted sensivity of the pLuxR1 promoter in comparison to the wild type BBa_R0062 promoter. The EC50 shit from 0.02nM for the wild type to 6'250 nM for the pLuxR1 promoter is equal to a 312'500 fold increase.
The wild type promoter [http://parts.igem.org/Part:BBa_R0062 BBa_R0062 PLuxR] is used for the detection of low OHHL concentrations and therefore be almost activated when one mine cell is in the vincinity of the receiver cell. The wild type promoter induces the expression of GusA, a hydrolase able to convert a specific substrate to a visible red output.The mutated promoter [http://parts.igem.org/Part:BBa_K1216007?title=Part:BBa_K1216007 PluxR1 BBa_K1216007] will be used in our final set-up to only respond to high concentrations of OHHL and therefore be activated, when two sender cells are surrounding the receiver cell, and expressing the AES hydrolase responsible for the colorimetric conversion of the specific substrate to a visible purple output.
On agar plates
For the real colisweeper game we need to know about the behavior of the promoters on agar plates.
We set-up an experiment which consists in pooring agar plates containing different OHHL concentration going form 10-5nM to 105nM by 10 fold increase. The wild type and the pLuxR1 promoter were streaked onto those plates to analyze the sensivity to OHHL of the wild type and the promoter on an agar plate. After 15hours of incubation at 37 degree celsius some colonies were picked and resuspended in Phosphate Buffered Solution (PBS) for the single cell analysis , using again the BD LSRFortessa™ Flow Cytometer System.
References
(1) Geske G.D.,Evaluation of a focused library of N-aryl L-homoserine lactones reveals a new set of potent quorum sensing modulators.
 "
"


