Team:ETH Zurich/Optimization
From 2013.igem.org
Contents |
Evaluation of the leakiness within the receiver cell system
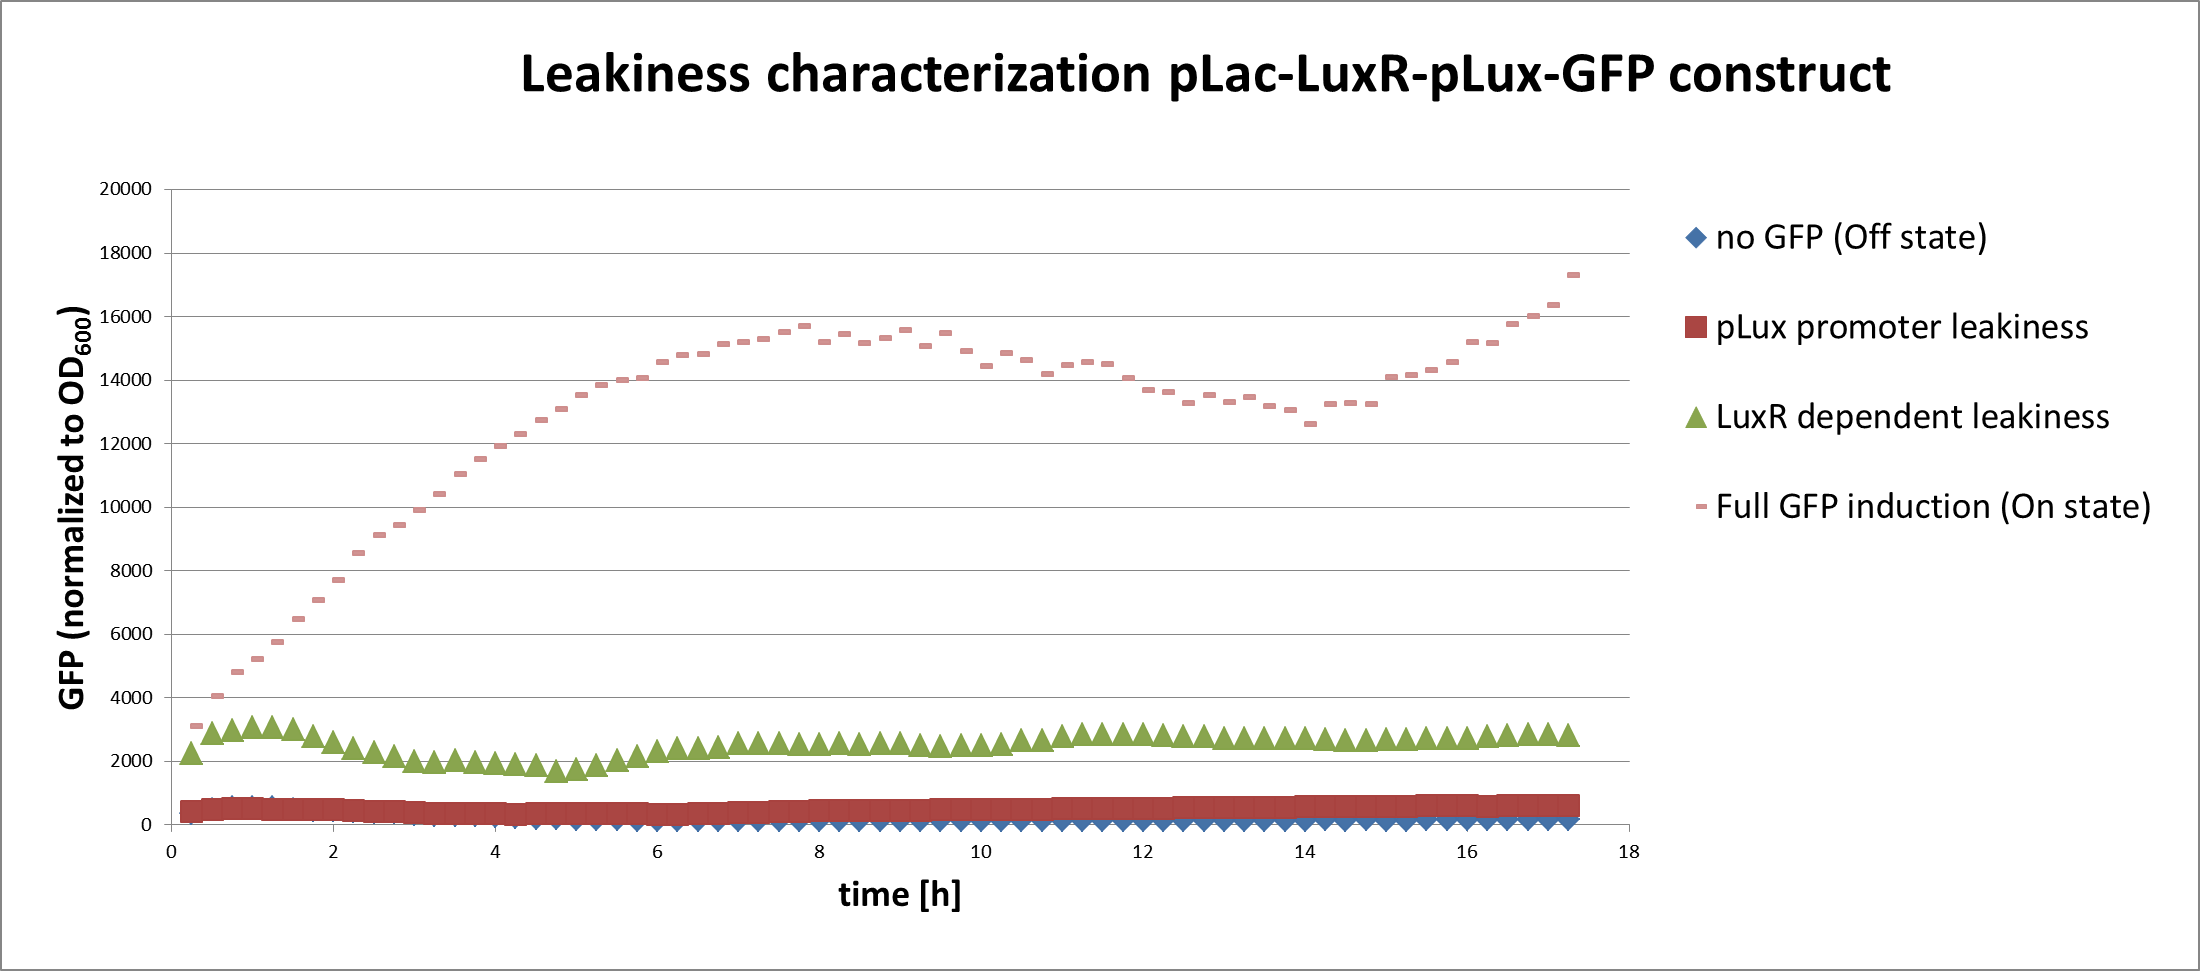
In a first experiment we had to find the source of the leakiness in our basic receiver cell system. In the absence of AHL the expression of GFP can either result from an inducer-independent activation of the pLuxR promoter or from an AHL-independent activation of the promoter through the LuxR protein. To test for these two possibilities we tested different constructs (Figure 1) in liquid cultures and analyzed the GFP fluorescence over time with the TECAN plate reader. The experiments were conducted in triplicates and for activation 100nM AHL was used. Levels of fluorescence were normalized to the OD600.
The pLac-LuxR-pLuxR-GFP reporter system showed significant leakiness in the absence of AHL. We defined the background using a construct without GFP (Figure 1, first construct). We used a simple pLuxR-GFP construct without LuxR protein (Figure 1, second construct) to measure the basal expression resulting from promoter leakiness alone. The measured signal is comparable to background levels, suggesting that pLuxR promoter per se is remarkably tight.
The complete pLac-Lux-pLuxR-GFP receiver construct (Figure 1, third construct) in the absence of AHL induction shows a jump in the measured GFP levels. This results suggest that most of the leakiness comes from an activation of the pLux promoter through LuxR alone, meaning in the absence of the AHL inducer (Figure 3).
Addition of AHL (Figure 1, fourth construct) determines a steep 5-7 times GFP induction. We concluded, that a reduction of the LuxR dependent basal activation could significantly improve the On/Off Ratio.
Introduction of a negative feedback loop to reduce LuxR levels
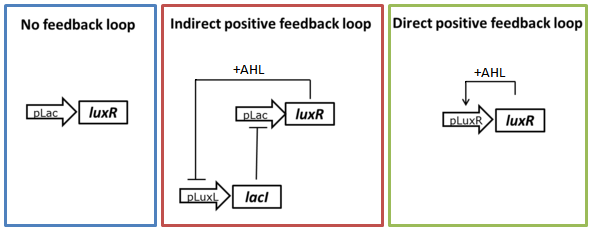
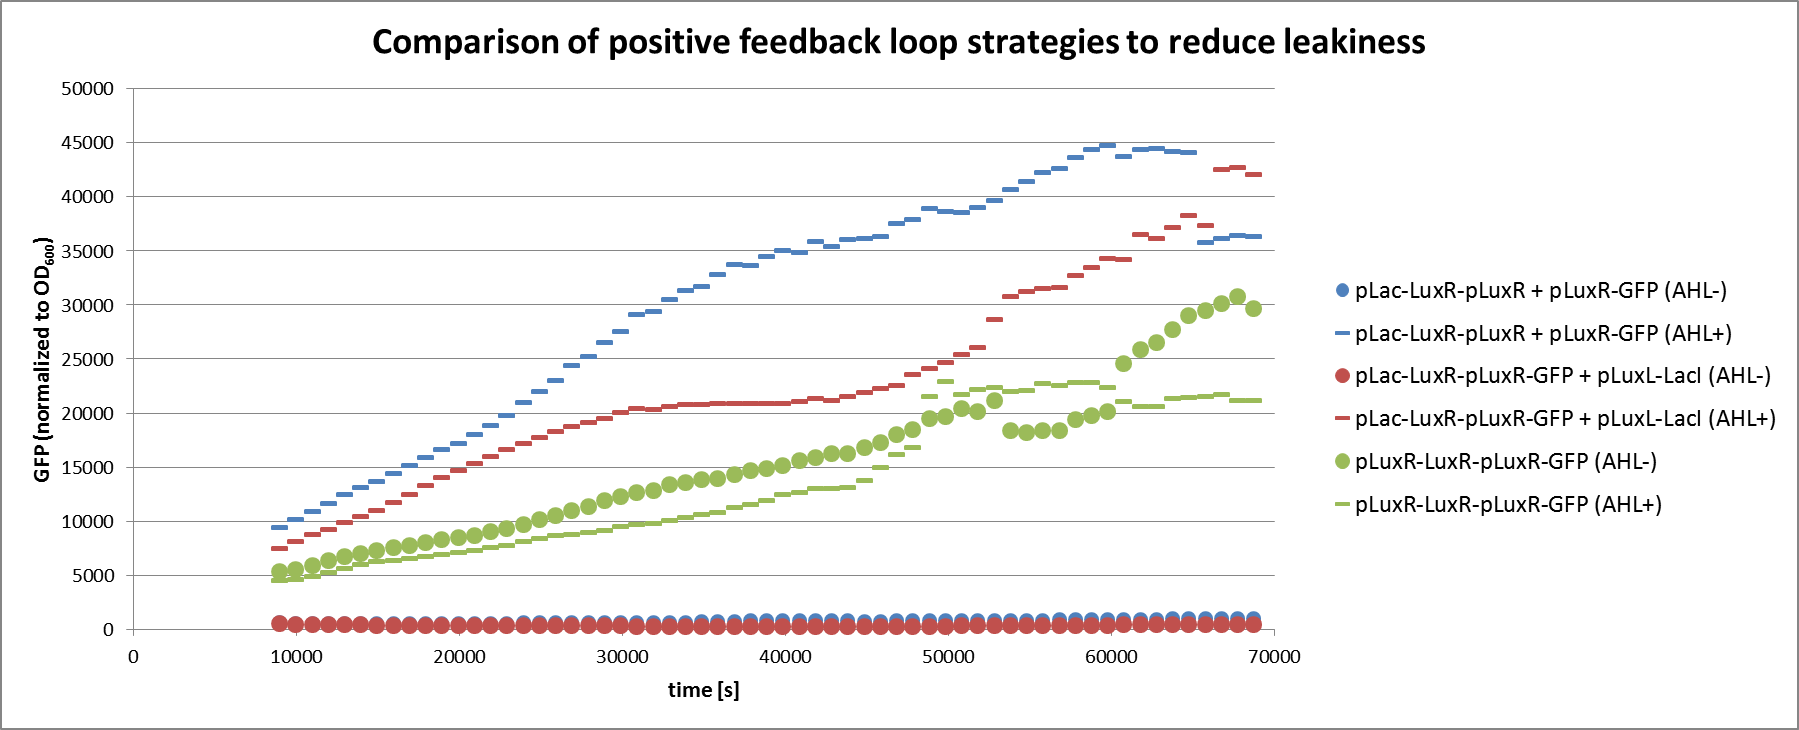
As described in the circuit optimization part we tried to lower the amount of LuxR present in the uninduced state by testing two different positive feedback loop motives (Figure 3). The constructs were tested in liquid culture over time and compared to the basic receiver cell circuit with constitutive expression of LuxR. The experimental set-up and data analysis was done similar to the experiment described above.
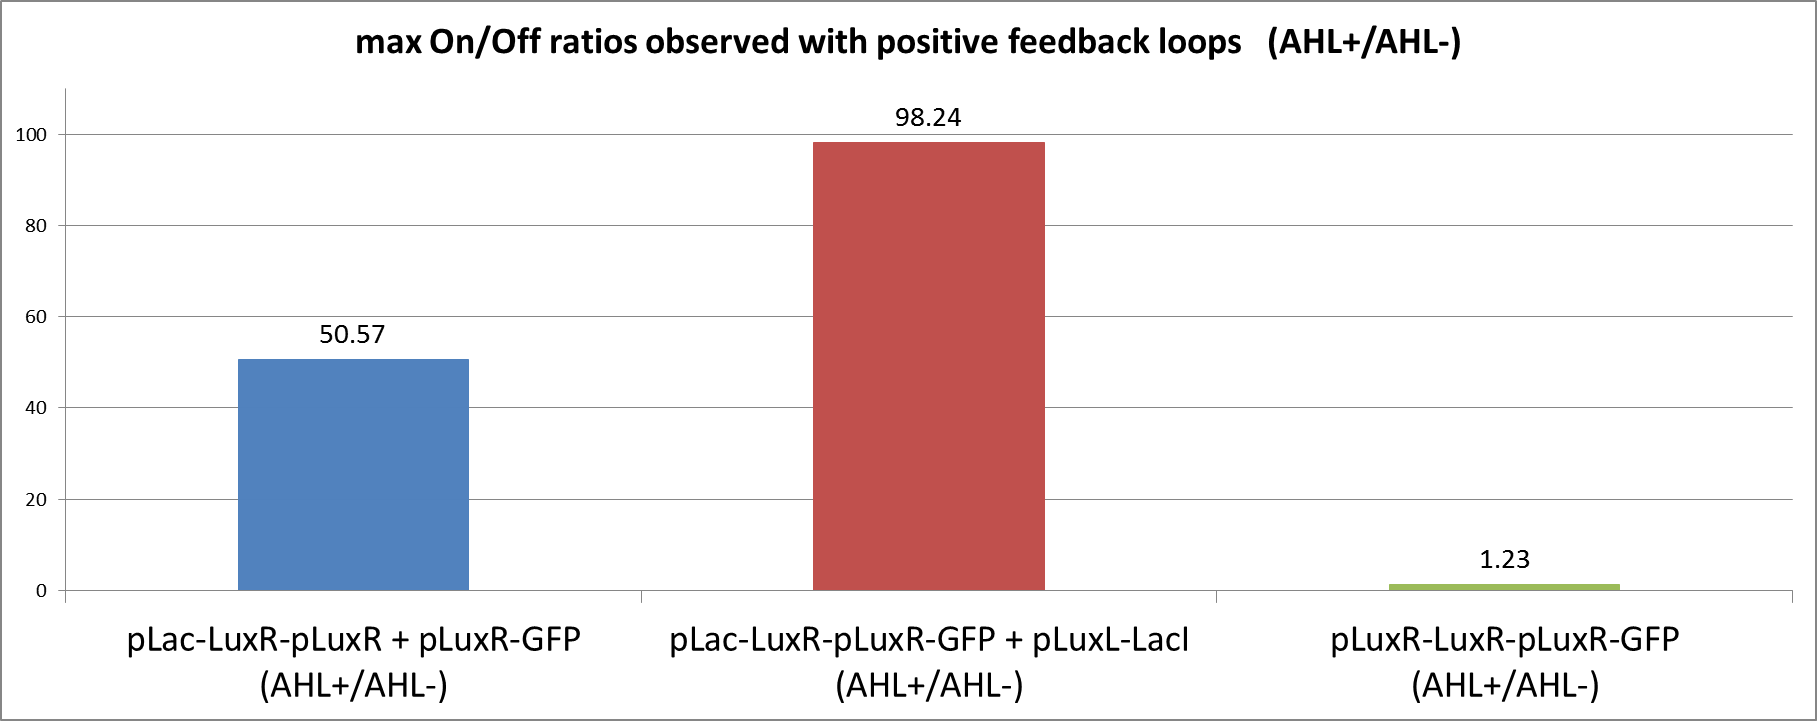
We can clearly see from the data that the direct feedback loop were LuxR is put under its own promoter does not work (Figure 4). There is no difference visible between the induced and the uninduced state. We assume that the high plasmid copy number of the construct and the resulting high amount of LuxR could be the reason. The second strategy with the indirect feedback proved to work very well instead. Comparing the maximal On/Off ratios achieved during the time course, we can see a two-fold improvement of the indirect feedback loop over the non-optimized circuit (Figure 5). The reason for the high On/Off ratio is a almost complete reduction of the basal GFP expression.
Fine-tuning of the pLac driven LuxR using glucose
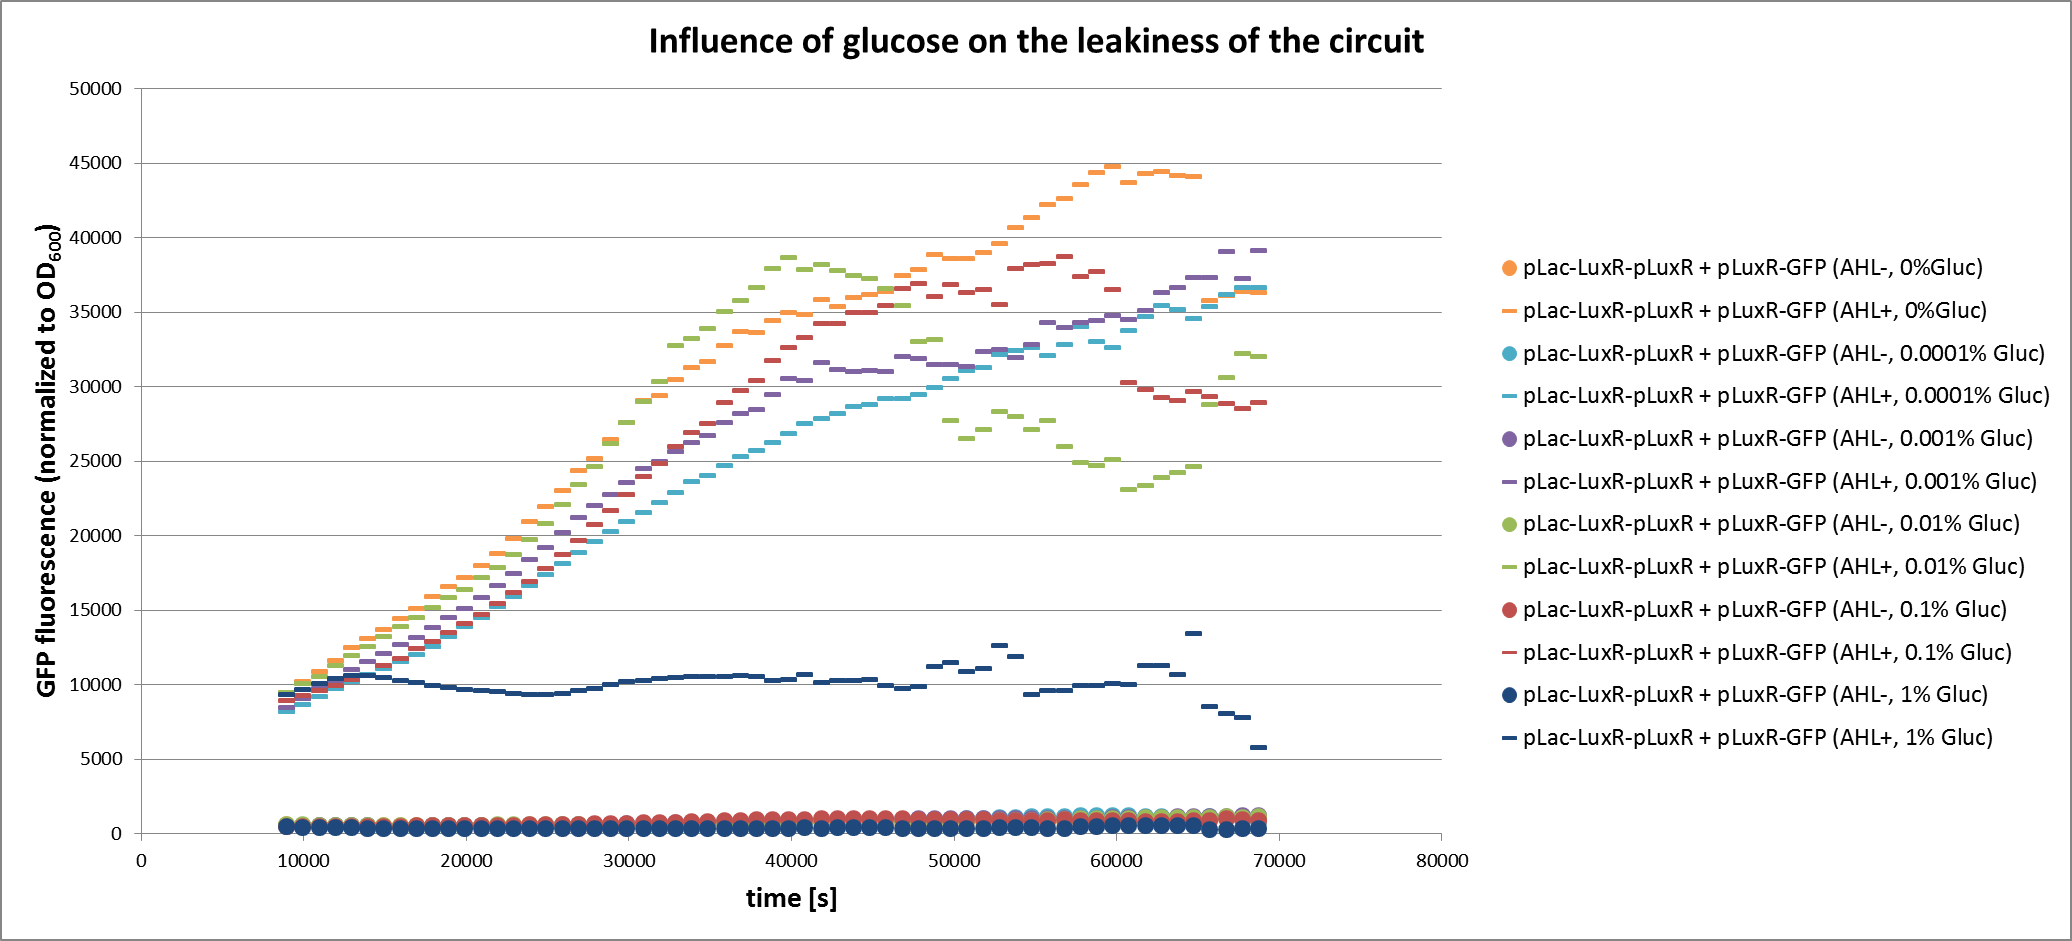
The second approach that we tested experimentally is the use of glucose to repress expression of LuxR. We tested the simple GFP receiver construct under different concentrations of glucose with and without induction by AHL. The fluorescence was measured over time.
 "
"


