Team:ETH Zurich/Experiments 6
From 2013.igem.org
GFP diffusion tests with sender cells and wild-type PLuxR receiver constructs
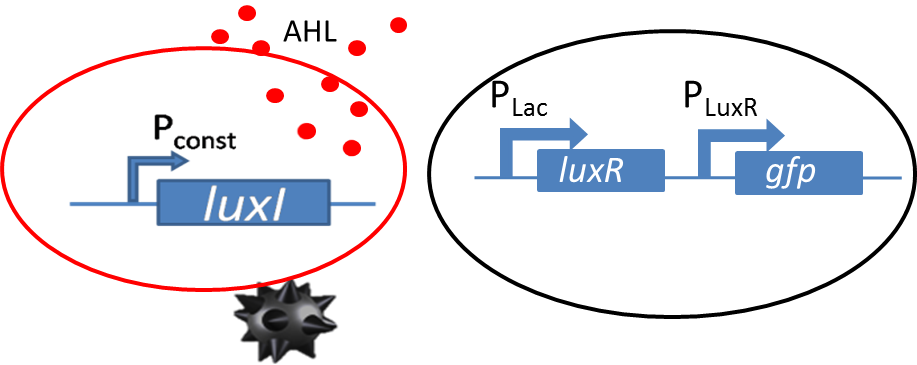
Diffusion experiments were performed to study AHL diffusion from the sender colonies to the receiver colonies. The sender receiver ciruit is shown in the figure to the left. The sender colonies consist of the luxI ([http://parts.igem.org/Part:BBa_K805016 BBa_K805016]) producing AHL under a constitutive promoter. The luxI produces AHL that diffuses through the agar. The diffused AHL reaches the non-mine and is processed via promoter part [http://parts.igem.org/Part:BBa_J09855 BBa_J09855] cloned with GFP was used as our receiver. The presence of GFP in the receiver colonies is then co-related to the amount of AHL processed by the receiver colonies.
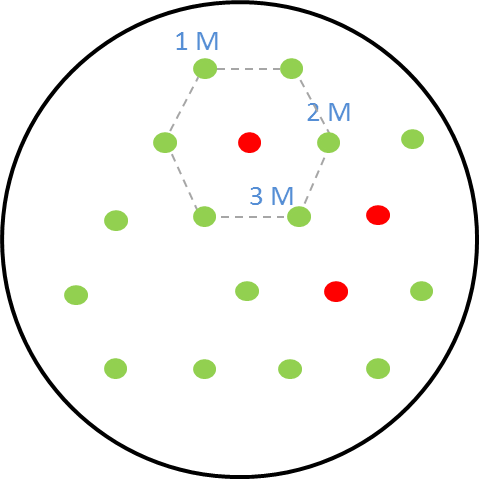
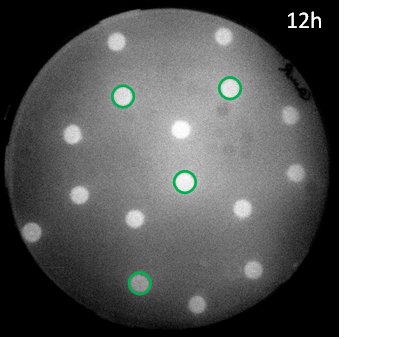
The picture on the right shows the schematic diagram of the experimental set-up for the GFP as reporter in the receiver cells. The colonies are placed in a hexagonal grid pattern. The circles represent colonies on the agar plate. The green circles are the non-mine receiver cells with GFP as the reporter. The circles that are colored red are the mine colonies that secrete the signalling molecule AHL. As our mine grid design is a honeycomb pattern, we play the game with one, two and three mines. This explanation is given here. The numbers 1, 2 and 3 in the diagram represent the receiver colonies that are surrounded one, two and three mines respectively. The same set-up was used for the experiments and the florescence images were taken of the receiver colonies at various time points.
</p>
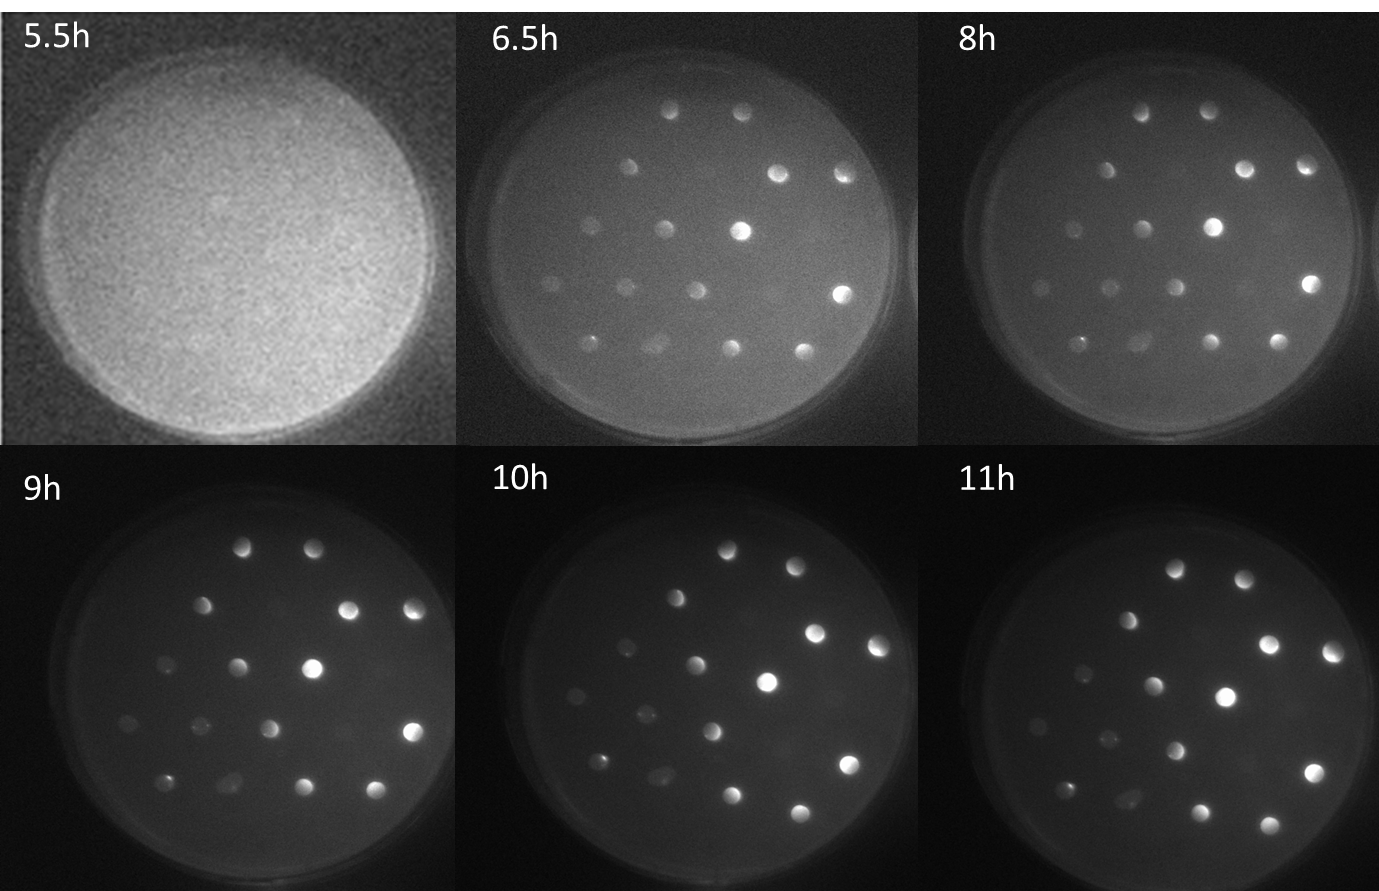
The figure shows a series of scanned fluorescence images of the agar plate with the sender-receiver colonies plated in the same manner as in the schematic diagram. The images were taken every half hour since the first fluorescence was observed. This was observed at 5.5 hours after incubation at 37C. At nearly 6.6h, difference in the GFP levels can be observed in colonies.
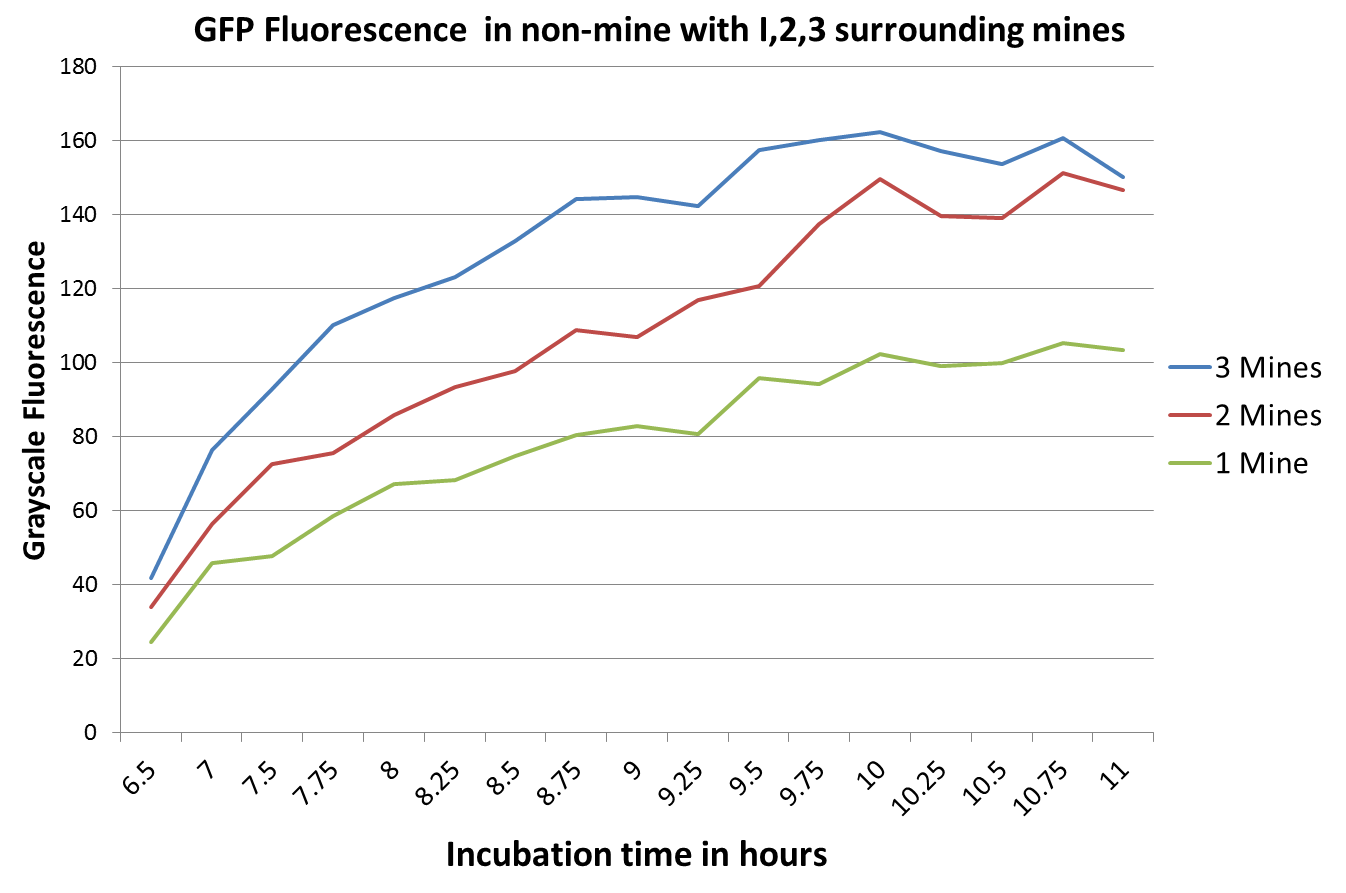
<p align= "justify">The graph on the right shows the relative intensity of the GFP signal in the receiver colonies with one, two and three adjacent mine colonies at different timepoints. All scanned images of the plate similar to the one depicted above were analyzed using the image processing program ImageJ. The GFP fluorescence reaches saturation after 11 hours of incubation at 37℃ . Due to the presence of more mine colonies, more AHL molecules are processed by the non-mine and higher fluorescence can be observed. Three adjacent mines lead to the highest value of fluorescence compared to two or one adjacent mine colonies. This data is qualitatively similar to the model, but GFP expression is quantitatively different in comparison to the model.
GFP diffusion tests with sender cells and mutated PluxR promoter receiver constructs
Also the mutant promoter [http://parts.igem.org/Part:BBa_K1216007 BBa_K1216007] we obtained through site-saturation mutagenesis was tested in the hexagonal grid experiment with LuxI sender cells. The sensitivity for AHL (EC50=12'555 nM) was very low and only in the case where three mines surround a receiver colony some fluorescence could be observed. Still the results are consistent with the model predictions and led to the rational design of additional promoter mutants, where either one of the two point mutions was changed back with the goal to recover some of the sensitivity of the wild type.
 "
"


