Team:ETH Zurich/GFP
From 2013.igem.org
Contents |
Reaction-diffusion model: genetic circuit with GFP as reporter gene
In our first spatio-temporal model, we wanted to find out if (i) a suitable OHHL gradient is formed and (ii) validate the model with experimental data, as a proof of concept. Essentially we model the receiver cells containing GFP under the control of PLux promoter. Subsequently, we simulate a 2D spatio-temporal reaction-diffusion system with COMSOL Multiphysics.
Video: GFP expression levels over 11 hours, concentration in mol/m3. Distance between colonies: 1,5 cm.
OHHL diffuses in and out mine cells, however the concentrations of species are time- and space-dependent. Thus the change of concentrations over time is given by system of non-linear partial differential equations (PDEs). Each equation represents the rate of change of species' continuous concentration as a sum of terms representing biological processes, such as production, degradation and regulation. The regulation is captured with Michaelis-Menten functions. An important assumption is that specific cellular processes like transcription and translation are not modeled explicitly, but lumped together.
Our system consists of two types of genetically engineered colonies: (i) Mine Cells and (ii) Receiver Cells, that can be treated as modules that communicate only by a single molecule, OHHL. Additionally, we include the decay of OHHL while diffusing through the agar plate.
Mine cells
Two proteins are produced by mine cells: (i) LuxI and (ii) NagZ; both genes are constitutively expressed. Additionally, the synthesis of OHHL is carried on by these sender cells; the product of luxI gene is directly involved in the synthesis of the signalling molecule, using as substrates S-adenosylmethionine (SAM) and an acylated acyl carrier protein (ACP) from the fatty acid biosynthesis pathway (Schaefer et al., 1996). We assume precursor molecules are provided by the cell in non-limiting conditions.
The system of equations for the states involved in the sender module are given below:
Agar plate
In the agar plate no reactions take place; hence only two processes of interested are considered: (i) diffusion and (ii)decay of the diffused signal, OHHL (Eq 6).
Receiver cells
Receiver cells are responsible for processing the signal sent by the mine cells. OHHL acts as the input signal and the output is green fluorescence whose intensity correlates with the sensed OHHL concentration by receiver cells; for this purpose GFP expression is under the control of pLux promoter. Once OHHL molecules reach a non-mine colony, they can bind to LuxR protein, and the complex LuxR/OHHL acts as a transcriptional activator. Therefore, this module works as a high pass amplitude filter for GFP, since it is produced when the OHHL levels are sufficiently high.
The system of equations for the states involved in the sender module are given below:
The parameters used for the simulation correspond to values reported in literature and some of them were obtained from our experiments, like the growth rate and the affinity constant of the dimer LuxR/OHHL. Also, simulations were initialised using steady state concentrations from single cell model for sender and receiver cells.
Results: Simulation
The goal of the simulation was to compare it to experimental results, thus it was conducted for 11 hours and with 3 mine cells to mimic the experimental setup (Figures 1-4). It can be seen that the predicted time scale for the expression of GFP from the simulation and the experimental results are congruent. In addition, it is very important to point out that:
- 1. The intensity of the GFP correlates with the number of adjacent mines, thus a suitable OHHL gradient is formed.
- 2. The contribution from the basal expression cannot be neglected.
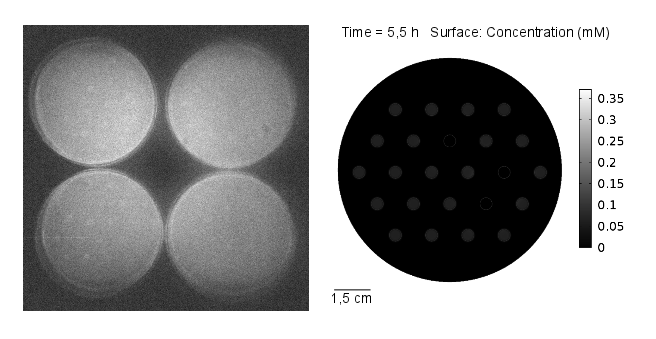
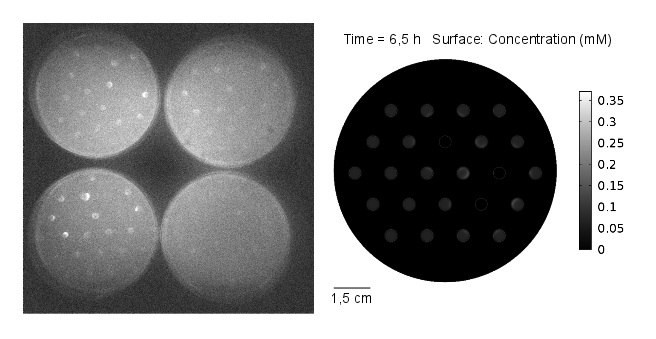
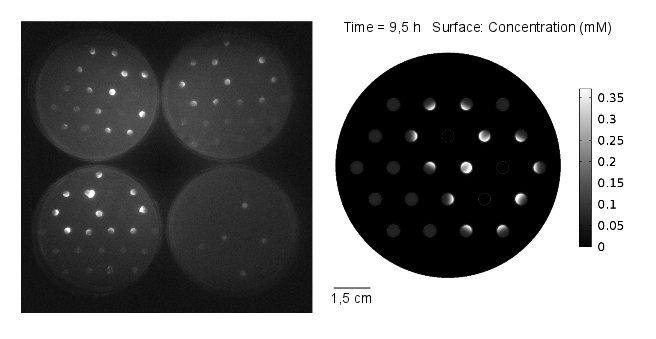
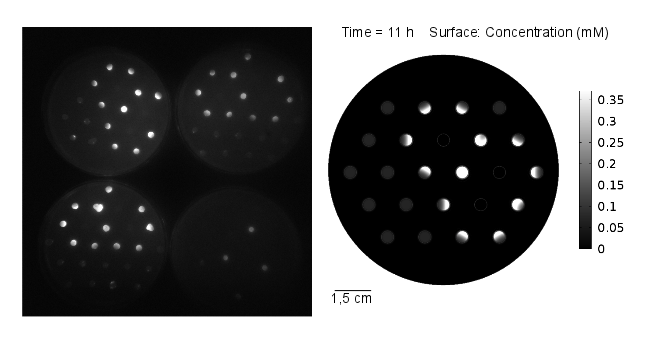
From figures 1-4 we can conclude that experimental results and model predictions are in good agreement. Moreover, previous observations about activation by complex LuxR/AHL and time scales (OHHL Reaction-Diffusion) are consistent with this findings. At 5.5 hours, there is non-differencial activation by LuxR/OHHL complex which can be visualized as non-differential expression of GFP. At 6.5 hours, we start to see some differential expression of GFP related to the number of neighbouring mine colonies. Finally, after 11 hours, it is possible to clearly distinguish between 0, 1 and 2 neighbouring mines by GFP intensity. However, the difference in fluorescence in the case of 2 and 3 neighbouring mines, it is not significant. Hence, we decide to move to a three neighbours setup; removing the internal colony in the hexagonal grid and restrict to a maximum of 2 neighbouring mines.
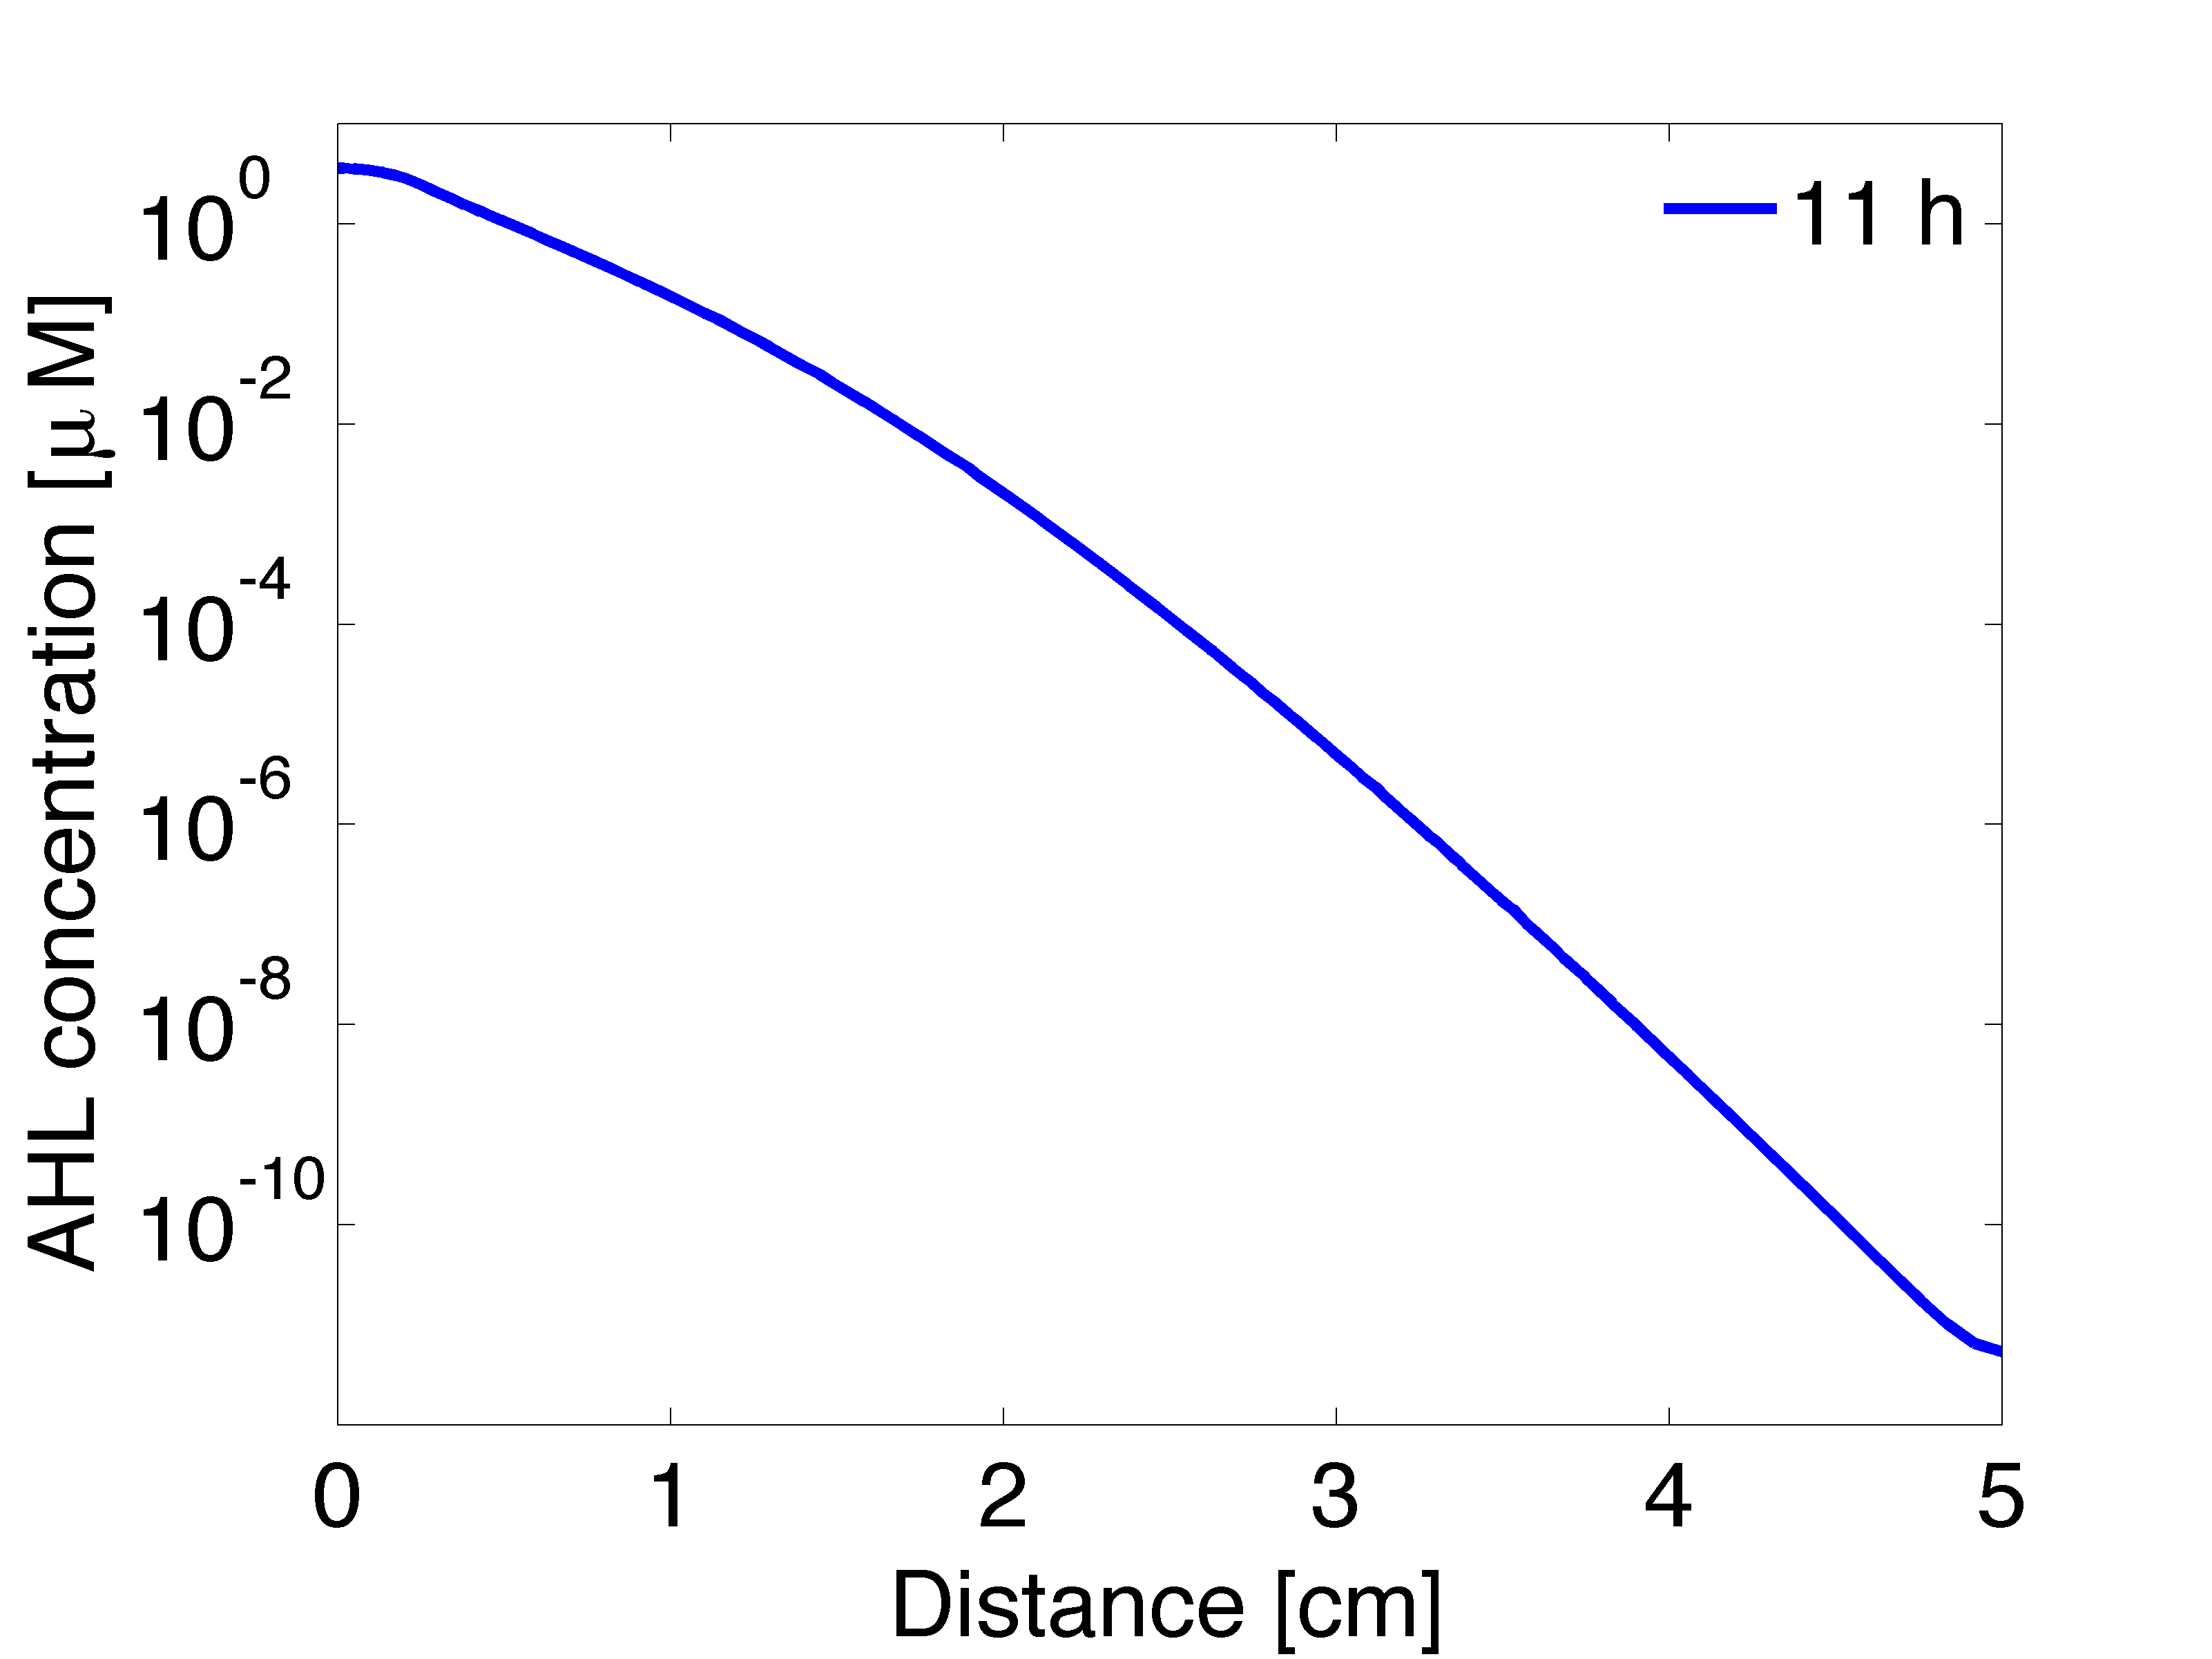
Regarding the OHHL concentration gradient after 11 hours, the experimental results are consistent with the simulation (Fig 5).
 "
"


