Team:ETH Zurich/Experiments 3
From 2013.igem.org
Contents |
Enzyme-substrate reactions
To generate visible output by adding substrates to colonies in Colisweeper, we made use of orthogonal enzyme-substrate reactions. A set of chromogenic substrates was chosen to produce different colors depending on the abundant hydrolases and thereby to uncover the identity of each colony to the player.
The set of enzyme-substrate pairs chosen for the Colisweeper project, and characterizations of their reactions, are described below. Information on other possible substrates that can be used for the enzymes of the Colisweeper reporter system can be found in the reporter system section.
To characterize the hydrolases used in Colisweeper, we conducted substrate tests in liquid cultures as well as on colonies, enzyme kinetics and detection of HIS-tagged protein by Western Blot. Additionally, crosstalk assays and color overlay tests (multiple enzyme-substrate reactions together) have been performed with the triple knockout ΔaesΔgusAΔnagZ for this project. A listing of chromogenic and fluorogenic substrates used can be found in the overview table below.
Overview of enzyme-substrate reactions
| Hydrolase | Substrate | Absorption λmax or Excitation/Emission | Stock solution | Liquid culture: final concentration | Colonies: 1.5 μl of substrate solution |
Response time on E. coli colonies, at RT |
|---|---|---|---|---|---|---|
| LacZ | 5-Bromo-4-Chloro-3-indoxyl-β-D-galactopyranoside (X-Gal) | Blue, 615 nm |
0.5 M in DMSO | 1 mM | 50 mM | ~ 10 minutes |
| N-Methyl-3-indolyl-β-D-galactopyranoside (Green-Gal) | Green, 665 nm |
0.1 M in DMSO | 1 mM | 50 mM | ~ 15 minutes | |
| GusA | 6-Chloro-3-indolyl-β-D-glucuronide (Salmon-Glc) | Salmon, 540 nm |
0.3 M in DMSO | 1.5 mM | 0.1 M | ~ 5 minutes |
| 4-MU-β-D-Glucuronide | Blue (fluorescent), 372 nm (λEx), 445 nm (λEm) |
50 mM in DMSO | 100 μM | - | ~ 5 minutes | |
| PhoA | 4-Nitrophenoyl-phosphate (pNPP) | Yellow, 405 nm |
0.5 M in DEA | 50 mM | 0.5 M | ~ 1 minute |
| 5-Bromo-4-Chloro-3-indolyl phosphate (BCIP) | Blue, 615 nm |
0.1 M in H2O | 1 mM | 50 mM | ~ 30 minutes | |
| 4-MU-phosphate | Blue (fluorescent), 372 nm (λEx), 445 nm (λEm) |
50 mM in DMSO | 50 μM | - | ~ 5 minutes | |
| Aes | 5-Bromo-6-Chloro-3-indoxyl butyrate (Magenta butyrate) | Magenta, 565 nm |
0.5 M in Acetone | 0.1 mM | 20 mM | ~ 2 minutes |
| 5-Bromo-6-Chloro-3-indoxyl caprylate (Magenta caprylate) | Magenta, 565 nm |
0.2 M in Acetone | 1 mM | 0.2 M | overnight | |
| 4-MU-butyrate | Blue (fluorescent), 372 nm (λEx), 445 nm (λEm) |
50 mM in DMSO | 150 μM | - | ~ 5 minutes | |
| NagZ | 4-Nitrophenyl- N-acetyl-β-D-glucosaminide (pNP-GluNAc) | Yellow, 405 nm |
15 mM in H2O | 0.01 mM | 15 mM | ~ 1 minute |
| 5-Bromo-6-Chloro-3-indolyl N-acetyl-β-D-glucosaminide (Magenta GluNAc) | Magenta, 565 nm |
0.1 M in DMSO | 1 mM, supplemented with BSA | 50 mM, with BSA added | ~ 15 minutes | |
| 5-Bromo-4-Chloro-3-indolyl N-acetyl-β-D-glucosaminide (X-GluNAc) | Blue, 615 nm |
0.1 M in DMSO | 1 mM, supplemented with BSA | 50 mM, with BSA added | ~ 15 minutes |
Acetyl esterase (Aes)
Chromogenic assay
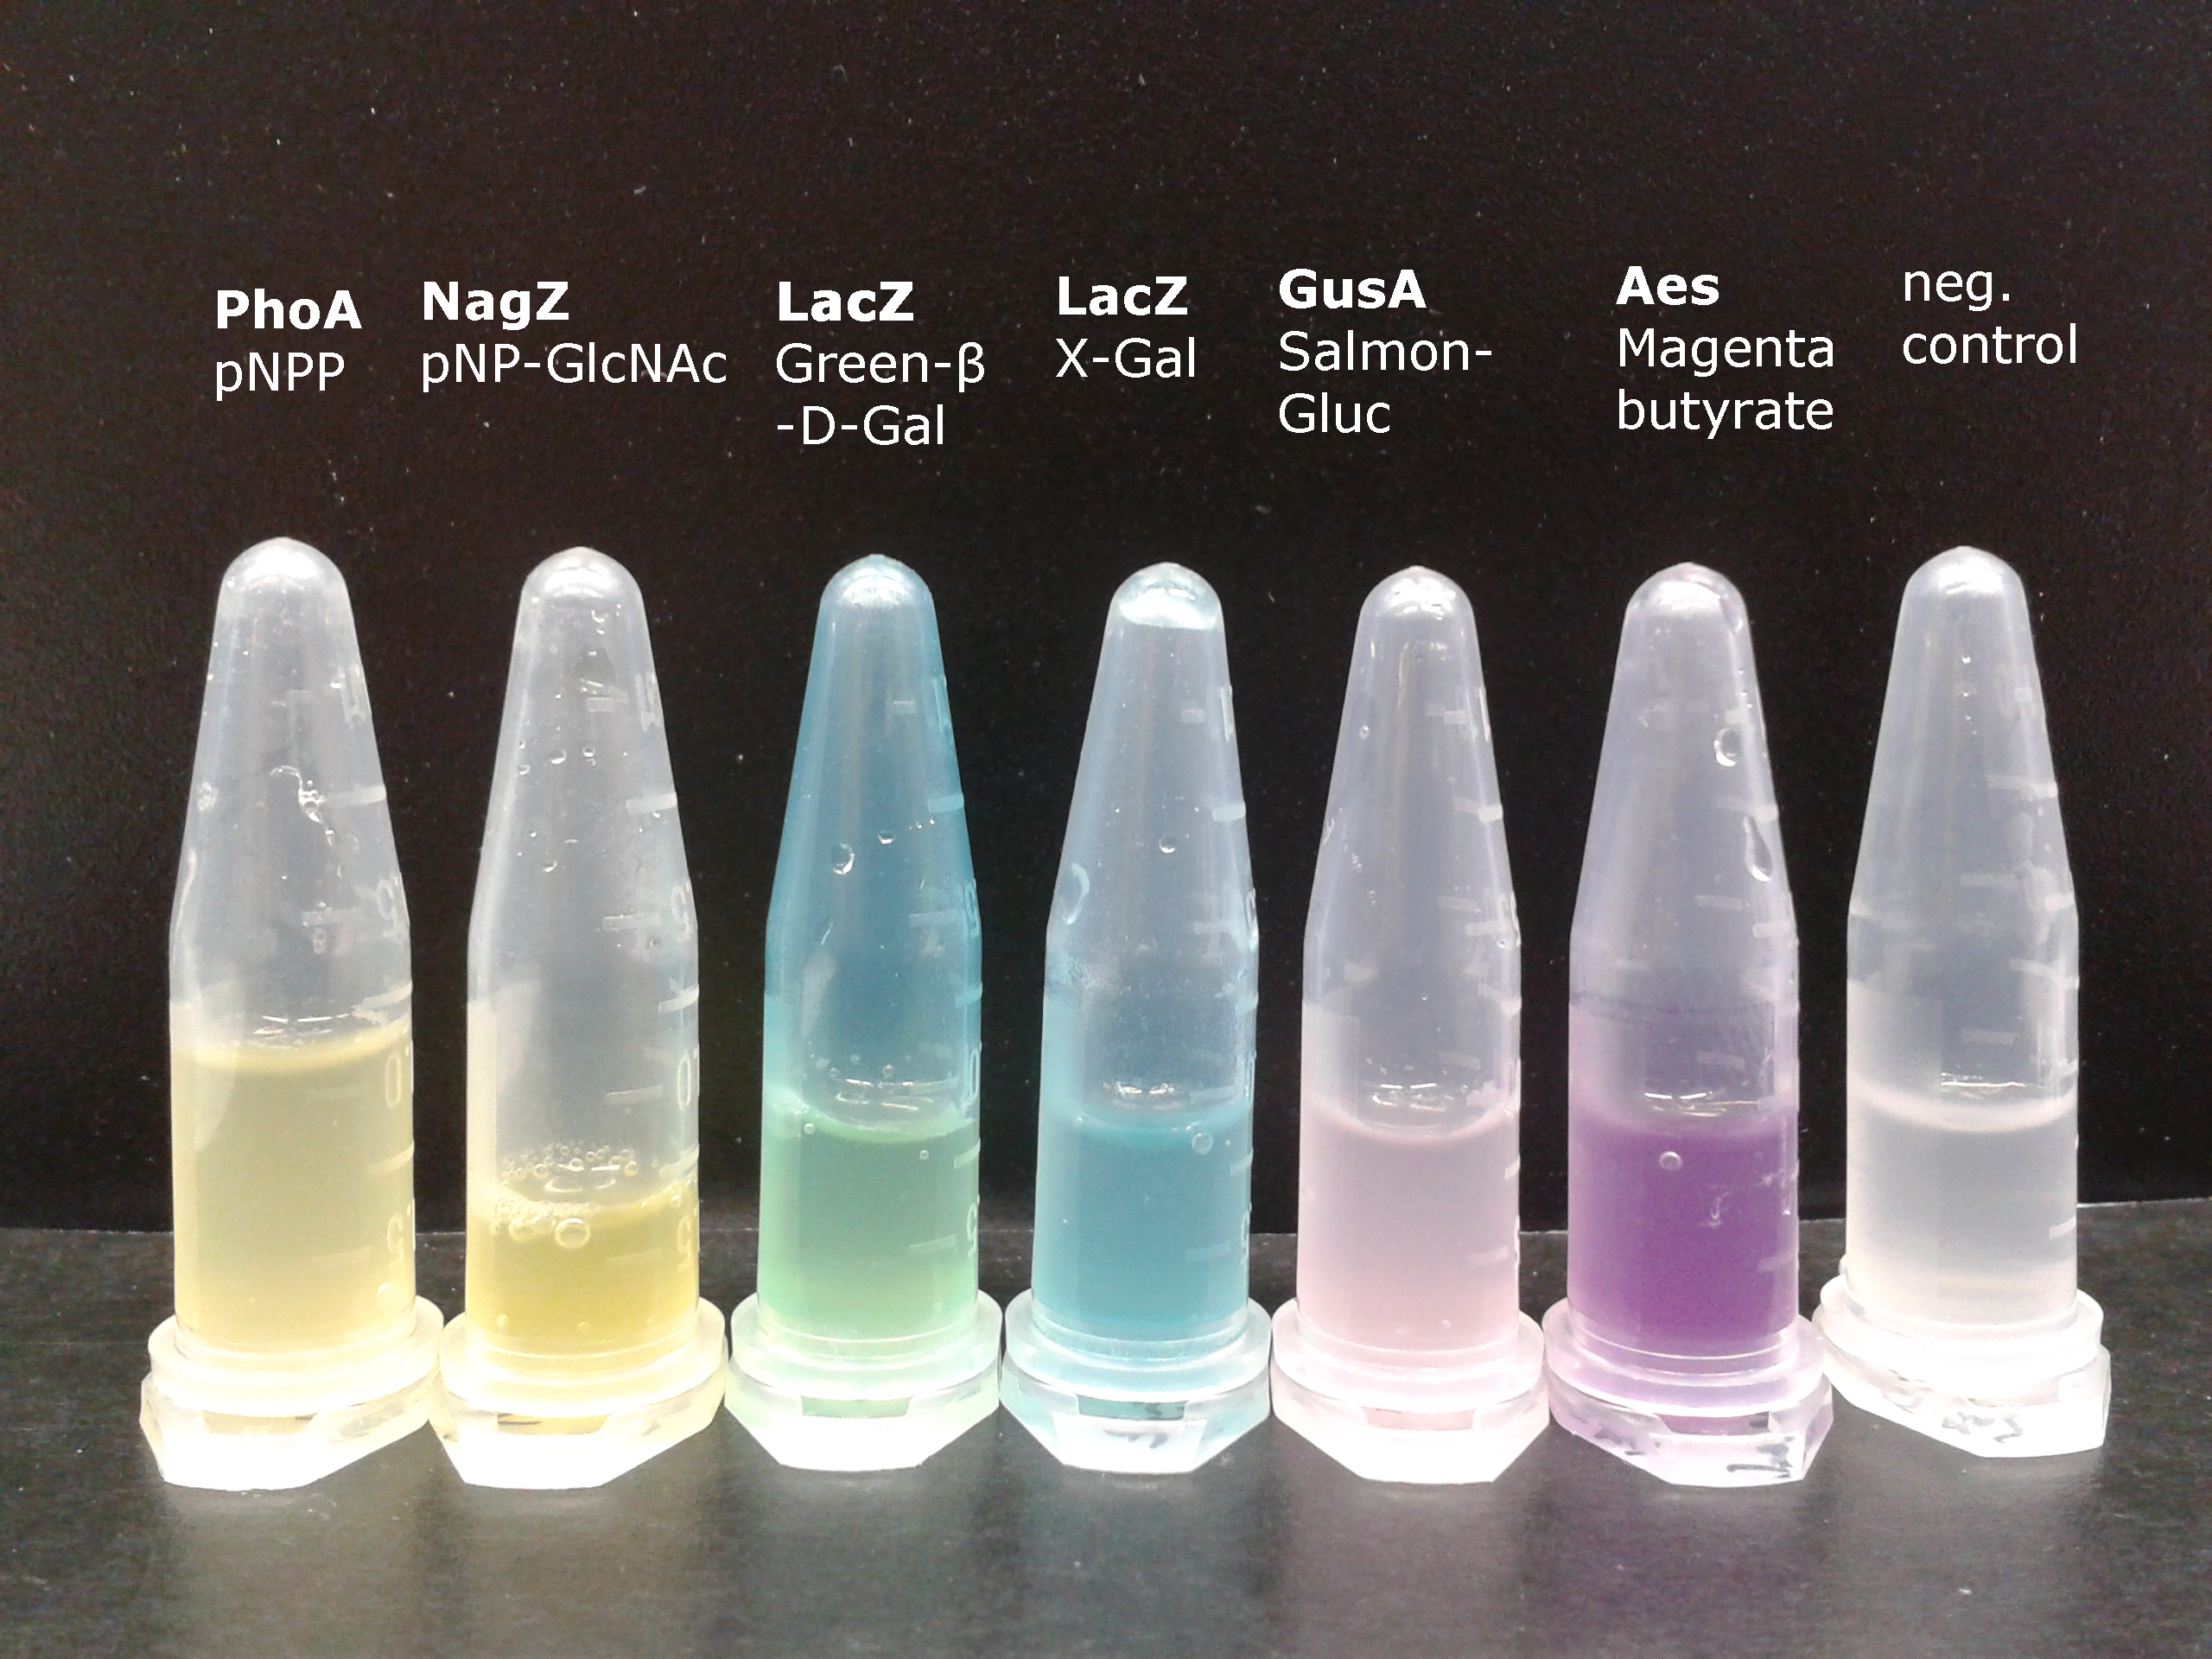
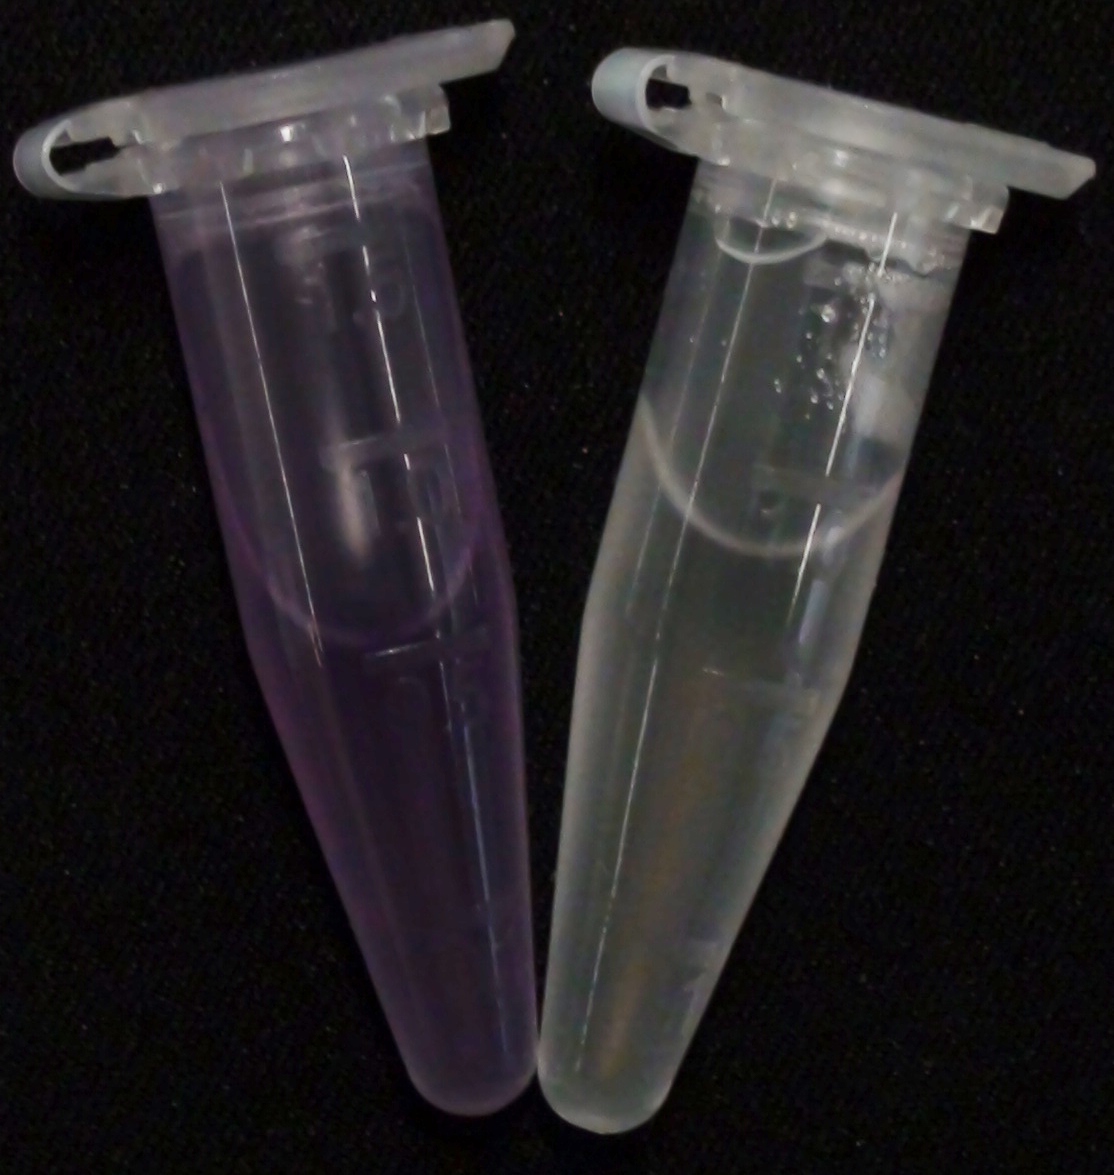
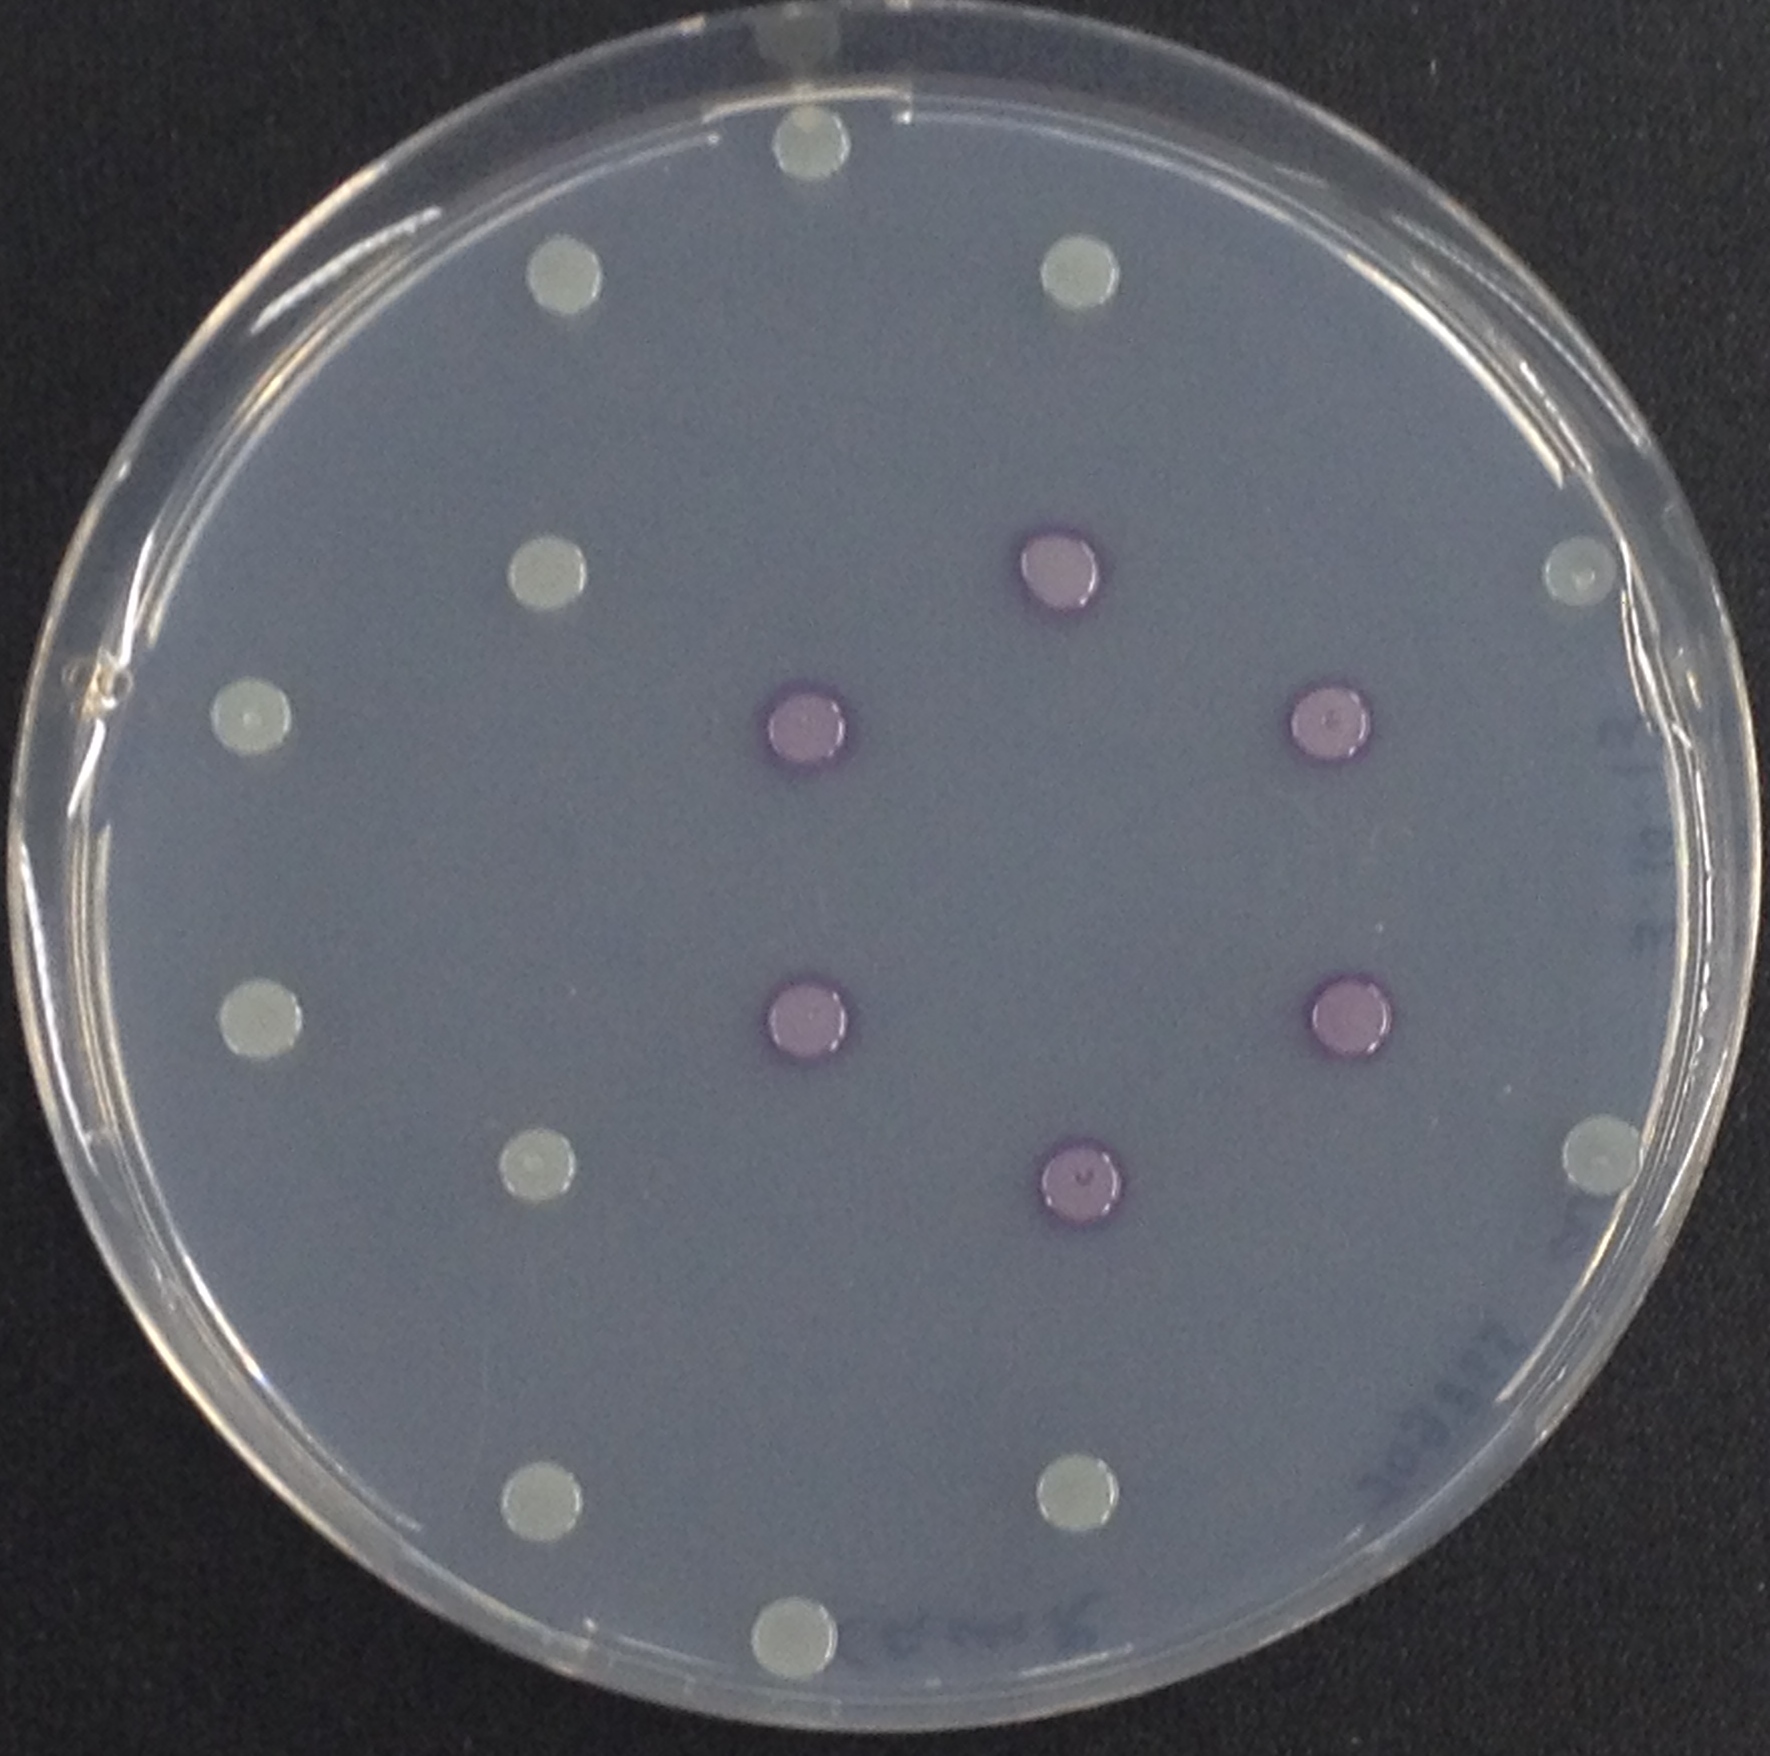
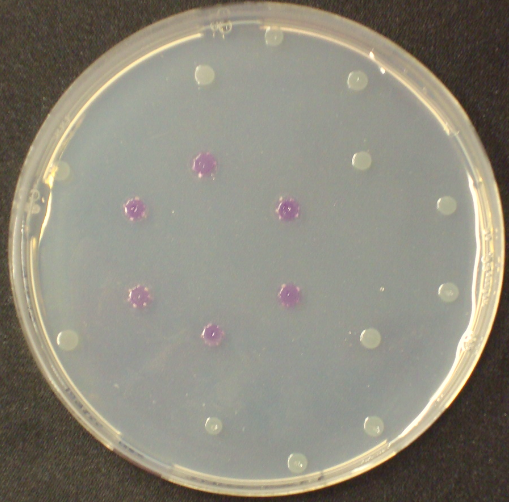
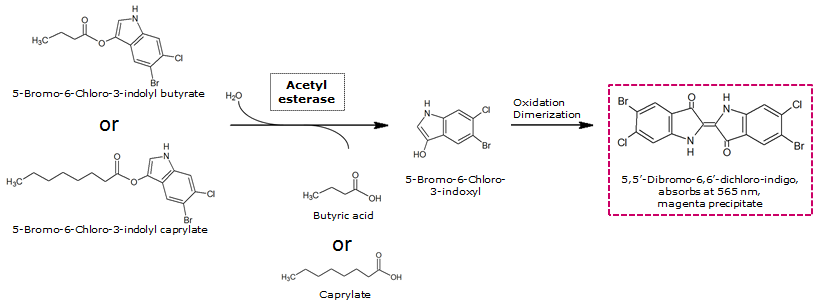
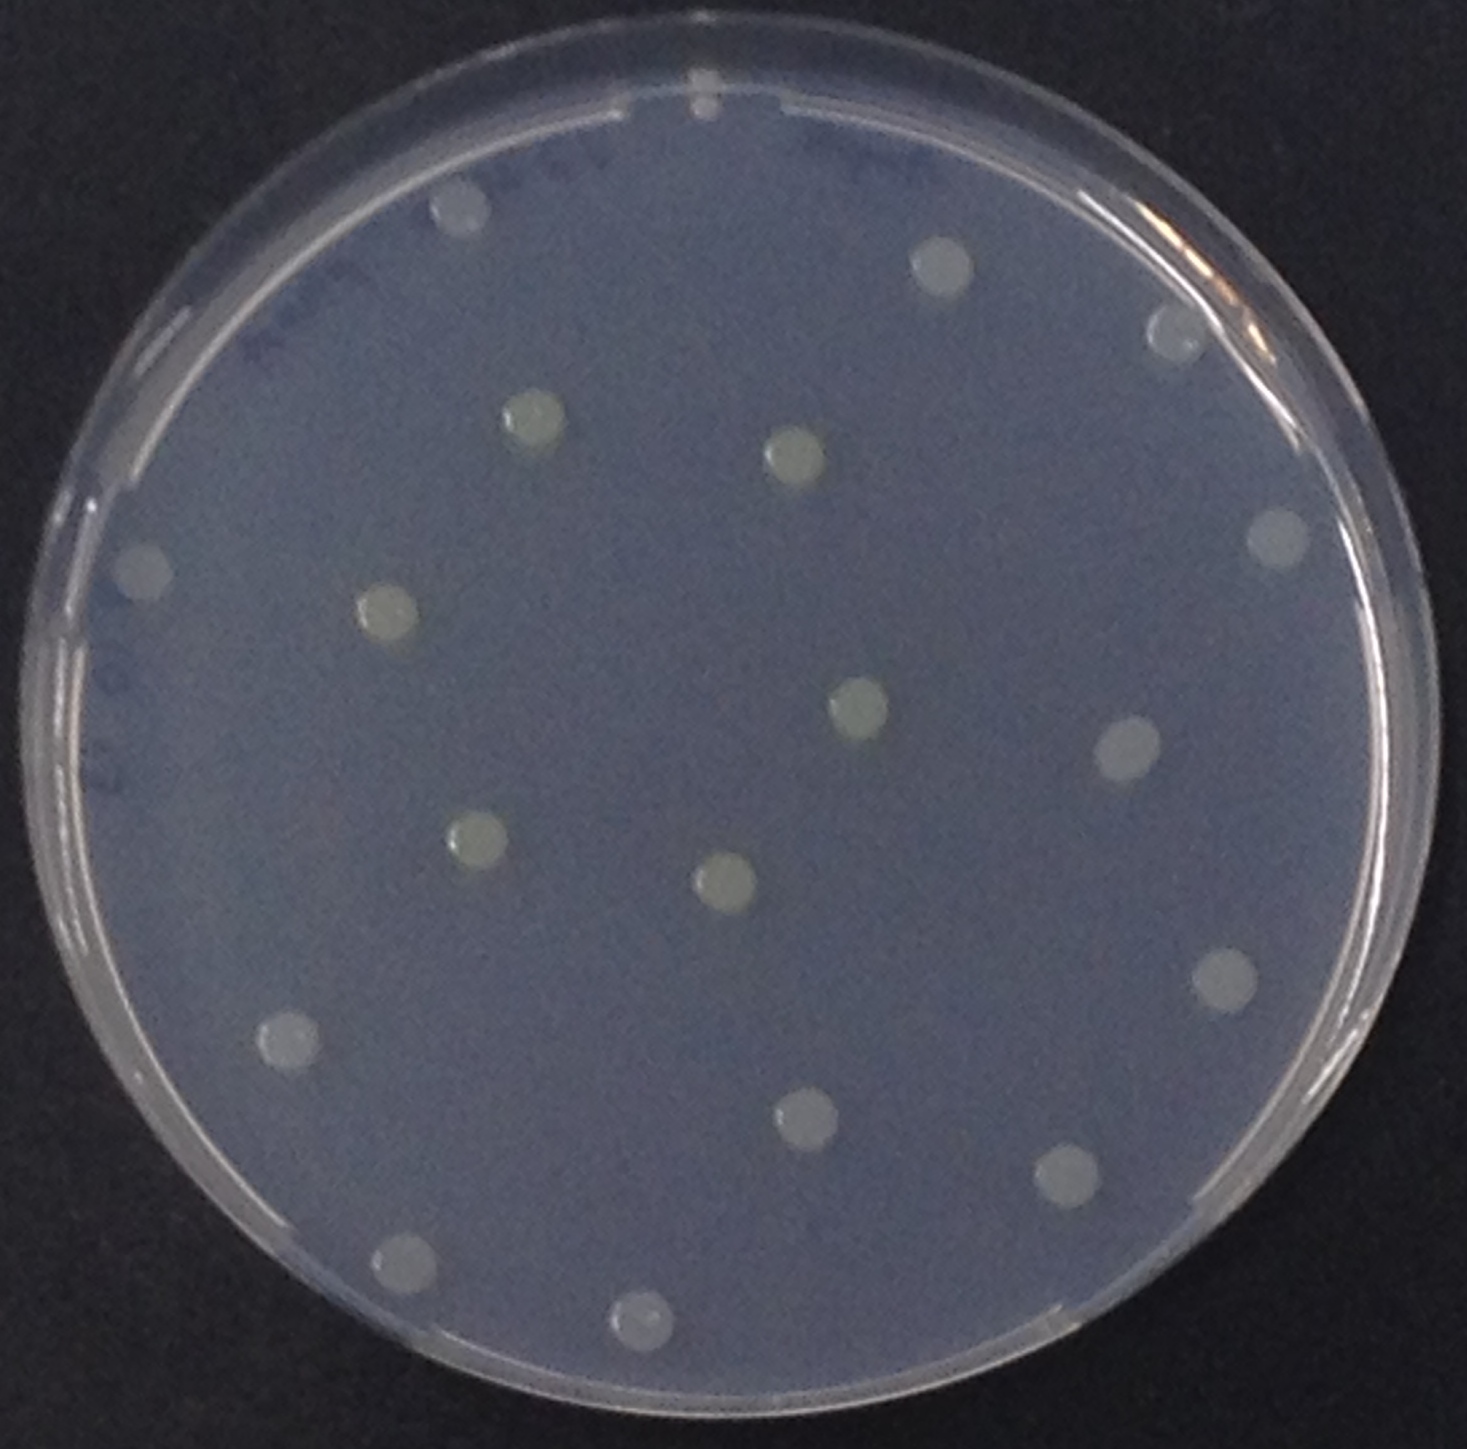
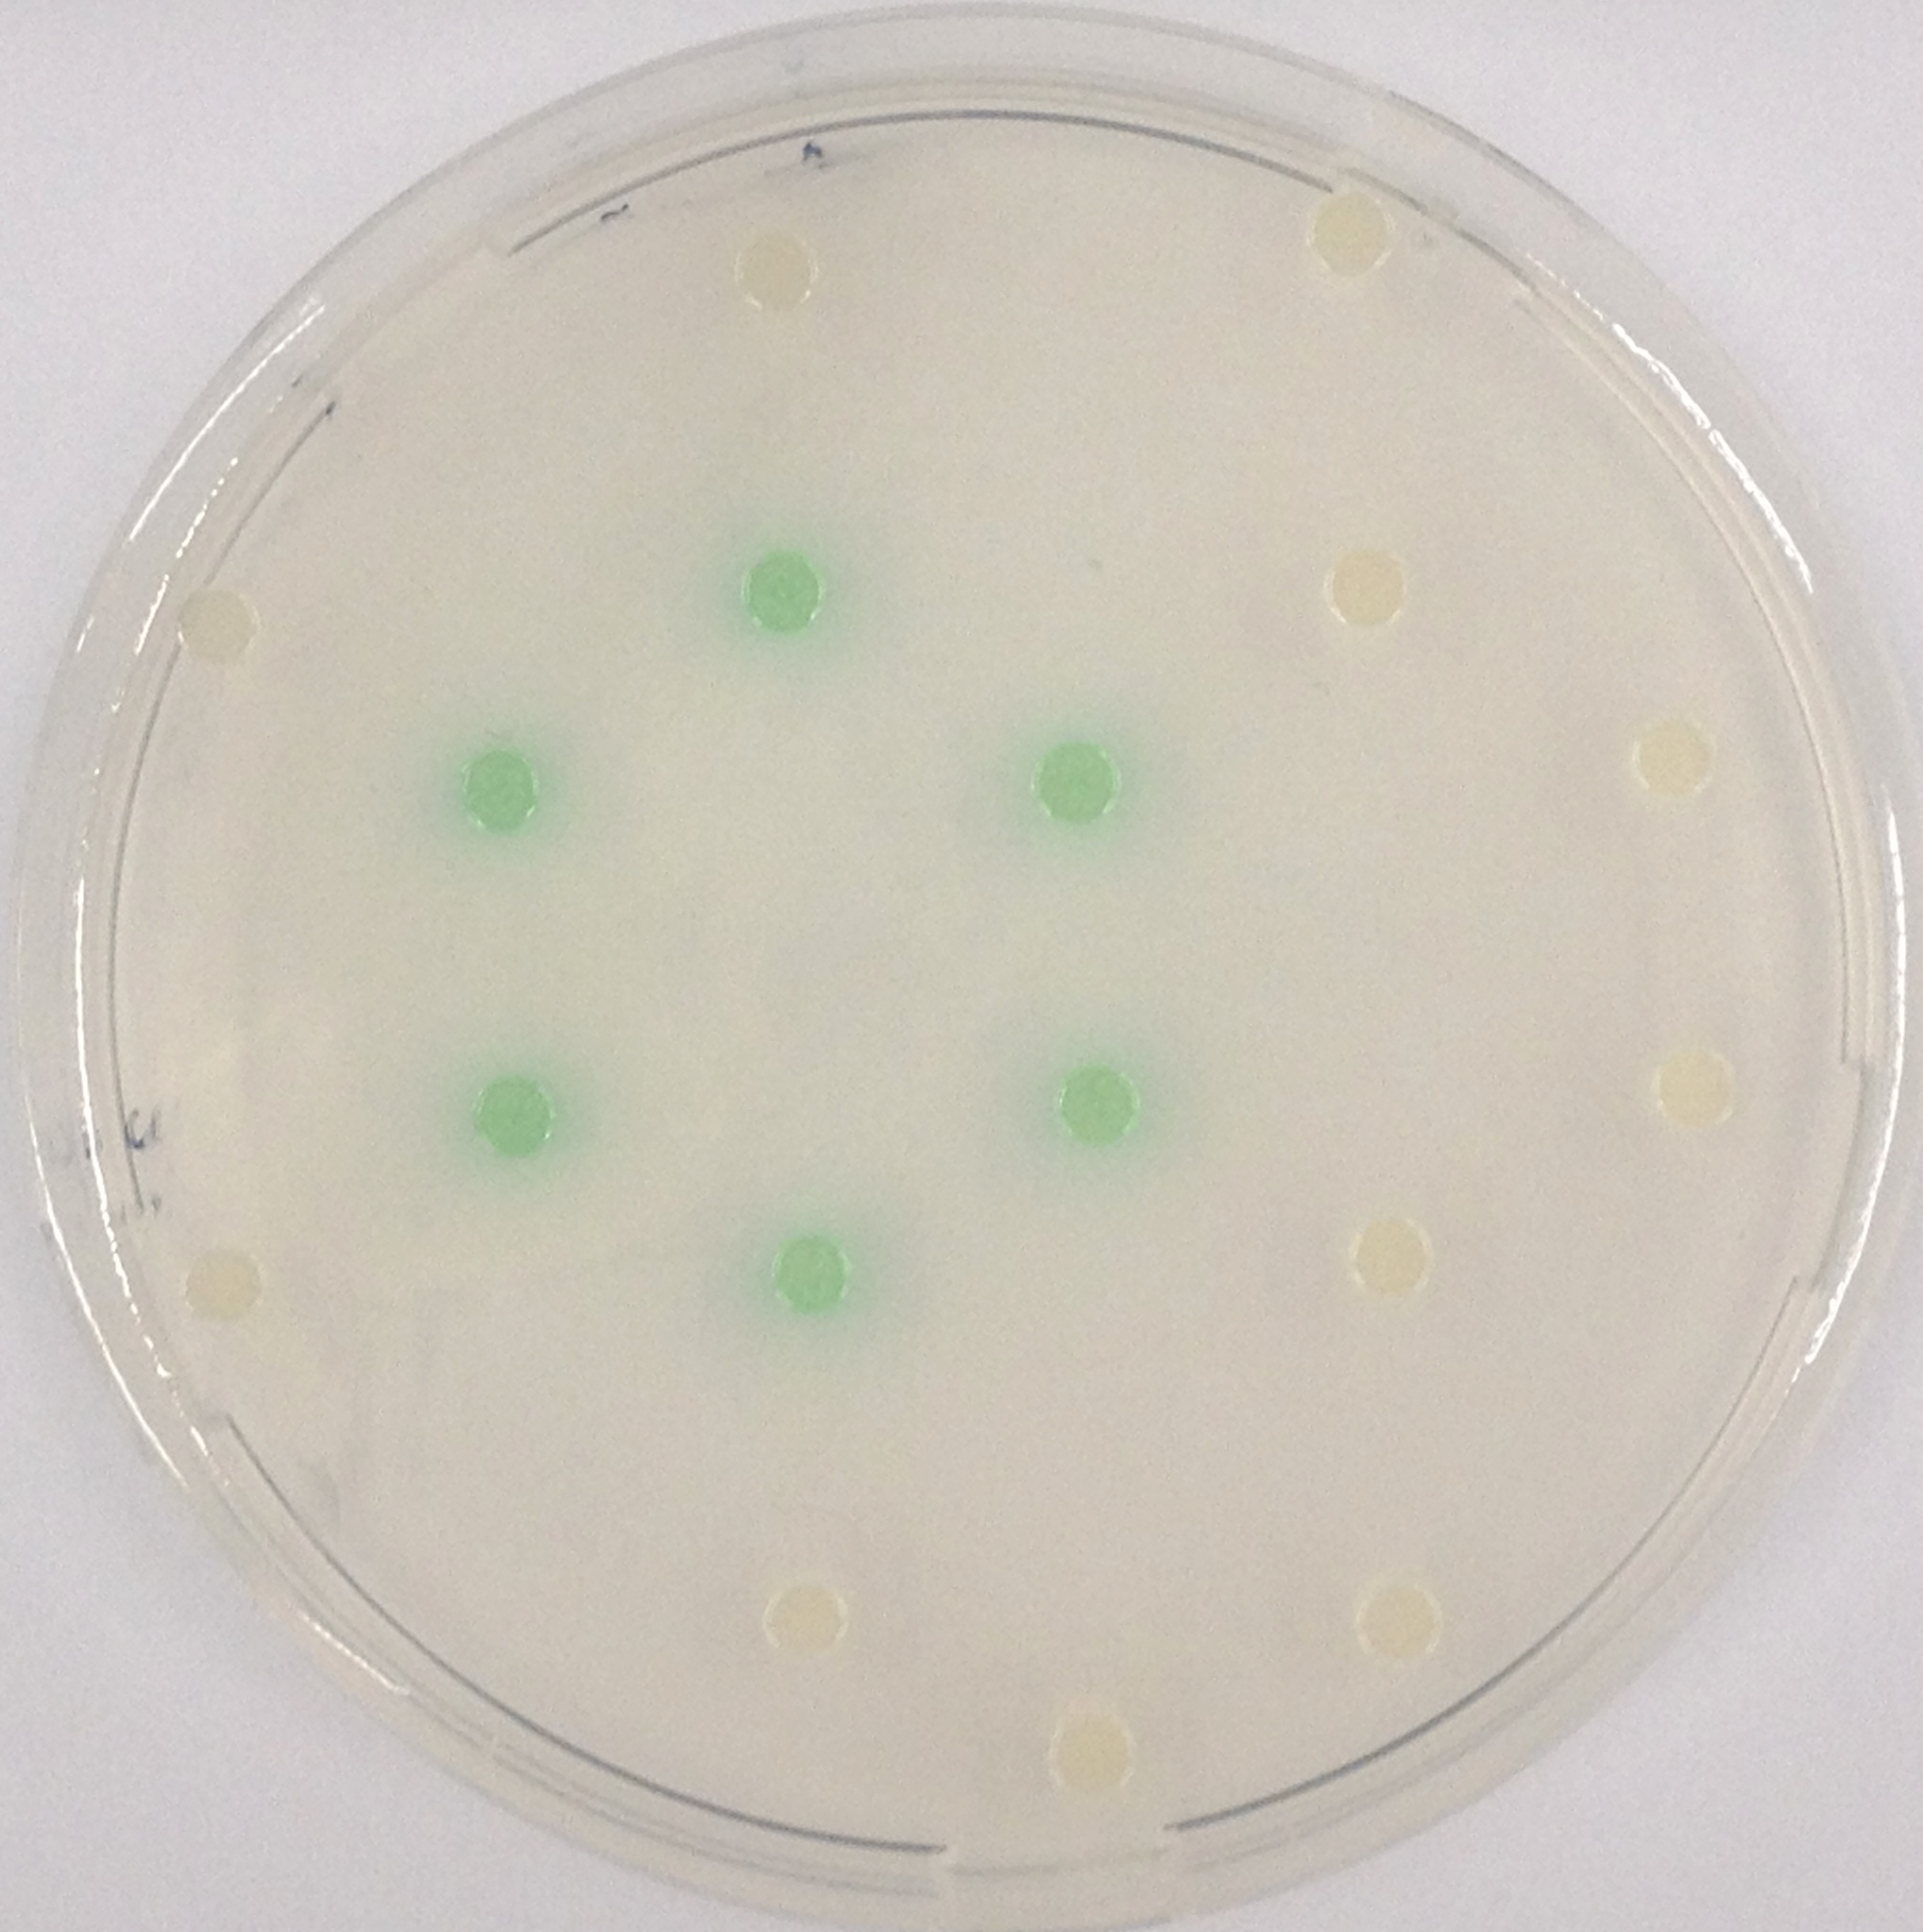
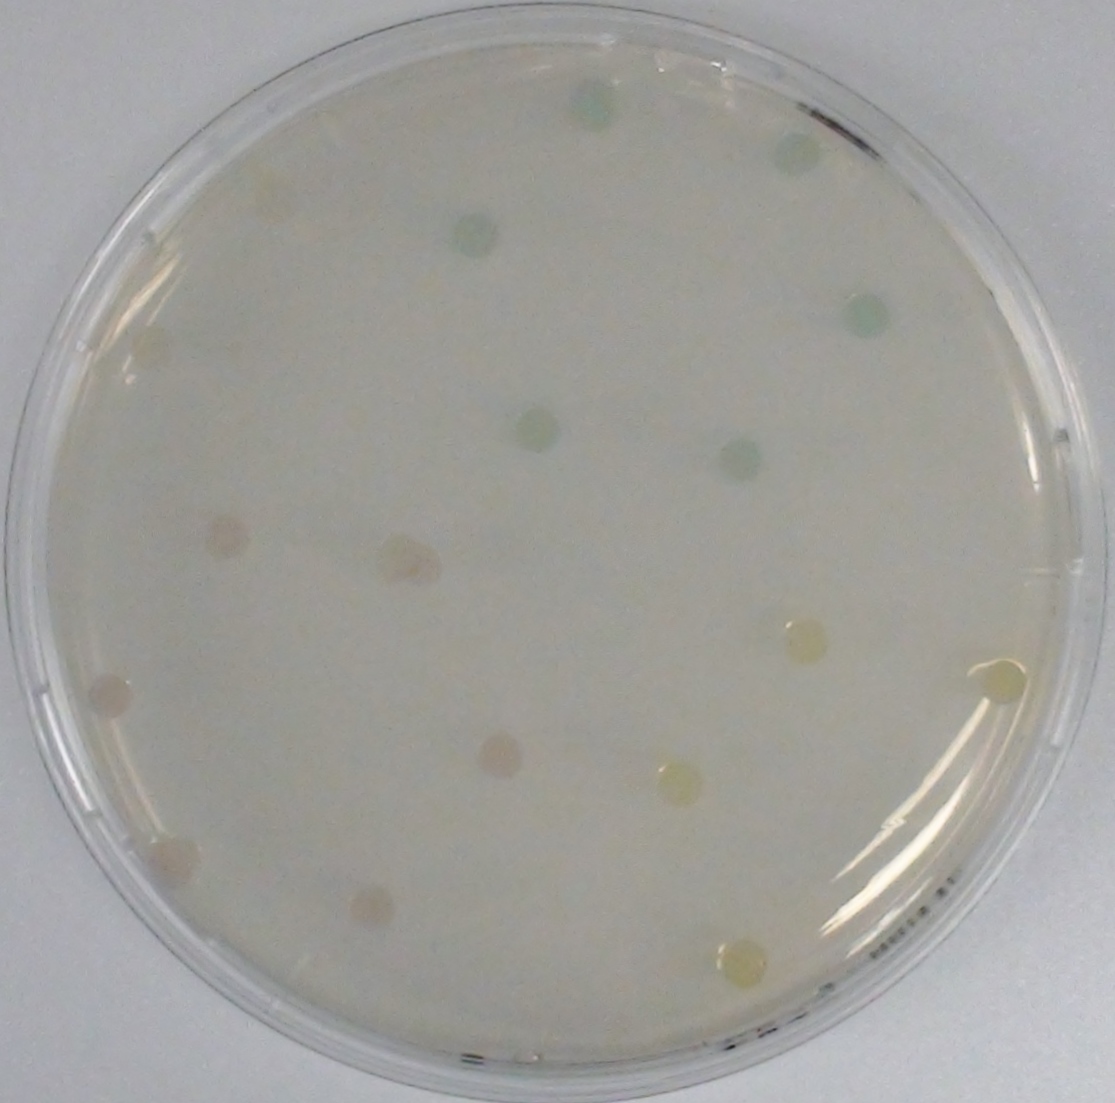
To assess color development after reaction of the enzyme with the chromogenic substrate, a liquid culture of our triple knockout Escherichia coli strain overexpressing Aes ([http://parts.igem.org/Part:BBa_K1216002 BBa_K1216002]) was grown until an OD600 of 0.4 - 0.6 was reached before addition of 5-Bromo-6-Chloro-3-indolyl butyrate (magenta butyrate, dissolved in acetone), a magenta color yielding substrate for Aes (Figure 6), to a final concentration of 100 µM (Figure 2). To study the color development in the actual Colisweeper game setup, colonies were plated by pipetting 1.5 µl of the triple knockout Escherichia coli liquid culture (OD600 of 0.4 - 0.6) on an M9 agar plate and incubated overnight. Addition of 1.5 µl of 20 mM magenta butyrate onto each colony results in color generation visible after two to three minutes at room temperature (Figure 3).
Unfortunately, substrate tests in our triple knockout strain without Aes overexpression have shown that when using the butyrate as a substrate, there is background activity observable, meaning that enzymes other than the Aes can catalyze hydrolysis of the butyrate substrate. Therefore, 5-Bromo-6-Chloro-3-indolyl caprylate (magenta caprylate) was chosen as an alternative substrate, which has shown to be more specifically cleaved by the Aes in our knockout strain. However, when using magenta caprylate as the substrate, color on colonies developed only after at least half an hour of incubation at 37°C, or overnight at room temperature (Figure 4).
Because the player of Colisweeper is not expected to incubate plates after each move, we made an assay comparing time differences of the color development in colonies of the triple knockout Escherichia coli strain overexpressing and not overexpressing Aes, using different concentrations of the substrates as well (Figure 5). Results have shown that with the butyrate substrate (20 mM in DMSO) and at room temperature (RT), colonies overexpressing Aes already developed color within the first few minutes, whereas colonies not overexpressing Aes did not show color until six hours after addition of the substrate. Even at twelve hours after adding the substrate, only a faint color was observed in the colonies not overexpressing Aes. Therefore, we continued using magenta butyrate for further tests and finally for the game, due to speed and intensity of color development compared to magenta caprylate.
Enzyme kinetics
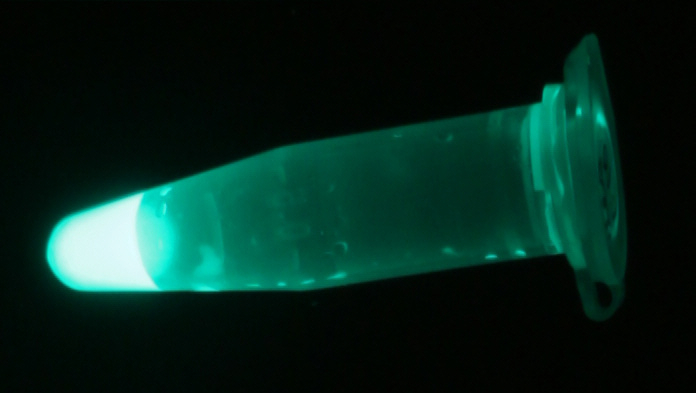
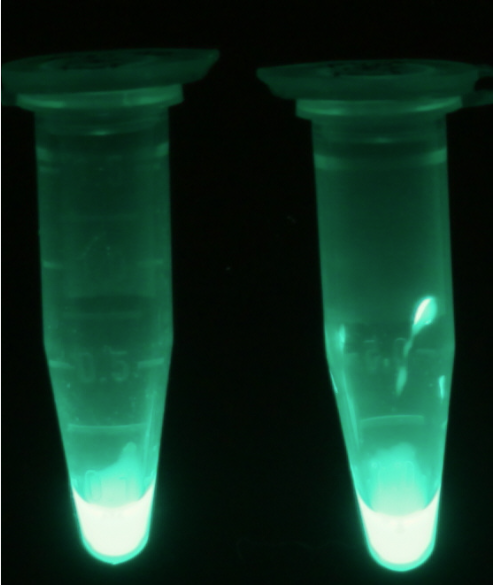
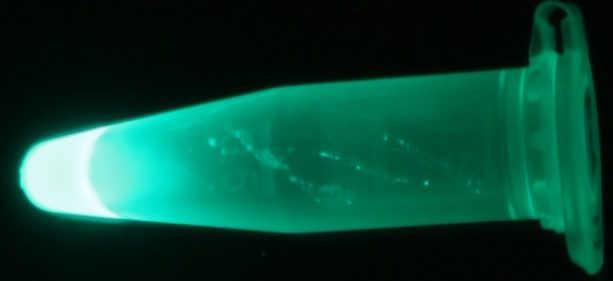
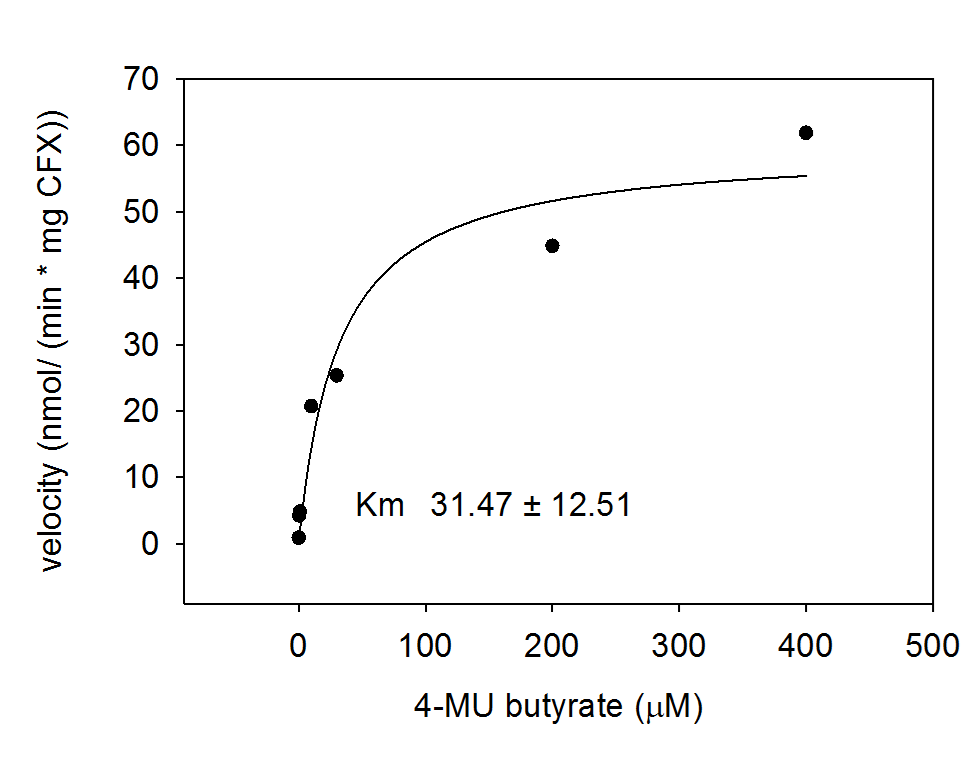
For the kinetics assay, the Escherichia coli lysate overexpressing Aes was tested with the substrate 4-MU-butyrate which after cleavage gives a fluorescent product. The picture on the right (Figure 7) was taken with a common single lens reflex camera mounted on a dark hood at λEx 365 nm.
To characterize the enzyme, we conducted Michaelis Menten kinetics to obtain the Km value. Escherichia coli cells were harvested and lysed, and the cell free extract (CFX) was then collected for the fluorometric assay. The properly diluted CFX was measured on a 96 well plate in triplicates per substrate concentration. The plate reader took measurements at λEx 365 nm and λEm 445 nm and determined a Km value of 31.5 ± 12.5 μM. The obtained data was then evaluated and fitted to Michaelis-Menten-Kinetics with SigmaPlot™:
Alkaline phosphatase (PhoA)
Chromogenic assay
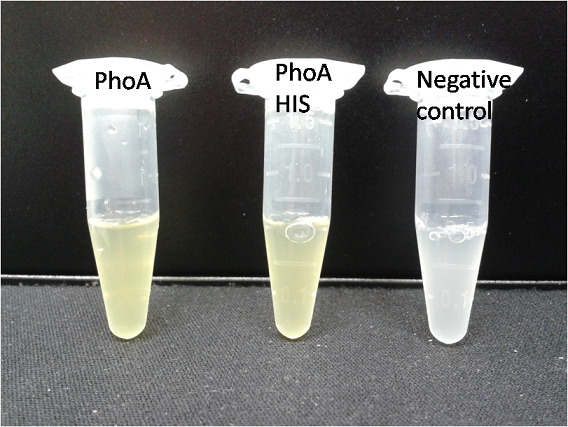
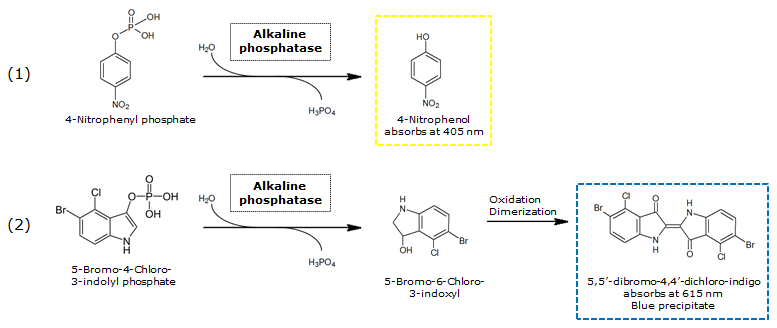
To test the functionality of PhoA ([http://parts.igem.org/Part:BBa_K1216001 BBa_K1216001]) and our improved biobrick PhoA-His ([http://parts.igem.org/Part:BBa_K1216001 BBa_K1216005]), a liquid culture of the triple knockout Escherichia coli strain overexpressing phoA or phoA-His was grown until an OD600 of 0.4 - 0.6 was reached before addition of p-nitrophenyl phosphate (pNPP, dissolved in DEA) to a final concentration of 5 mM. This substrate gives rise to yellow color after hydrolysis by PhoA (Figure 10). In the Colisweeper game, substrates are pipetted onto colonies. Figure 10 shows color development on colonies five minutes after addition of 1.5 µl of a 0.5 M pNPP solution. The phoA gene is not a knockout in our host strain, resulting in the expression of additional chromosomal PhoA in all our cells. In our setup this is no problem, because the yellow color will be overlayed by either blue (mine), salmon and violett (mines nearby) if the cell is not a safe cell.
However, problems with the blue color-yielding substrate for NagZ (expressed in mine colonies) have led to the idea to exchange the colors used for PhoA and NagZ. 5-Bromo-4-Chloro-3-indolyl phosphate (BCIP), which is commonly used for detection of alkaline phosphatases in biochemistry, would have been the blue color-producing alternative substrate for PhoA.
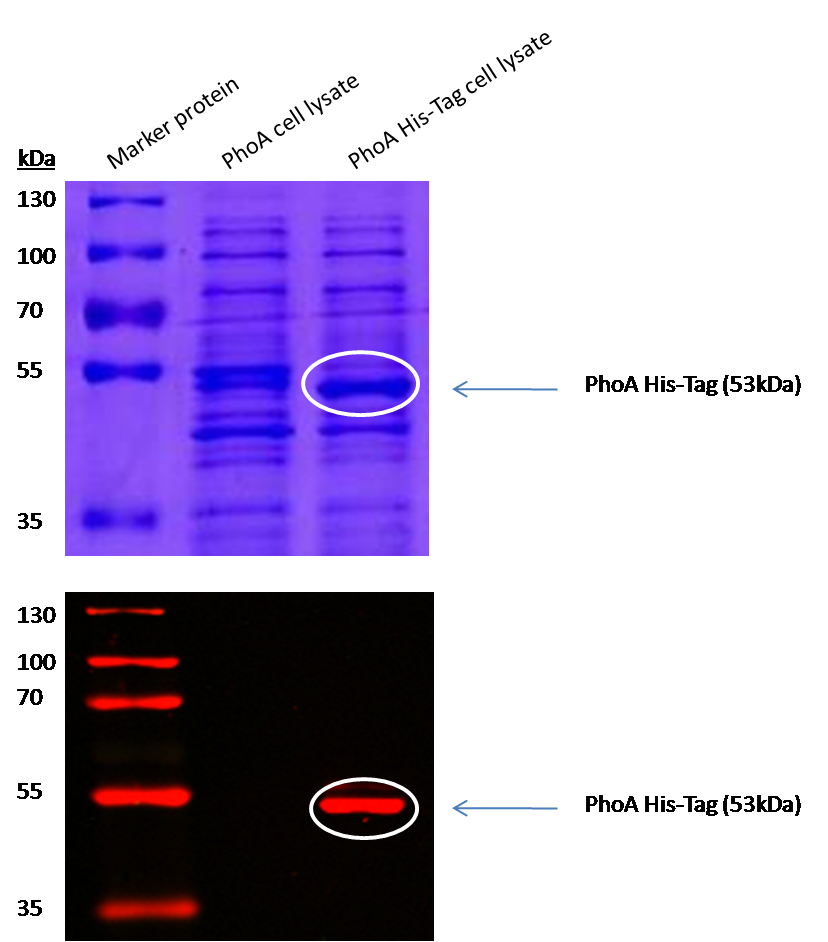
Characterization of PhoA-HIS tagged protein
We introduced a HIS tag to the PhoA enzyme. The HIS tag enables to purify the enzyme and therby e.g. making a full Michalis Menten studies which can give exact values for the model. Adding of a HIS tag can lead to an unfunctional enzyme, so we first tested the functionality of both PhoA and PhoA HIS tag (see Figure 10) with our chromogenic substrate. In a second step, we confirmed the presents of the HIS tag by Western Blot: The PhoA and PhoA with HIS-tag were overexpressed in the Escherichia coli BL21 DE3 strain, induced by 5 μM IPTG (iso-propy-β-D-1-thiogalactopyranoside) and finally harvested in order to obtain the cell lysate by lysozyme lysis. This cell lysate of both cultures were analyzed next to each other in two SDS-PAGE gels, one for comassie staining (blue gel in the picture) and one for western blotting (black picture) with Anti-6X His tag® antibody from mouse and a second reporter goat anti mouse antibody with a IRDye 680RD. In the picture we can distinguish the PhoA His (53 kDa) on the western blot as well as on the SDS-PAGE gel (see white circles).
Enzyme kinetics
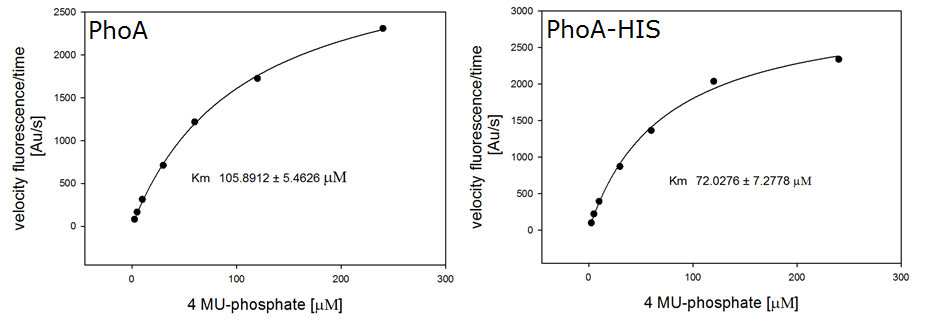
For the kinetics assay, we tested both the Citrobacter phoA and phoA-HIS encoded proteins with the fluorescent substrate 4-MU-phosphate. The image in Figure 16 was taken with a common single lens reflex camera mounted on a dark hood at λEx 365 nm.
To characterize the enzymes, we conducted fluorometric assays to obtain Km values. Escherichia coli were harvested and lysed, and the cell free extract (CFX) was then collected for the fluorometric assay. The properly diluted CFX was measured on a 96 well plate in triplicates per substrate concentration. The plate reader took measurements at λEx 365 nm and λEm 445 nm, determining a Km values of 105.9 ± 5.3 μM for PhoA and 72.0 ± 7.3 μM for Pho-HIS.
The obtained data was evaluated and finally fitted to Michaelis-Menten-Kinetics with SigmaPlot™:
β-Galactosidase (LacZ)
Chromogenic assay
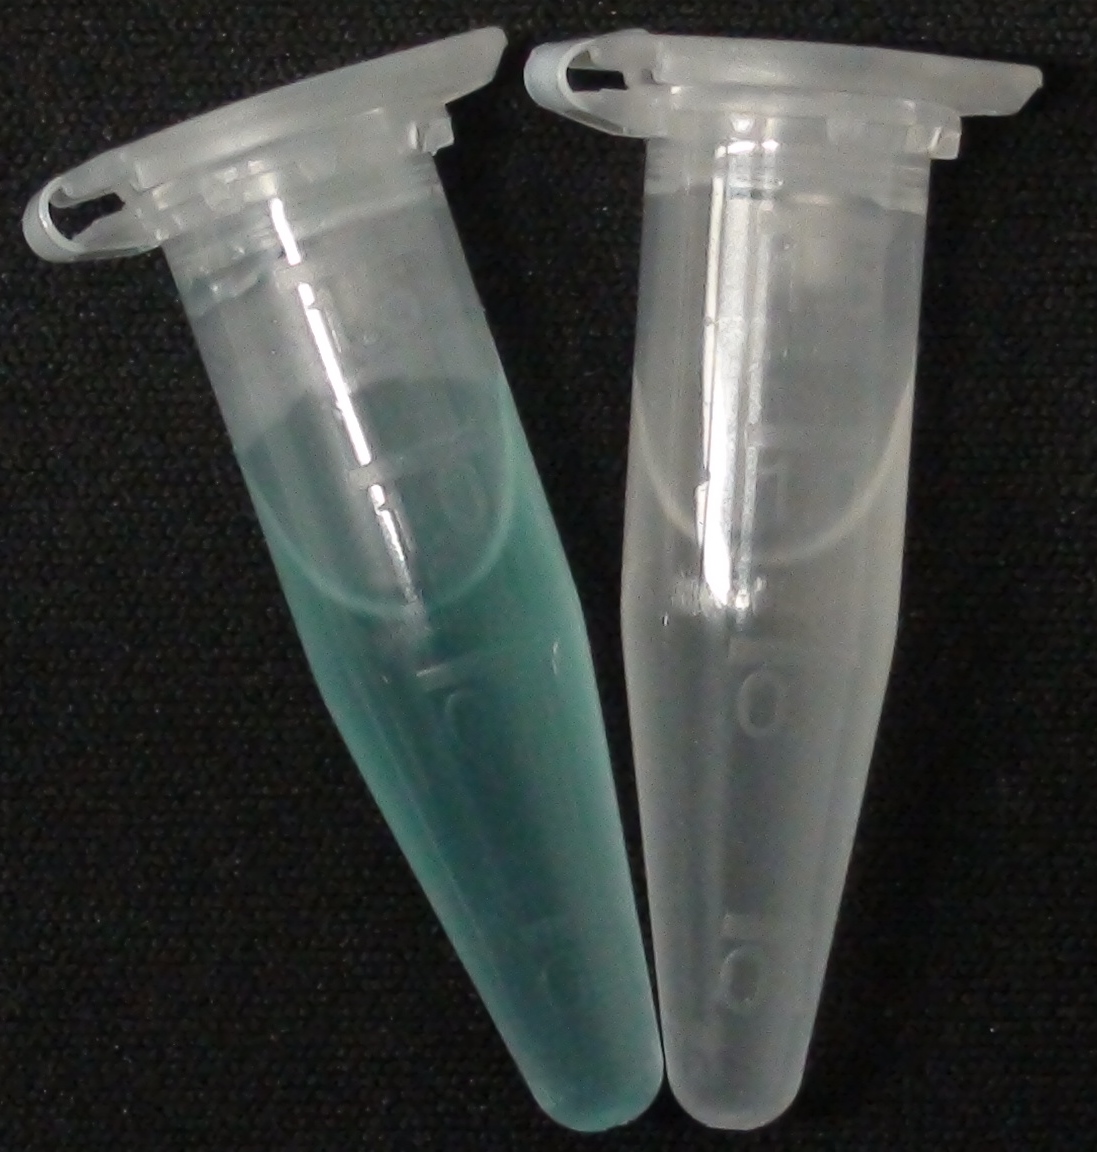
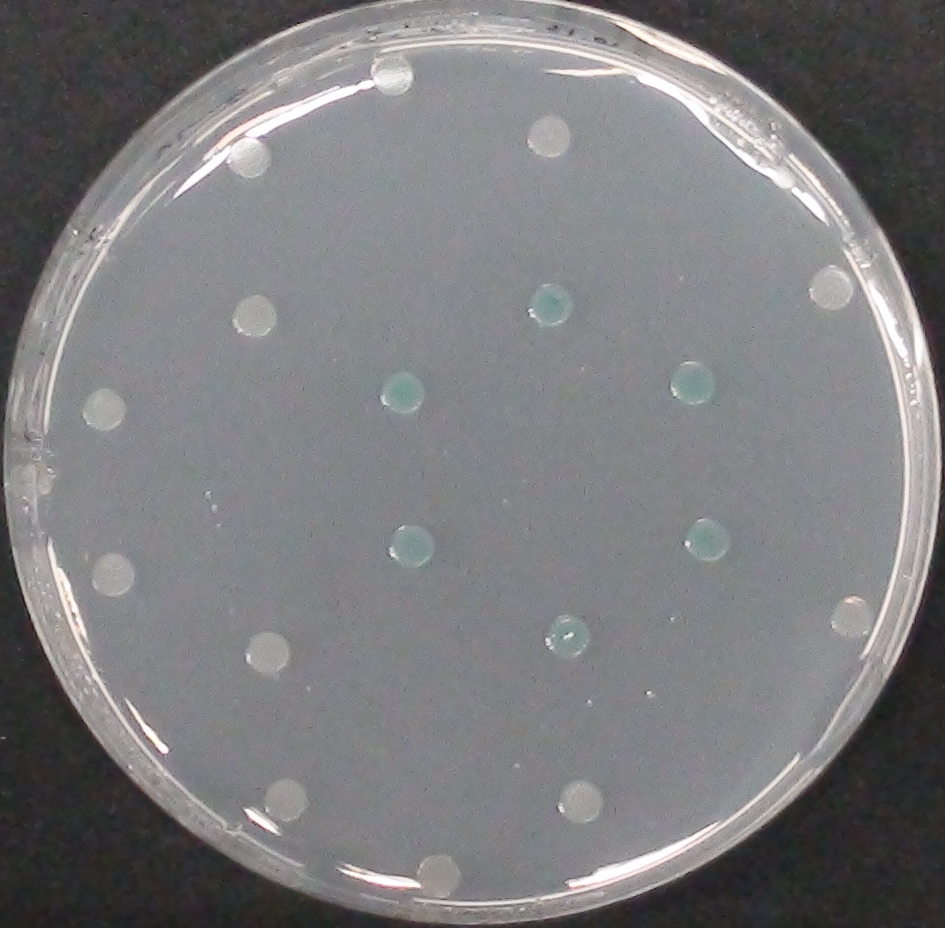
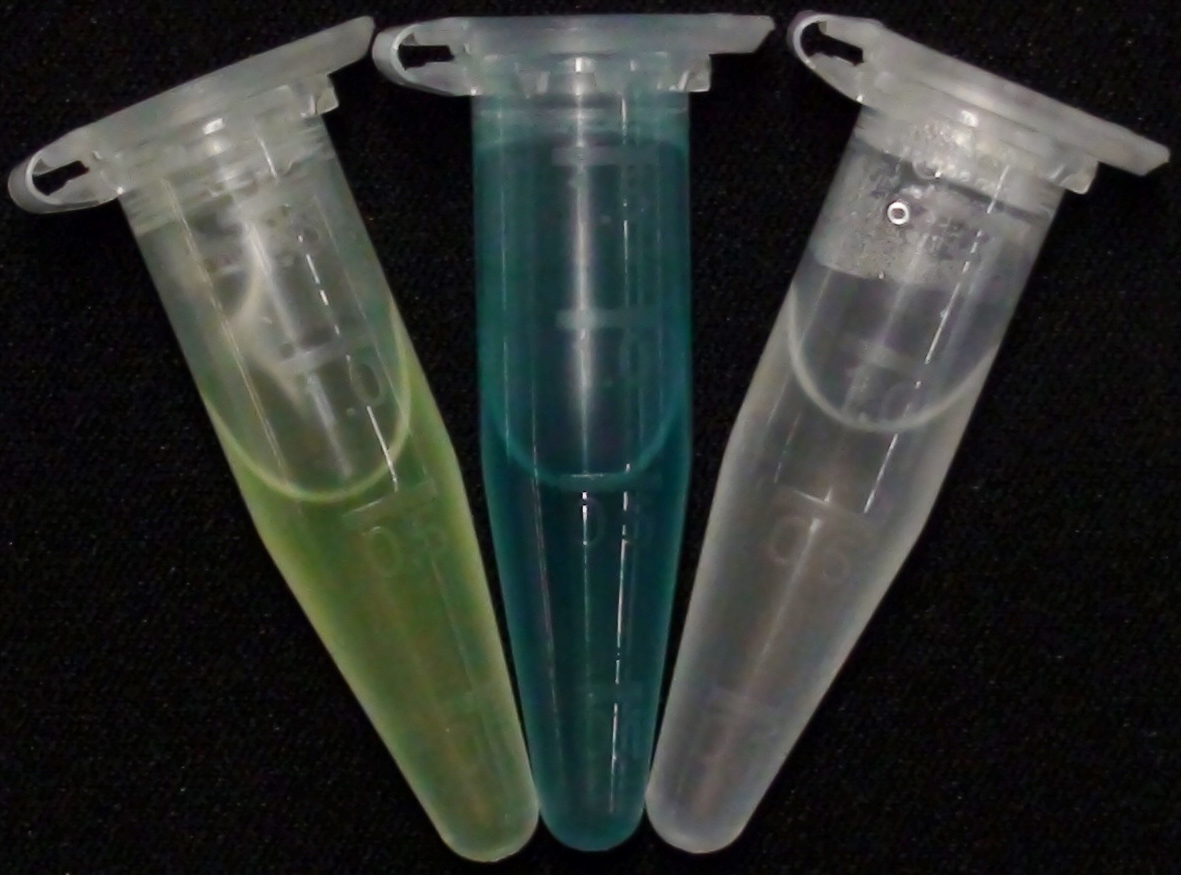
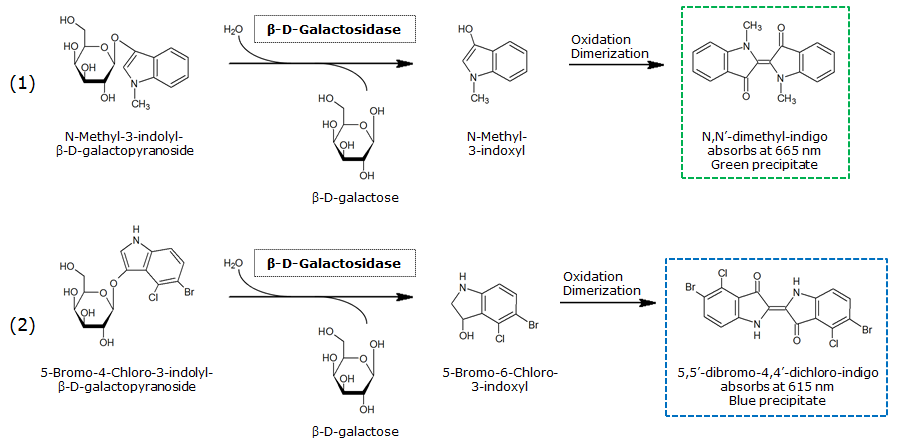
The β-Galactosidase is natively expressed in the triple knockout Escherichia coli strain used in Colisweeper. Its commonly used chromogenic substrate is 5-Bromo-4-Chloro-3-indolyl-β-D-Galactopyranoside (X-Gal), which yields a blue-colored precipitate (Figure 19, middle). In Colisweeper, this protein catalyzes hydrolysis of the flagging substrate, which is N-Methyl-3-indolyl-β-D-Galactopyranoside (Green-β-D-Gal) and produces a green color upon cleavage of the chromophore (Figure 19, left tube). For the color assay in liquid culuture, we used Escherichia coli cultures grown to an OD600 of 0.4 - 0.6, then added the substrates to a final concentration of 1 mM. On colonies, drops of 50 mM were applied, and development of color showed approximately 10 - 15 minutes after addition of the substrates.
β-Glucuronidase (GusA)
Chromogenic assay
In the Colisweeper game, GusA is expressed in colonies which are surrounded by one mine. To characterize the reaction of GusA with its substrate, a liquid culture of the triple knockout Escherichia coli strain overexpressing GusA ([http://parts.igem.org/Part:BBa_K1216000 BBa_K1216000]) was grown until an OD600 of 0.4 - 0.6 was reached before addition of 6-Chloro-3-indolyl-β-glucuronide (Salmon-Gluc), a substrate for GusA which produces a rose/salmon color after cleavage (Figure 22). The final concentration of the substrate in liquid culture was 1 mM and the conversion of this substrate was done by incubation at 37°C. On colonies, 1.5 μl drops of the diluted substrate solution were added, resulting in production of salmon color after approximately 5 minutes at RT.
Enzyme kinetics
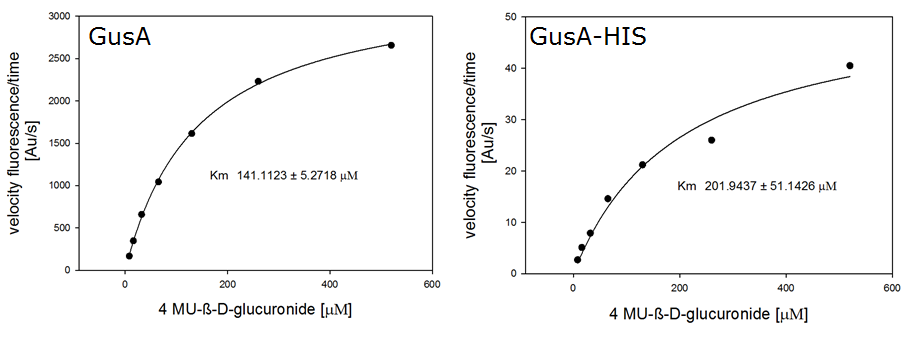
For the kinetics assay, we tested both gusA and gusA-HIS encoded proteins with the fluorescent substrate 4-MU-β-D-Glucuronide. The picture on the right (Figure 25) was taken with a common single lens reflex camera mounted on a dark hood at λEx 365 nm.
For the enzyme kinetics of GusA, we conducted fluorometric assays to obtain the Km value. Escherichia coli overexpressing GusA were harvested and lysed, and the cell free extract (CFX) was then collected for the fluorometric assay. The properly diluted CFX was measured on a 96 well plate in triplicates per substrate concentration. A plate reader took measurements at λEx 365 nm and λEm 445 nm, and determined a Km value of 141.1 ± 5.3 μM for GusA, and 201.9 ± 51.1 μM for GusA-HIS. The obtained data was evaluated and finally fitted to Michaelis-Menten-Kinetics with SigmaPlot™:
β-N-Acetylglucosaminidase (NagZ)
Chromogenic assay
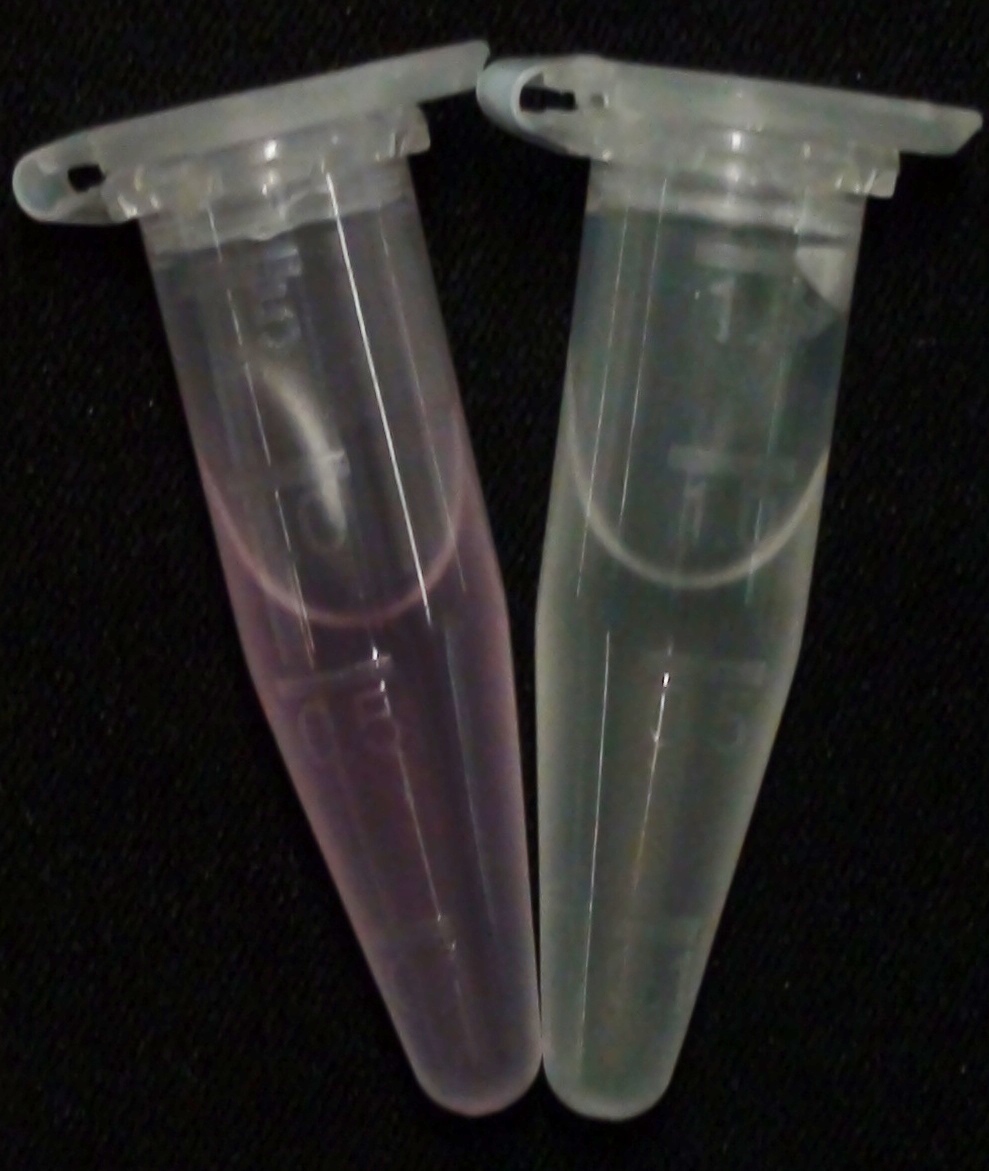
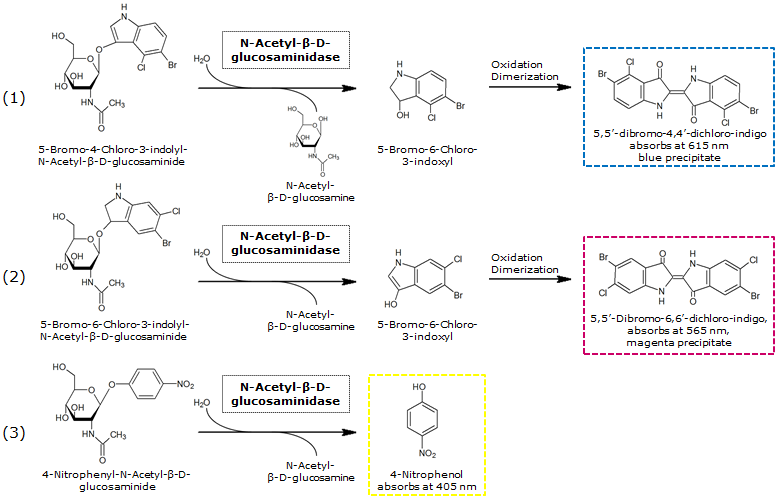
NagZ ([http://parts.igem.org/Part:BBa_K1216003 BBa_K1216003]) was proposed to be constitutively expressed in the mine colonies, processing its blue color-yielding substrate 5-Bromo-4-Chloro-3-indolyl-β-N-acetylglucosaminide (X-GluNAc). However, we could not initially manage to get color from the reaction with this enzyme-substrate pair. Using p-nitrophenyl-β-N-acetylglucosaminide (pNP-GluNAc) at an end concentration of 0.01 mM in an Escherichia coli liquid culture with an OD600 of 0.4 - 0.6, development of yellow color could be observed (Figure 28), confirming that NagZ is expressed in our mine cells.
According to Orenga et al. (1), the substrate incorporating the indoxyl chromophore is less preferentially hydrolyzed by bacterial NagZ in comparison to yeast NagZ, and more preferentially hydrolyzes the alizarine-based substrate they applied. To increase hydrolysis of the indoxyl-based substrate, we added the substrate to a liquid culture supplemented with BSA for stabilization of the enzyme (2), which enhanced hydrolysis by NagZ dramatically. The end concentration in liquid culture of both X-GluNAc and 5-Bromo-6-Chloro-3-indolyl-β-N-acetylglucosaminide (Magenta-GluNAc), a magenta color-yielding substrate for NagZ, were at 1 mM (Figure 28).
Crosstalk
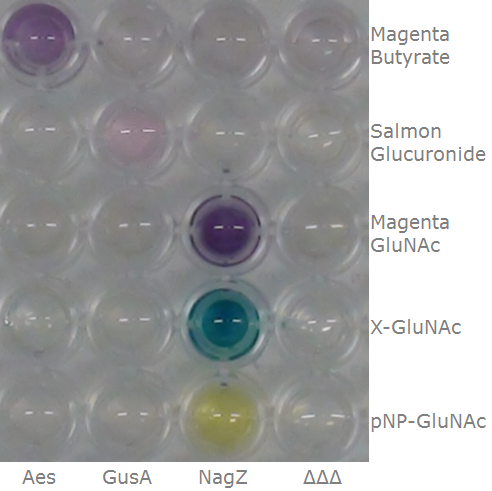
To ensure specificity of the enzyme-substrate pairs used in Colisweeper, a crosstalk test was done to make sure that all overexpressed enzymes specifically cleave their assigned substrate.
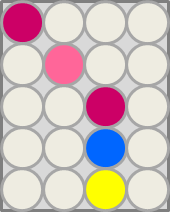
This crosstalk test was done in a 96-well plate, each well containing 200 μl from liquid cultures of our ΔaesΔgusAΔnagZ Escherichia coli strain overexpressing either Aes, GusA, NagZ or none, each distributed among the column-wells of the plate. Horizontally, the chromogenic substrates were pipetted to the liquid cultures in the same order as their corresponding hydrolase: magenta-butyrate for Aes, Salmon-Gluc for GusA, and magenta-, X- and pNP-GluNAc for NagZ. If specificity of the chosen enzyme-substrates pairs were given, we would expect an output as shown in the figure below (Figure 32). As Figure 31 shows, the overexpressed hydrolases cleave only the substrates they were expected to.
Color overlay
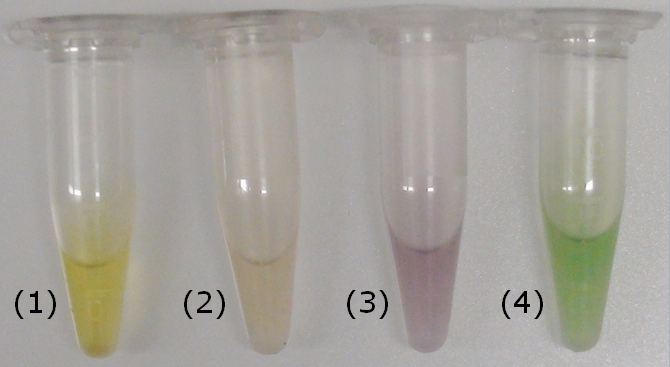
To play Colisweeper, colors for each colony identity have to be clearly distinguishable by eye. Because we are using high-pass filters to differentially process certain AHL levels, we had to make sure that a mix of cleaved product would show distinguishable colors.
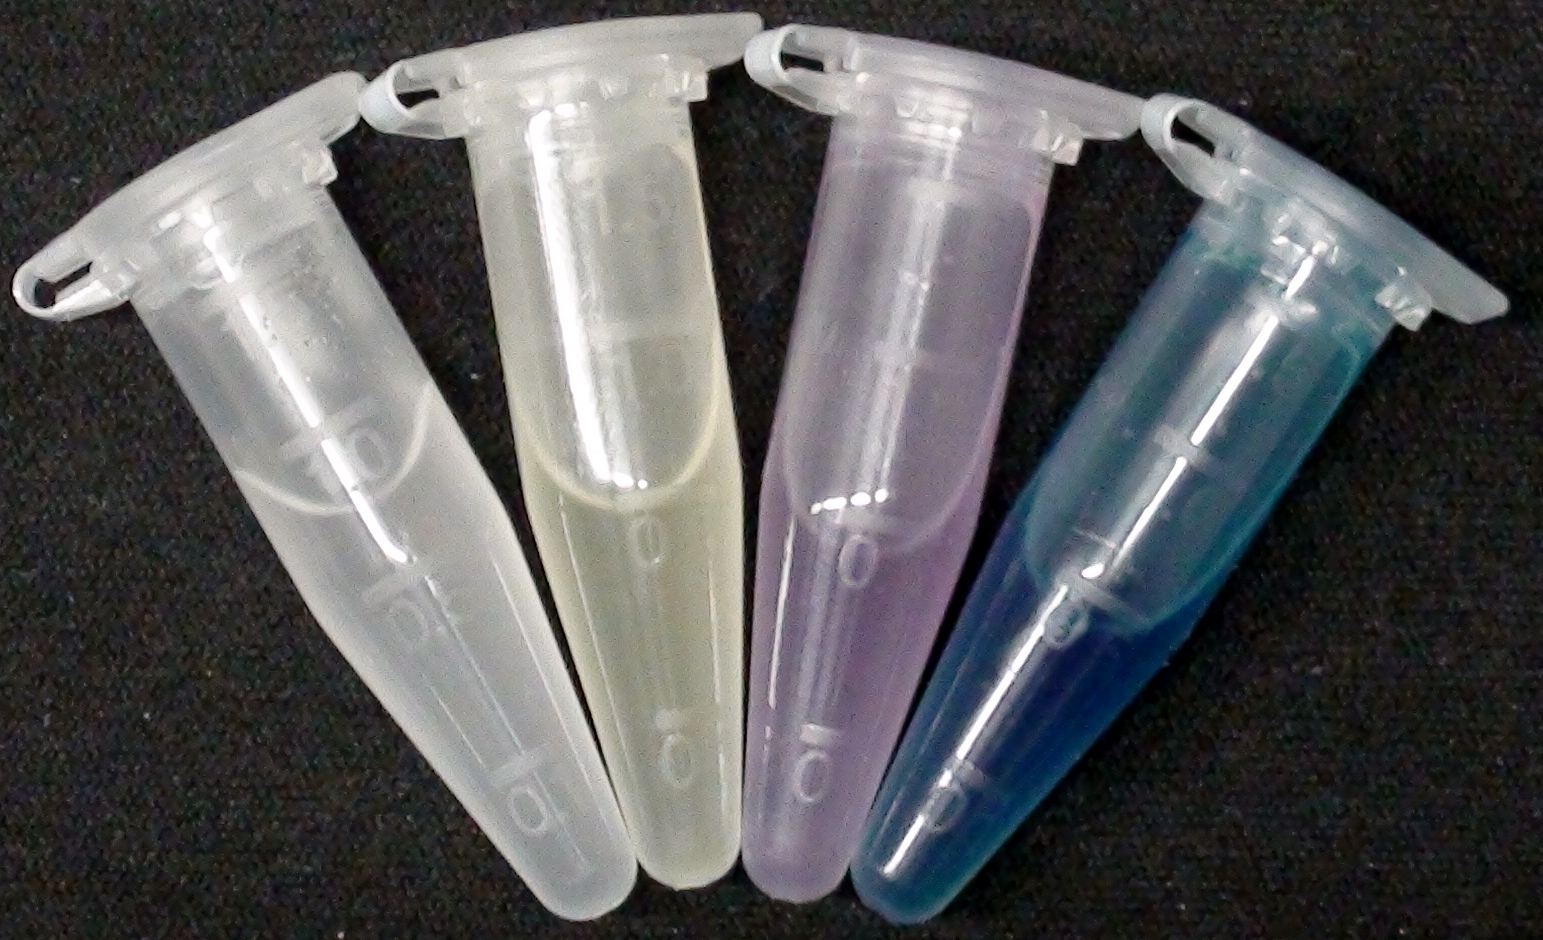
For this purpose, we mixed liquid cultures of our ΔaesΔgusAΔnagZ triple knockout strain which overexpress PhoA, GusA, Aes or NagZ, and added the corresponding substrates to the cultures. Figure 33 shows the resulting colors after hydrolysis of the substrates: PhoA with pNPP in (1), PhoA with pNPP and GusA with Salmon-Gluc in (2), PhoA with pNPP, GusA with Salmon-Gluc and Aes with Magenta butyrate in (3), and PhoA with pNPP and NagZ with X-GluNAc in (4). These colors are clearly distinguishable from one another and therefore can be used together as reporters of a system incorporating high-pass filters.
References
(1) Orenga S, Roger-Dalbert C, James A, Perry J, US Patent 20090017481 (2009).
(2) Magnelli PE, Bielik A, Guthrie E, Methods Mol. Biol., 801, 189-211 (2011).
Absorption: Biosynth
 "
"

