Team:ETH Zurich/Modeling
From 2013.igem.org
| (45 intermediate revisions not shown) | |||
| Line 4: | Line 4: | ||
<h1>Circuit containing hydrolases</h1> | <h1>Circuit containing hydrolases</h1> | ||
| - | <p align="justify"><b>A | + | <p align="justify"><b>A six-species model was implemented to simulate the behaviour of our multicellular sender–receiver system. The model consist of one partial differential equation for AHL and 5 ordinary differential equations with Hill functions that captured the activation of protein synthesis as a function of the concentration of the signalling molecule. </b></p> |
<p align="center"><b>Video:</b> GusA expression levels over 24 hours, concentration in mol/m<sup>3</sup>. Distance between colonies: 1.5 cm.</p> | <p align="center"><b>Video:</b> GusA expression levels over 24 hours, concentration in mol/m<sup>3</sup>. Distance between colonies: 1.5 cm.</p> | ||
| Line 11: | Line 11: | ||
id=video5| | id=video5| | ||
ratio=257/200| | ratio=257/200| | ||
| - | srcMP4=<html>https://static.igem.org/mediawiki/2013/f/fc/GusA.mp4</html>}} | + | srcMP4=<html>https://static.igem.org/mediawiki/2013/f/fc/GusA.mp4</html> |
| + | |poster=<html>https://static.igem.org/mediawiki/2013/d/d9/GusA289.png</html>}} | ||
<br> | <br> | ||
<p align="justify"> For the agar plate and mine cells modules, we use the system of equations and parameters set of the previous [https://2013.igem.org/Team:ETH_Zurich/GFP ''simulation'']. </p> | <p align="justify"> For the agar plate and mine cells modules, we use the system of equations and parameters set of the previous [https://2013.igem.org/Team:ETH_Zurich/GFP ''simulation'']. </p> | ||
<h1>Mine Cells</h1> | <h1>Mine Cells</h1> | ||
| - | <p align="justify">The | + | <p align="justify"> Two proteins are produced by mine cells: (i) LuxI and (ii) [https://2013.igem.org/Team:ETH_Zurich/Experiments_7 NagZ]. NagZ is the hydrolase responsible to reveal the mine identity, this gene is constitutively expressed and the protein is linearly degraded. The system of differential equations for the states involved in the sender module were given before ([https://2013.igem.org/Team:ETH_Zurich/GFP#MineColony view]), with exception of NagZ: </p><br> |
| + | \begin{align} | ||
| + | \frac{d[NagZ]}{dt} = \alpha_{NagZ} - d_{NagZ} \cdot [NagZ]\\ | ||
| + | \end{align} | ||
<br clear="all"/> | <br clear="all"/> | ||
| - | |||
<h1>Agar Plate</h1> | <h1>Agar Plate</h1> | ||
| - | <p align="justify">The | + | <p align="justify"> The equation for AHL in agar plate was given before ([https://2013.igem.org/Team:ETH_Zurich/GFP#Plate view]). </p> |
| - | + | <br clear="all"/> | |
<h1>Receiver Cells</h1> | <h1>Receiver Cells</h1> | ||
| - | <p align="justify">Receivers are engineered to respond differently to two | + | <p align="justify">Receivers are engineered to respond differently to two AHL concentration levels. Basically, cells should be capable of produce a visible response and in a reasonable amount of time, because the player will need to discriminate between the presence of 0, 1 or 2 adjacent mines. To achieve this goal, we incorporate two enzymatic reporters acting as [https://2013.igem.org/Team:ETH_Zurich/Experiments_5 high-pass filters] ([https://2013.igem.org/Team:ETH_Zurich/Experiments_7 GusA] and [https://2013.igem.org/Team:ETH_Zurich/Experiments_7 AES]). The expression of these enzymes is under the control of P<sub>Lux</sub> promoters with different sensitivities, the wild type and a promoter mutant ([https://2013.igem.org/Team:ETH_Zurich/Experiments_5 G1 mutant]); The affinity constants for the promoters were obtained from our [https://2013.igem.org/Team:ETH_Zurich/Experiments_5 experimental data]. However, the affinity was determined with respect to AHL, thus we omit the complex formation and model production of the enzymes as function of AHL concentration. The assumption is not unrealistic because LuxR was constitutively produced and linearly degraded, which leads to a constant concentration. An additional important feature of these enzymes is that they can catalyze the hydrolysis of various chromogenic compounds to give rise to a relatively quick coloured response. </p> |
<br> | <br> | ||
| - | The intracellular species of interest in the receiver cells module include: LuxR, | + | The intracellular species of interest in the receiver cells module include: LuxR, AHL and the hydrolases (GusA and AES). |
| - | + | ||
| - | + | ||
| + | \begin{align} | ||
| + | \frac{d[LuxR]}{dt}=\alpha_{[LuxR]} - d_{LuxR} [LuxR] \\ | ||
| + | \end{align} | ||
| + | \begin{align} | ||
| + | \frac{d[AHL]}{dt}= C_{agar} \cdot D_{AHL} \nabla^{2} AHL - DF \cdot d_{AHL} \cdot [AHL] \\ | ||
| + | \end{align} | ||
| + | \begin{align} | ||
| + | \frac{d[GusA]}{dt}=\alpha_{GusA} \cdot k_{leaky} \cdot [LuxR]+ \frac{\alpha_{GusA}\left(\frac{[AHL]}{K_{R_1}}\right)^{n_1}}{1+\left(\frac{[AHL]}{K_{R_1}}\right)^{n_1}} - d_{GusA}\cdot [GusA]\\ | ||
| + | \end{align} | ||
| + | \begin{align} | ||
| + | \frac{d[AES]}{dt}=\alpha_{AES} \cdot k_{leaky} \cdot [LuxR] + \frac{\alpha_{AES}\left(\frac{[AHL]}{K_{R_2}}\right)^{n_2}}{1+\left(\frac{[AHL]}{K_{R_2}}\right)^{n_2}} - d_{AES}\cdot [AES]\\ | ||
| + | \end{align} | ||
<p align="justify"> In addition to new proteins incorporated to the circuit, it is important to emphasize that the grid was changed to a three neighbours setup.</p> | <p align="justify"> In addition to new proteins incorporated to the circuit, it is important to emphasize that the grid was changed to a three neighbours setup.</p> | ||
<br clear="all"/> | <br clear="all"/> | ||
| Line 38: | Line 51: | ||
<p align="justify"> | <p align="justify"> | ||
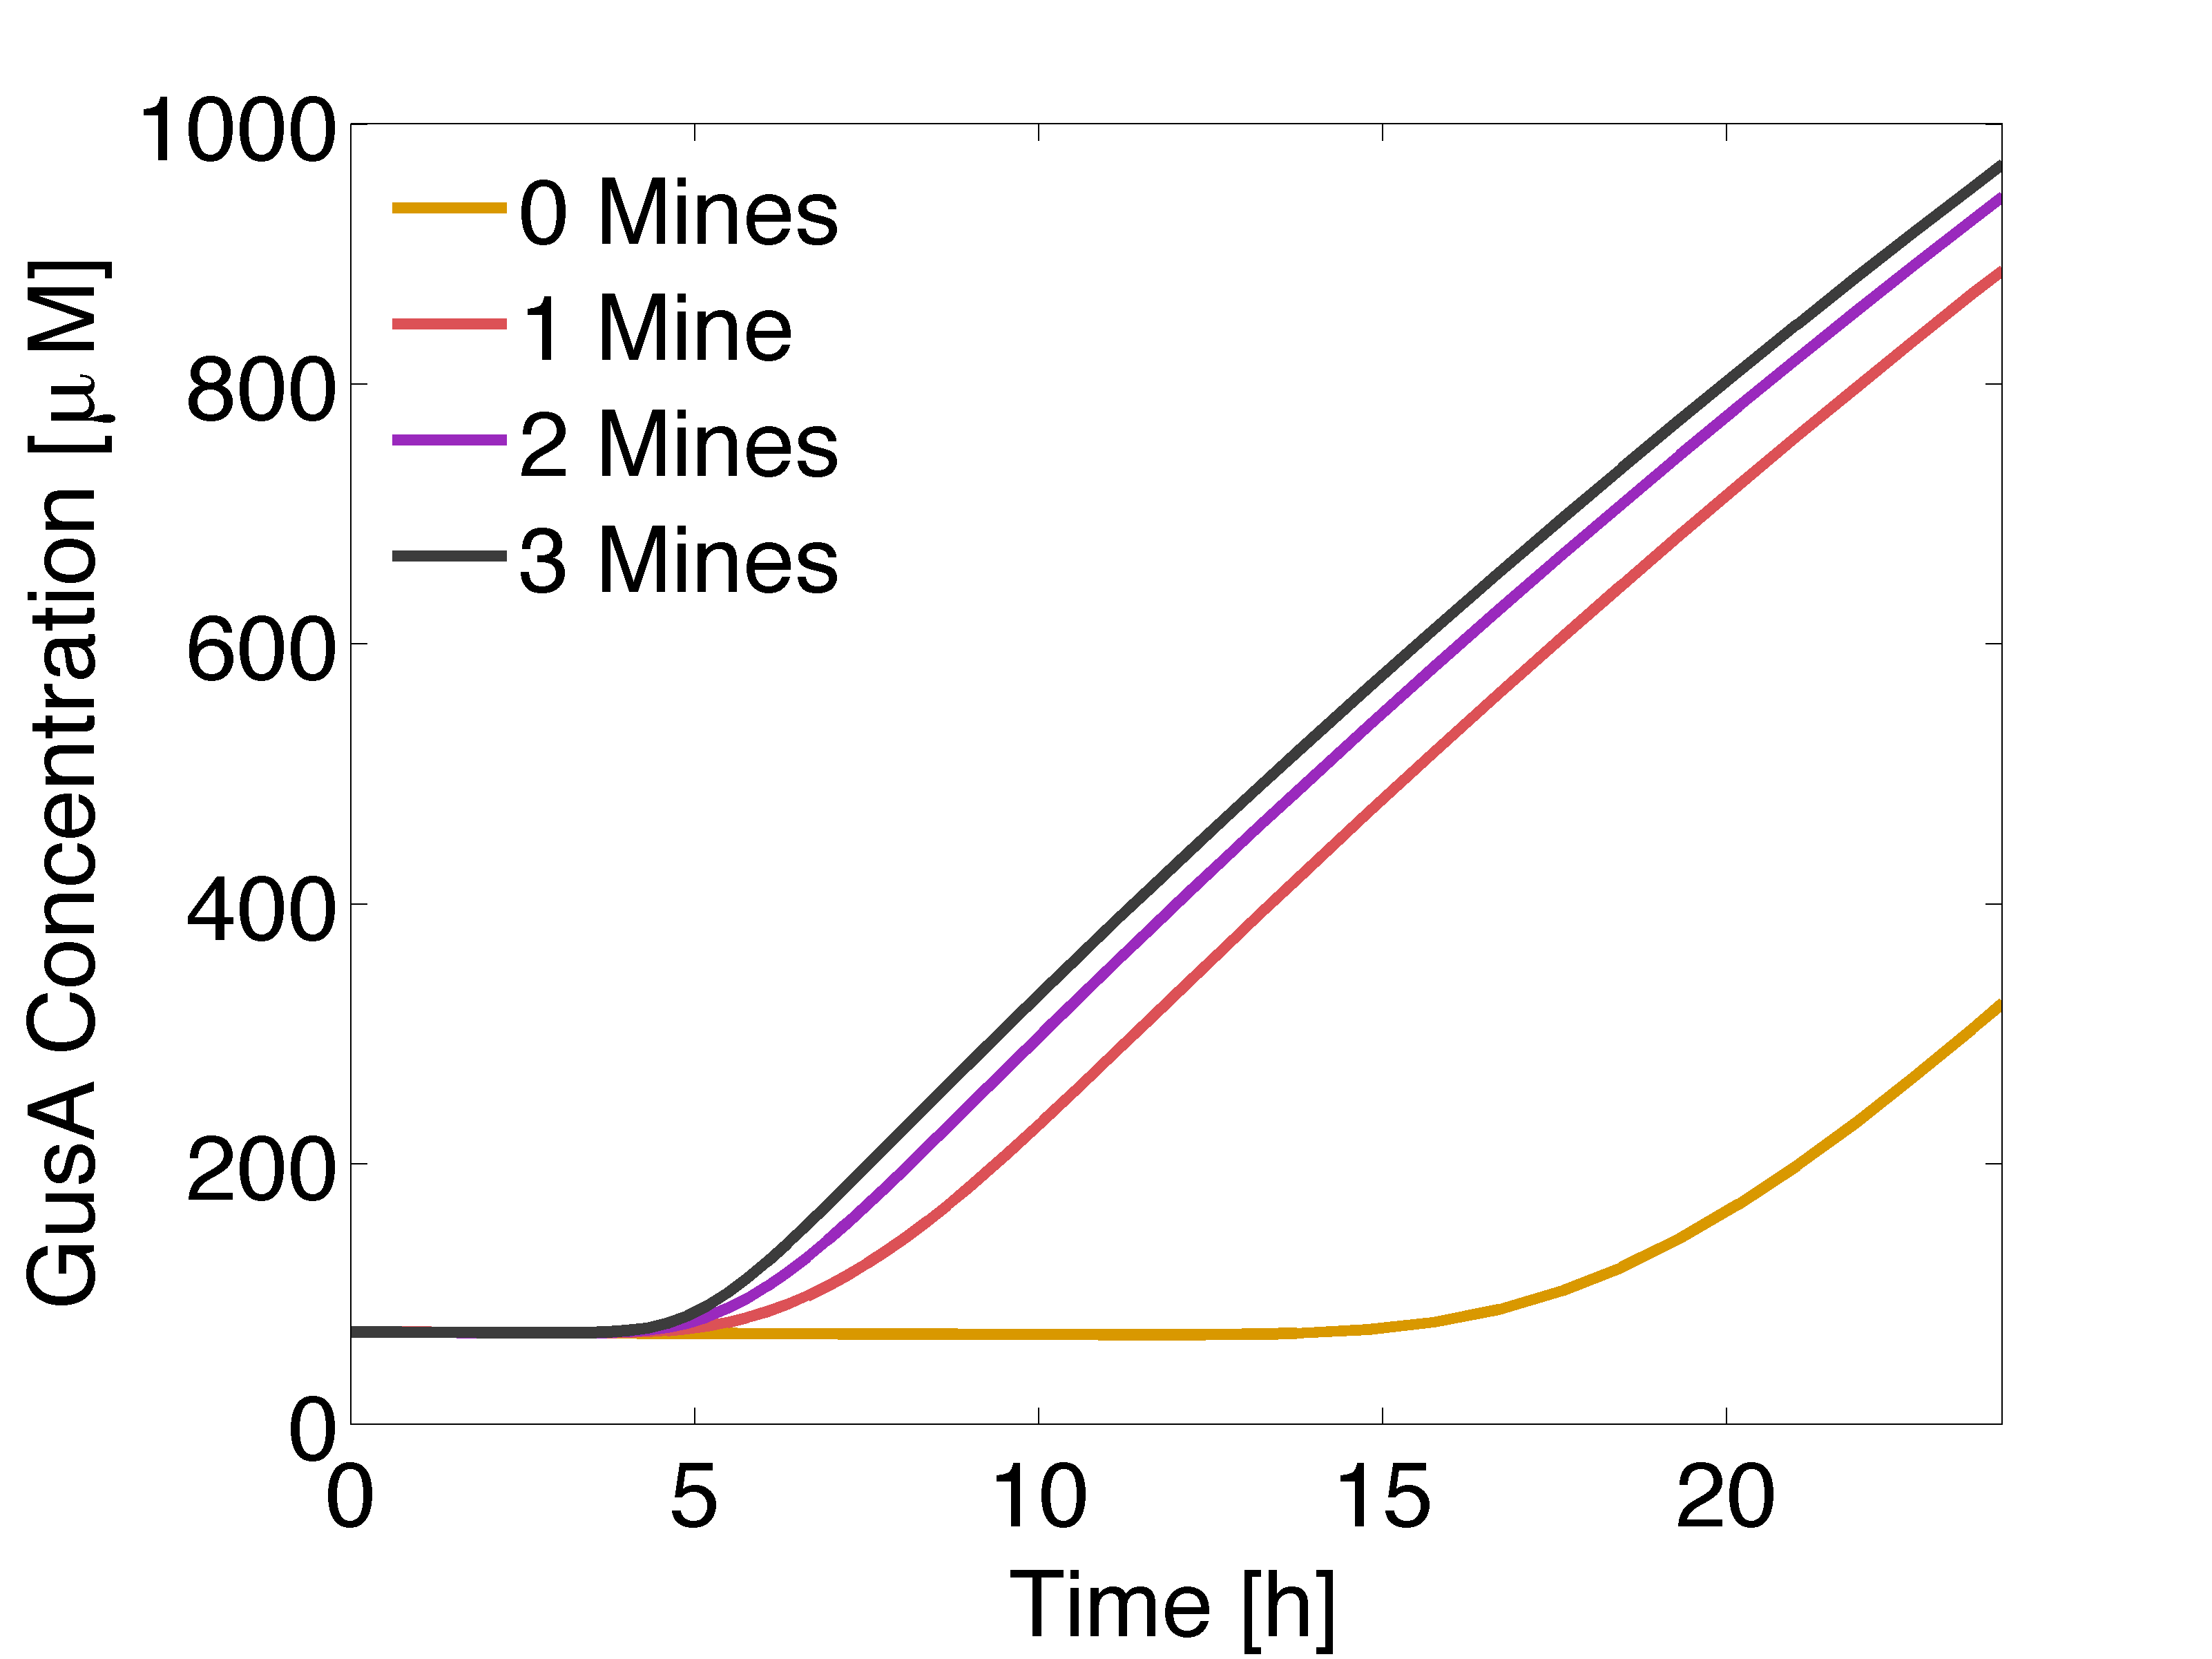
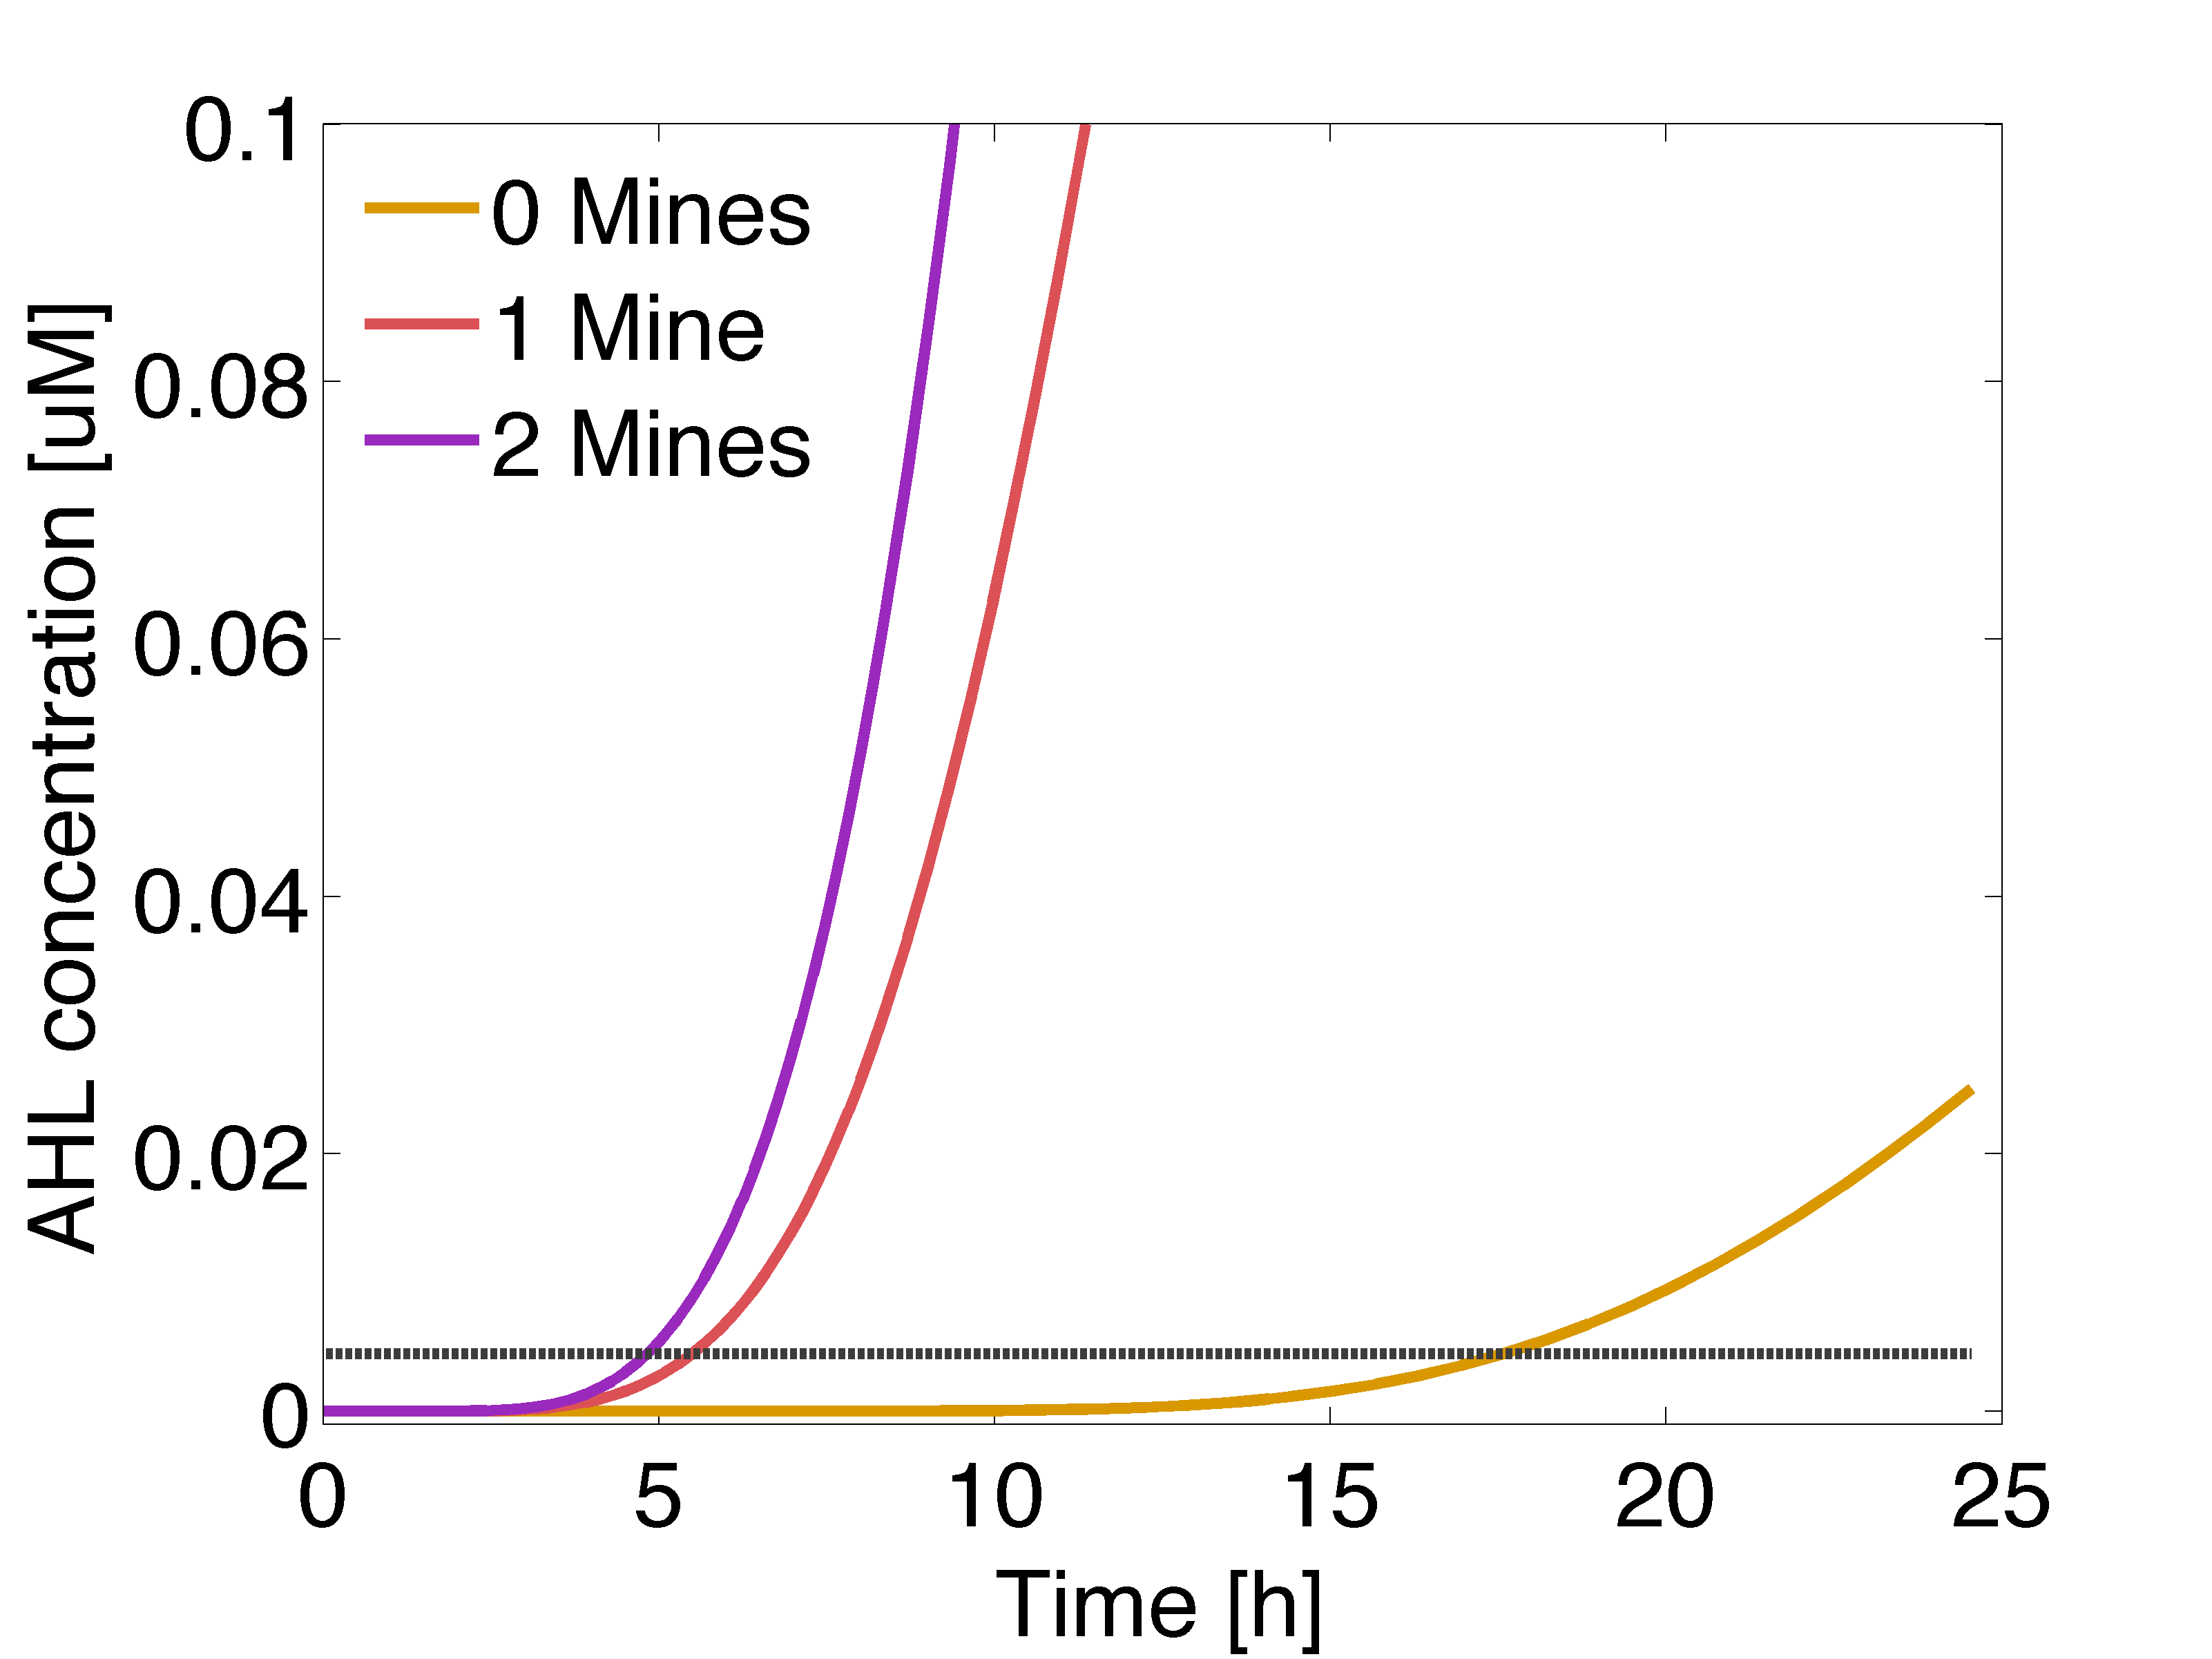
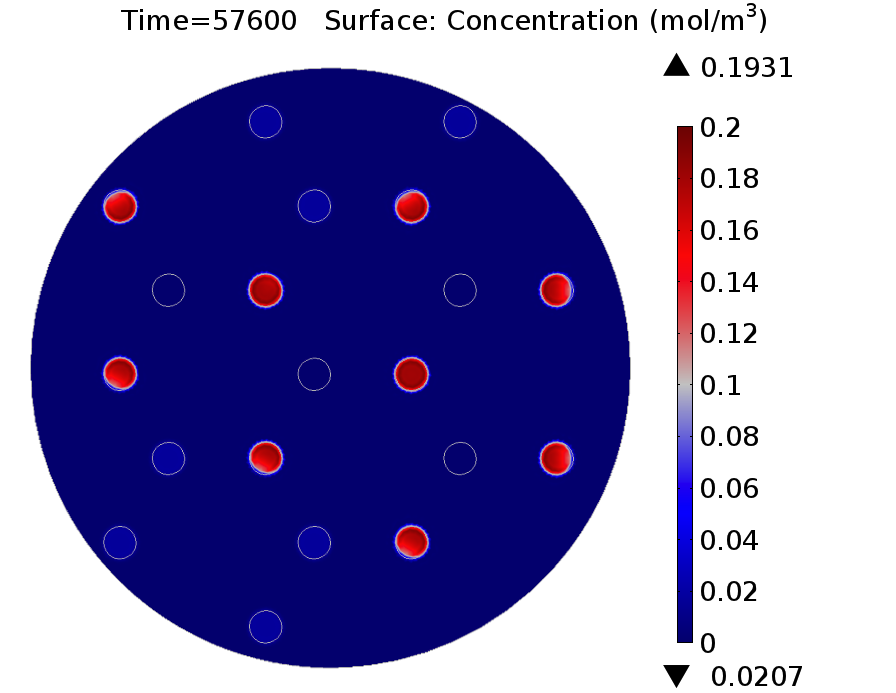
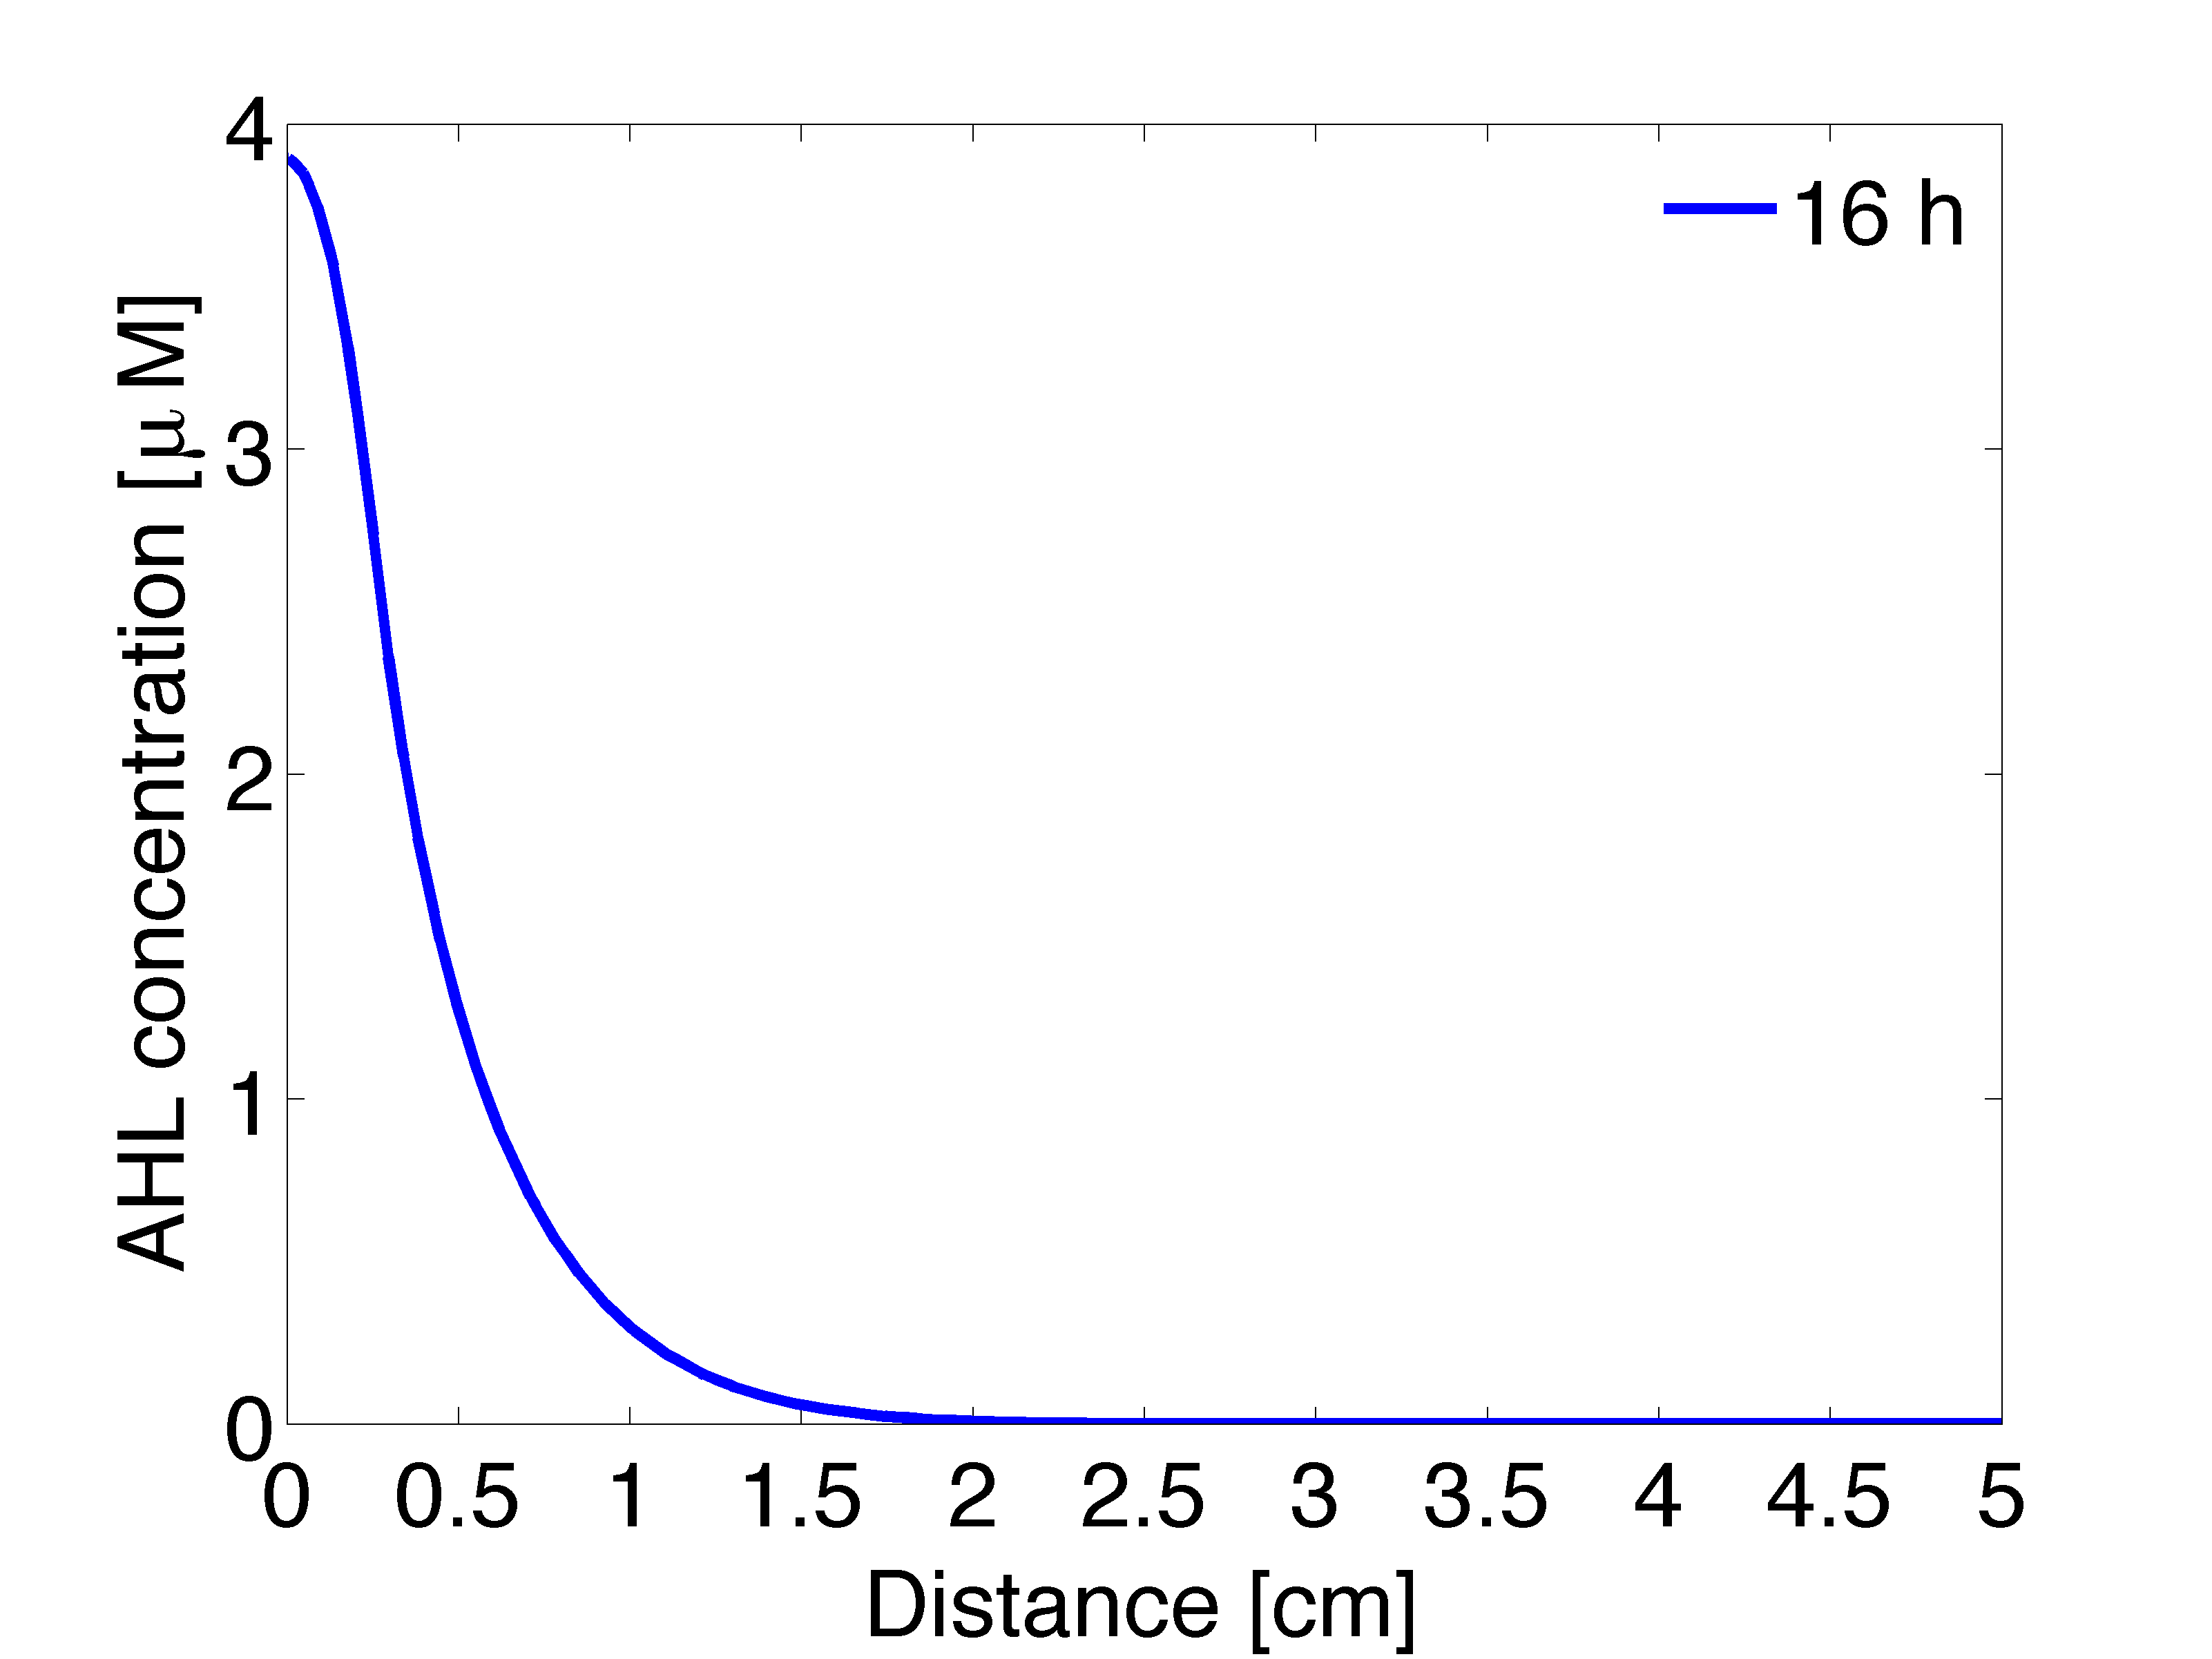
| - | In figure 1 and 3 are shown the results regarding GusA expression levels. From the time course plot (Fig 1.), it can be pointed out that the activation of the gene is consistent with the | + | In figure 1 and 3 are shown the results regarding GusA expression levels. From the time course plot (Fig 1.), it can be pointed out that the activation of the gene is consistent with the AHL concentration that is predicted to reach a receiver colony. Additionally, one can say that the incubations of the plates should not be longer than 17 hours, otherwise receiver cells that are more that one cell away from a mine can start synthesizing the enzyme. </p> |
<br> | <br> | ||
| - | {|style="border: none;" align="center" | + | {|style="border: none; background: transparent;" align="center" |
| - | |valign="top"|[[File: | + | |valign="top" style="border:none;"|[[File:GusALOW.png|510px|center|thumb|<b>Figure 1: Averaged GusA concentration </b> for a colony with 0, 1, 2 or 3 adjacent mines colonies, respectively. Distance between colonies: 1.5 cm. ]] |
| - | |valign="top"|[[File:Ahl gusA.png| | + | |valign="top" style="border:none;"|[[File:Ahl gusA.png|490px|center|thumb|<b>Figure 2: Averaged AHL concentration </b> sensed by a colony with 0, 1 or 2 adjacent mines colonies, respectively. The horizontal line indicates the activation coefficient by the dimer LuxR/AHL (K<sub>R1</sub>). Distance between colonies: 1.5 cm.]] |
|} | |} | ||
| + | |||
<br> | <br> | ||
| - | {|style="border: none;" align="center" | + | {|style="border: none; background: transparent;" align="center" |
| - | |valign="top"|[[File: | + | |valign="top" style="border:none;"|[[File:GusA_16h.png|510px|center|thumb|<b>Figure 3: GusA expression profile </b> after 16 hours. Display: GusA concentration in mM. Distance between colonies: 1.5 cm.]] |
| - | |valign="top"|[[File: | + | |valign="top" style="border:none;"|[[File:Ahl_16_2D .png|490px|center|thumb|<b>Figure 4: 1D averaged AHL concentration </b> gradient after 11 hours, radial direction]] |
|} | |} | ||
<br> | <br> | ||
<p align="justify"> | <p align="justify"> | ||
| - | Regarding the expression of AES under the control of | + | Regarding the expression of AES under the control of P<sub>LuxR</sub> variant (Fig 4.), there is not activation before 15 hours only basal expression. Should be noted that the predicted concentration of enzyme is very low if it is compared to GusA. </p> |
<br> | <br> | ||
[[File:AES.png|1000px|center|thumb|<b>Figure 4: AES expression profile </b> after 11 (left) and 16 hours (right). Display: AES concentration in mM. Distance between colonies: 1.5 cm.]] | [[File:AES.png|1000px|center|thumb|<b>Figure 4: AES expression profile </b> after 11 (left) and 16 hours (right). Display: AES concentration in mM. Distance between colonies: 1.5 cm.]] | ||
| + | |||
| + | <h1>Circuit optimization </h1> | ||
| + | |||
| + | <b> Protein destabilization </b> <br> | ||
| + | |||
| + | <p align="justify"> Now, we wanted to evaluate the destabilization of proteins, by reducing the half life of GusA and set it to 2 hours. In practice, this can be done introducing degradation tags. The idea is to compensate for the accumulation of GusA at receiver colonies surrounded by two mines, which starts earlier that AES. </p> | ||
| + | [[File:GusAFASTaesLOW.png|500px|center|thumb|<b>Figure 5:</b> Solid lines: Averaged GusA concentration over time for a colony with 0, 1, 2 or 3 adjacent mines colonies. Dotted: Averaged AES concentration over time for a colony with 0, 1, 2 or 3 adjacent mines colonies. Distance between colonies: 1.5 cm. ]] | ||
| + | |||
| + | <p align="justify"> According to simulation results, game should be played after 12 to 13 hours of incubation of the plates.</p> | ||
| + | |||
| + | <br> | ||
| + | |||
| + | <b> Positive feedback loop: Lowering basal expression </b> <br> | ||
| + | |||
| + | <p align="justify">As describe in the [https://2013.igem.org/Team:ETH_Zurich/Circuit#circuitOpt Data page], a main challenge of the circuit was to reduce the basal expression due to activation of the P<sub>LuxR</sub> promoter by LuxR alone. To overcome this issue we introduce a double negative feedback in the receiver module. The system of differential equations for the states involved in the receiver module were given before ([https://2013.igem.org/Team:ETH_Zurich/GFP#MineColony view]), which holds with a modification in the equation for LuxR and introducing a new equation for LacI: </p><br> | ||
| + | |||
| + | \begin{align} | ||
| + | \frac{d[LuxR]}{dt} = \frac{\alpha_{LuxR}}{1+ \left(\frac{[LacI]}{\theta_{LacI}}\right)^2} - d_{LacI} \cdot [LacI]\\ | ||
| + | \end{align} | ||
| + | |||
| + | \begin{align} | ||
| + | \frac{d[LacI]}{dt} = \frac{\alpha_{LacI}}{1+ \frac{[R]}{\theta_{R}}} - d_{LacI} \cdot [LacI]\\ | ||
| + | \end{align} | ||
| + | |||
| + | <p align="justify">For practical purposes the circuit was tested with GFP as reporter. </p> | ||
| + | |||
| + | <br clear="all"/> | ||
{{:Team:ETH_Zurich/templates/footer}} | {{:Team:ETH_Zurich/templates/footer}} | ||
Latest revision as of 10:58, 16 November 2013
Contents |
Circuit containing hydrolases
A six-species model was implemented to simulate the behaviour of our multicellular sender–receiver system. The model consist of one partial differential equation for AHL and 5 ordinary differential equations with Hill functions that captured the activation of protein synthesis as a function of the concentration of the signalling molecule.
Video: GusA expression levels over 24 hours, concentration in mol/m3. Distance between colonies: 1.5 cm.
For the agar plate and mine cells modules, we use the system of equations and parameters set of the previous simulation.
Mine Cells
Two proteins are produced by mine cells: (i) LuxI and (ii) NagZ. NagZ is the hydrolase responsible to reveal the mine identity, this gene is constitutively expressed and the protein is linearly degraded. The system of differential equations for the states involved in the sender module were given before (view), with exception of NagZ:
\begin{align}
\frac{d[NagZ]}{dt} = \alpha_{NagZ} - d_{NagZ} \cdot [NagZ]\\
\end{align}
Agar Plate
The equation for AHL in agar plate was given before (view).
Receiver Cells
Receivers are engineered to respond differently to two AHL concentration levels. Basically, cells should be capable of produce a visible response and in a reasonable amount of time, because the player will need to discriminate between the presence of 0, 1 or 2 adjacent mines. To achieve this goal, we incorporate two enzymatic reporters acting as high-pass filters (GusA and AES). The expression of these enzymes is under the control of PLux promoters with different sensitivities, the wild type and a promoter mutant (G1 mutant); The affinity constants for the promoters were obtained from our experimental data. However, the affinity was determined with respect to AHL, thus we omit the complex formation and model production of the enzymes as function of AHL concentration. The assumption is not unrealistic because LuxR was constitutively produced and linearly degraded, which leads to a constant concentration. An additional important feature of these enzymes is that they can catalyze the hydrolysis of various chromogenic compounds to give rise to a relatively quick coloured response.
The intracellular species of interest in the receiver cells module include: LuxR, AHL and the hydrolases (GusA and AES).
\begin{align} \frac{d[LuxR]}{dt}=\alpha_{[LuxR]} - d_{LuxR} [LuxR] \\ \end{align} \begin{align} \frac{d[AHL]}{dt}= C_{agar} \cdot D_{AHL} \nabla^{2} AHL - DF \cdot d_{AHL} \cdot [AHL] \\ \end{align} \begin{align} \frac{d[GusA]}{dt}=\alpha_{GusA} \cdot k_{leaky} \cdot [LuxR]+ \frac{\alpha_{GusA}\left(\frac{[AHL]}{K_{R_1}}\right)^{n_1}}{1+\left(\frac{[AHL]}{K_{R_1}}\right)^{n_1}} - d_{GusA}\cdot [GusA]\\ \end{align} \begin{align} \frac{d[AES]}{dt}=\alpha_{AES} \cdot k_{leaky} \cdot [LuxR] + \frac{\alpha_{AES}\left(\frac{[AHL]}{K_{R_2}}\right)^{n_2}}{1+\left(\frac{[AHL]}{K_{R_2}}\right)^{n_2}} - d_{AES}\cdot [AES]\\ \end{align}
In addition to new proteins incorporated to the circuit, it is important to emphasize that the grid was changed to a three neighbours setup.
Results
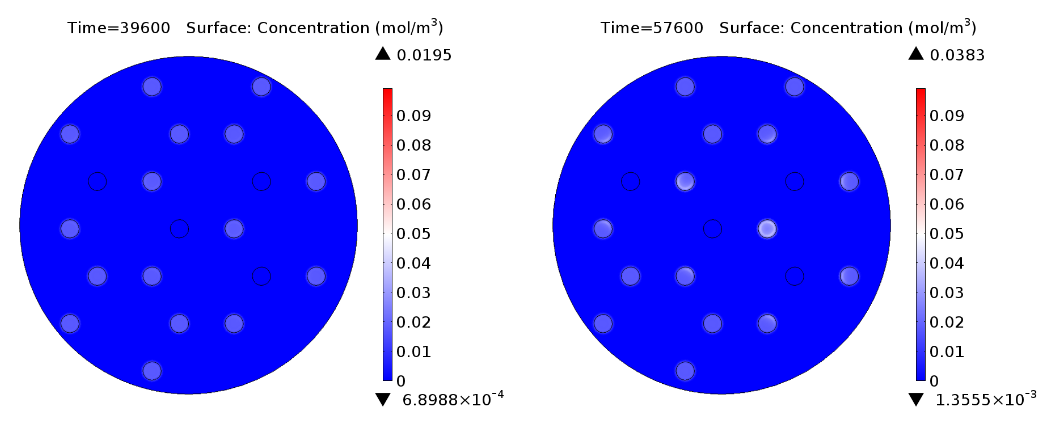
In figure 1 and 3 are shown the results regarding GusA expression levels. From the time course plot (Fig 1.), it can be pointed out that the activation of the gene is consistent with the AHL concentration that is predicted to reach a receiver colony. Additionally, one can say that the incubations of the plates should not be longer than 17 hours, otherwise receiver cells that are more that one cell away from a mine can start synthesizing the enzyme.
Regarding the expression of AES under the control of PLuxR variant (Fig 4.), there is not activation before 15 hours only basal expression. Should be noted that the predicted concentration of enzyme is very low if it is compared to GusA.
Circuit optimization
Protein destabilization
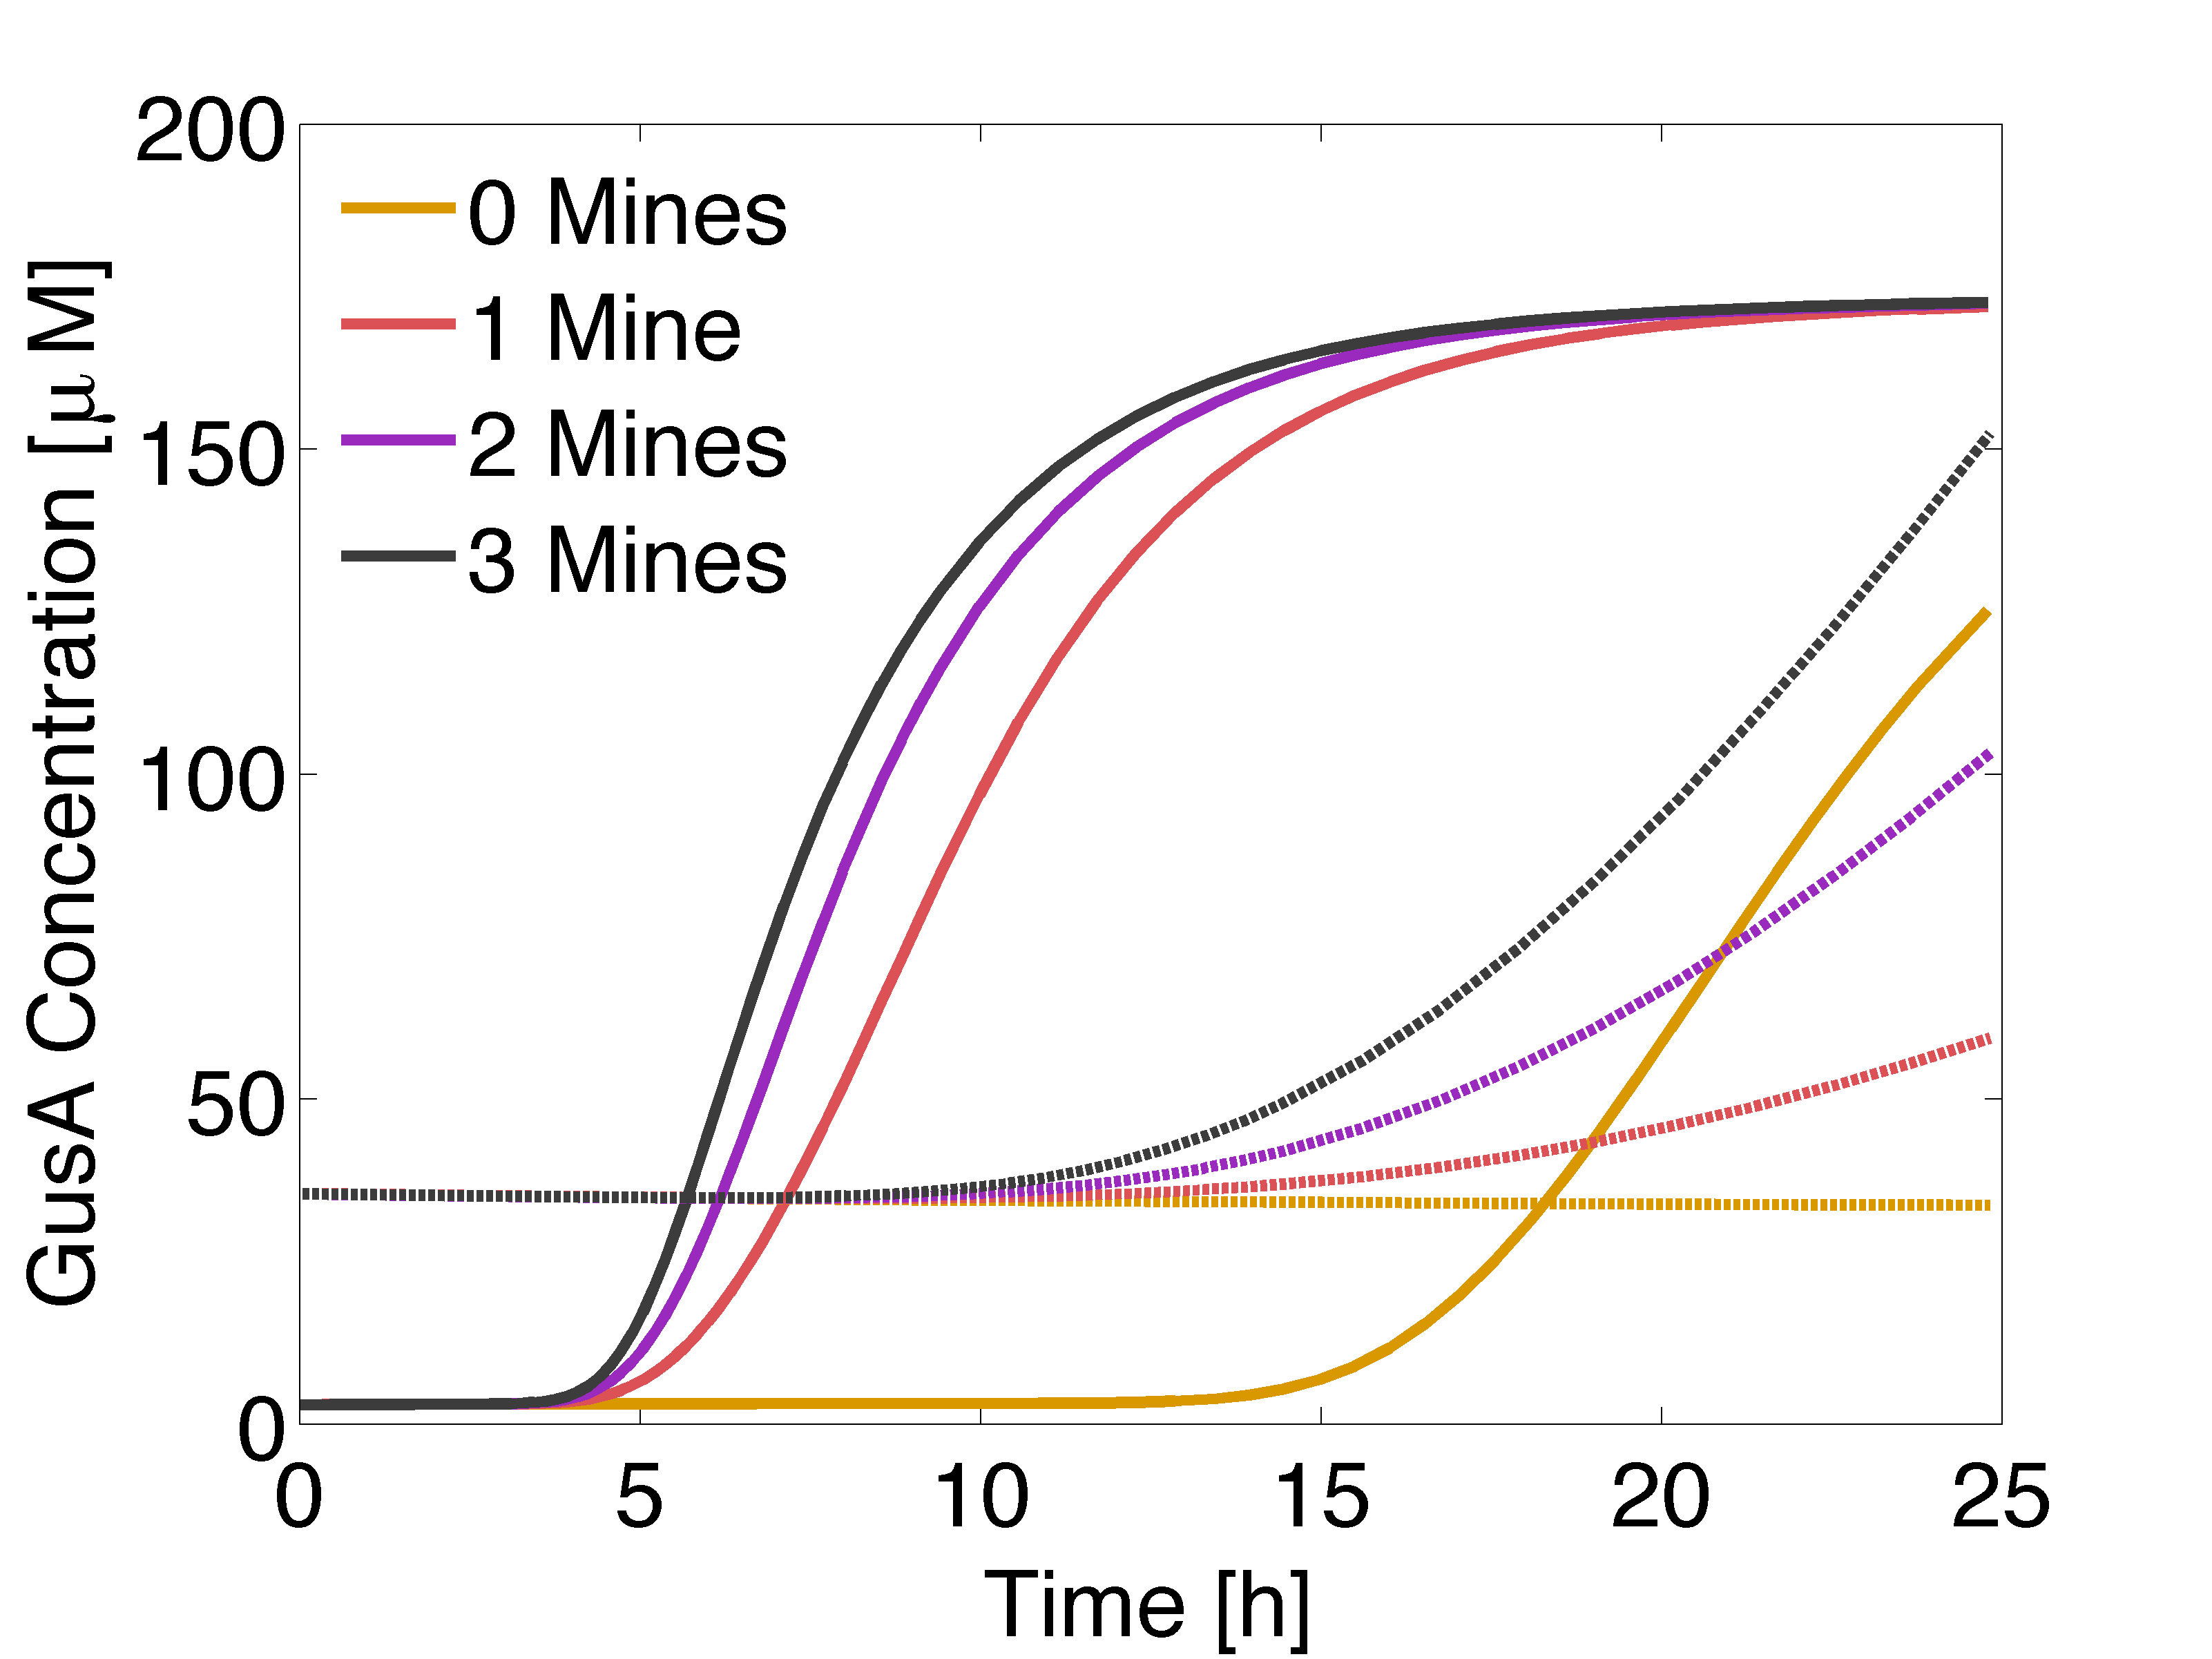
Now, we wanted to evaluate the destabilization of proteins, by reducing the half life of GusA and set it to 2 hours. In practice, this can be done introducing degradation tags. The idea is to compensate for the accumulation of GusA at receiver colonies surrounded by two mines, which starts earlier that AES.
According to simulation results, game should be played after 12 to 13 hours of incubation of the plates.
Positive feedback loop: Lowering basal expression
As describe in the Data page, a main challenge of the circuit was to reduce the basal expression due to activation of the PLuxR promoter by LuxR alone. To overcome this issue we introduce a double negative feedback in the receiver module. The system of differential equations for the states involved in the receiver module were given before (view), which holds with a modification in the equation for LuxR and introducing a new equation for LacI:
\begin{align} \frac{d[LuxR]}{dt} = \frac{\alpha_{LuxR}}{1+ \left(\frac{[LacI]}{\theta_{LacI}}\right)^2} - d_{LacI} \cdot [LacI]\\ \end{align}
\begin{align} \frac{d[LacI]}{dt} = \frac{\alpha_{LacI}}{1+ \frac{[R]}{\theta_{R}}} - d_{LacI} \cdot [LacI]\\ \end{align}
For practical purposes the circuit was tested with GFP as reporter.
 "
"


