Team:ETH Zurich/Modeling
From 2013.igem.org
Contents |
Circuit containing hydrolases
A seven-species model was implemented to model the spatio-temporal behaviour of our multicellular sender–receiver system. The model was based on partial differential equations with Hill functions that captured the activation of protein synthesis as a function of the concentration of the signalling molecule.
For the agar plate and mine cells modules, we use the system of equations and parameters set of the previous simulation.
Mine Cells
The PDEs for the states involved in the sender module are given below:
Agar Plate
The PDE for OHHL in the agar plate is given below:
Receiver Cells
Receivers are engineered to respond differently to two OHHL concentration levels. Basically, cells should be capable of produce a visible response and in a reasonable amount of time for the player, in order to be able to discriminate between the presence of 0, 1 or 2 adjacent mines. To achieve this goal, we incorporate two enzymatic reporters (GusA and AES) instead of GFP, under the control of pLux</sub> promoters with different sensitivities. Such enzymes can catalyze the hydrolysis of various chromogenic compounds to give rise to a relatively quick coloured response.
The intracellular species of interest in the receiver cells module include: LuxR, OHHL, LuxR/OHHL complex (denoted as R) and the hydrolases (GusA and AES).
In addition to new proteins incorporated to the circuit, it is important to emphasize that the grid was changed to a three neighbours setup.
Results
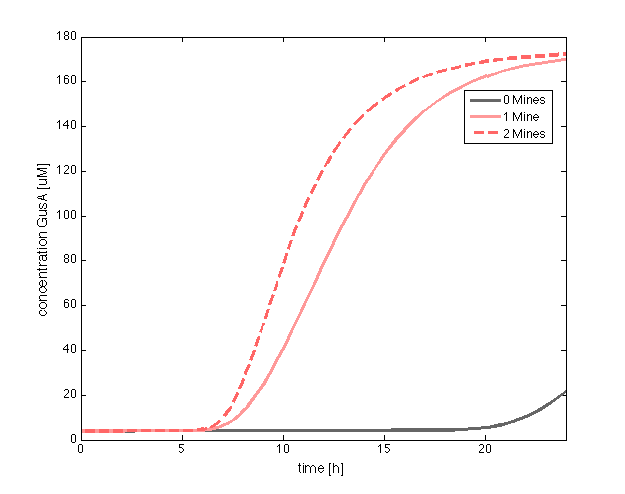
According to the expression levels of GusA, the incubations of the plates should not be longer than 17 hours, otherwise receiver cells that are two cells away from a mine can start producing the enzyme.
 "
"


