 "
"
Team:Heidelberg/Modelling/Ind Production
From 2013.igem.org


Project

Notebook


Human Practice


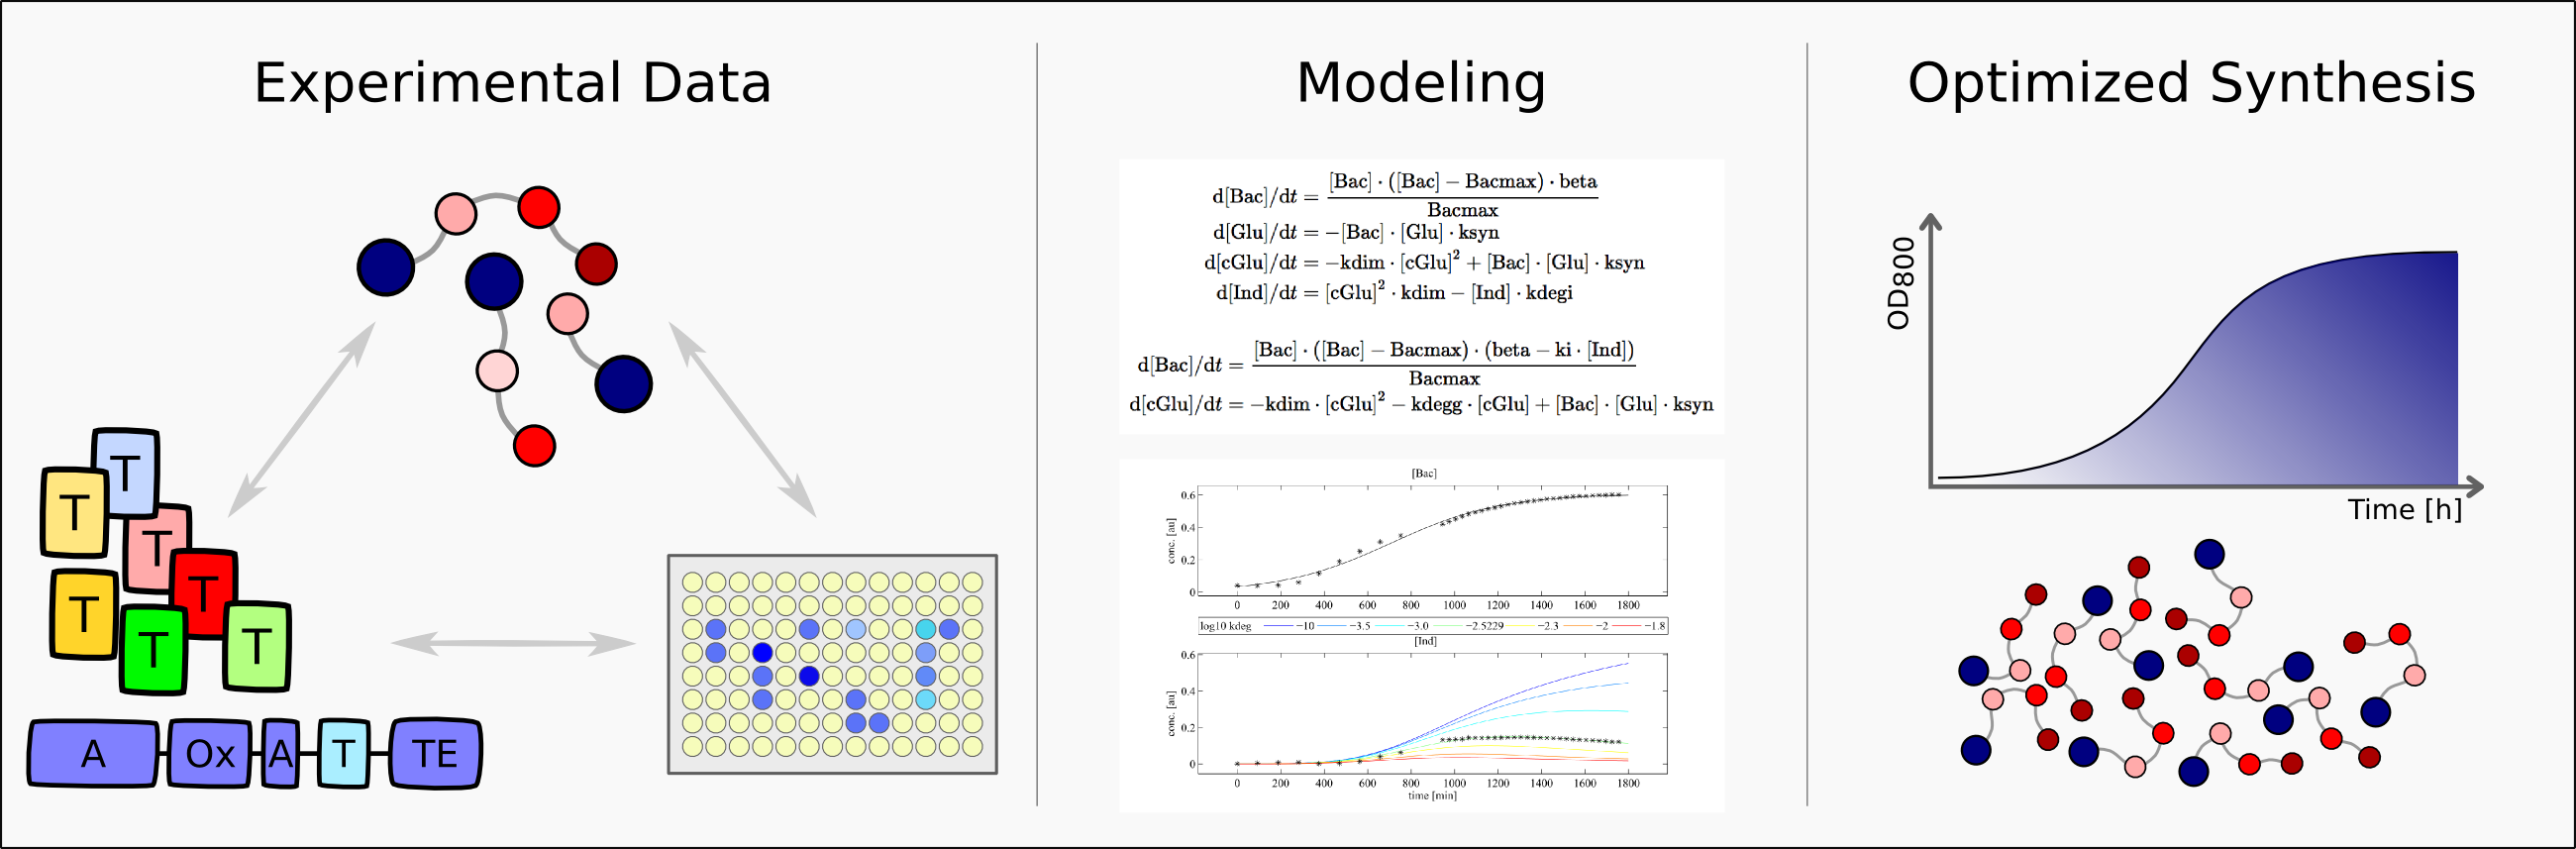
Indigoidine Production. Quantitative dynamic modeling.
Highlights
- Suitable equations for bacterial growth and indigoidine synthesis
- Practically and structurally fully identifiable mathematical model
- Good agreement between theoretical trajectories and experimental data
- Investigation of mechanistic impact of kinetic parameters on indigoidine production
- Sensitivity analysis for optimization of peptide yield
- Proposal for engineering of T domains to alter synthesis rates
Abstract
To help the wet-lab team evaluate their experimental results by providing quantitave information, we derived a mathematical model of indigoidine synthesis, which was fitted to time-resolved experimental data. The estimated parameters corresponded very well to preliminary qualitative and semi-quantitave analysis performed by the indigoidine team. We performed sensitivity analysis to determine the most promising parameters to tweak for optimized indigoidine production.


Challenge
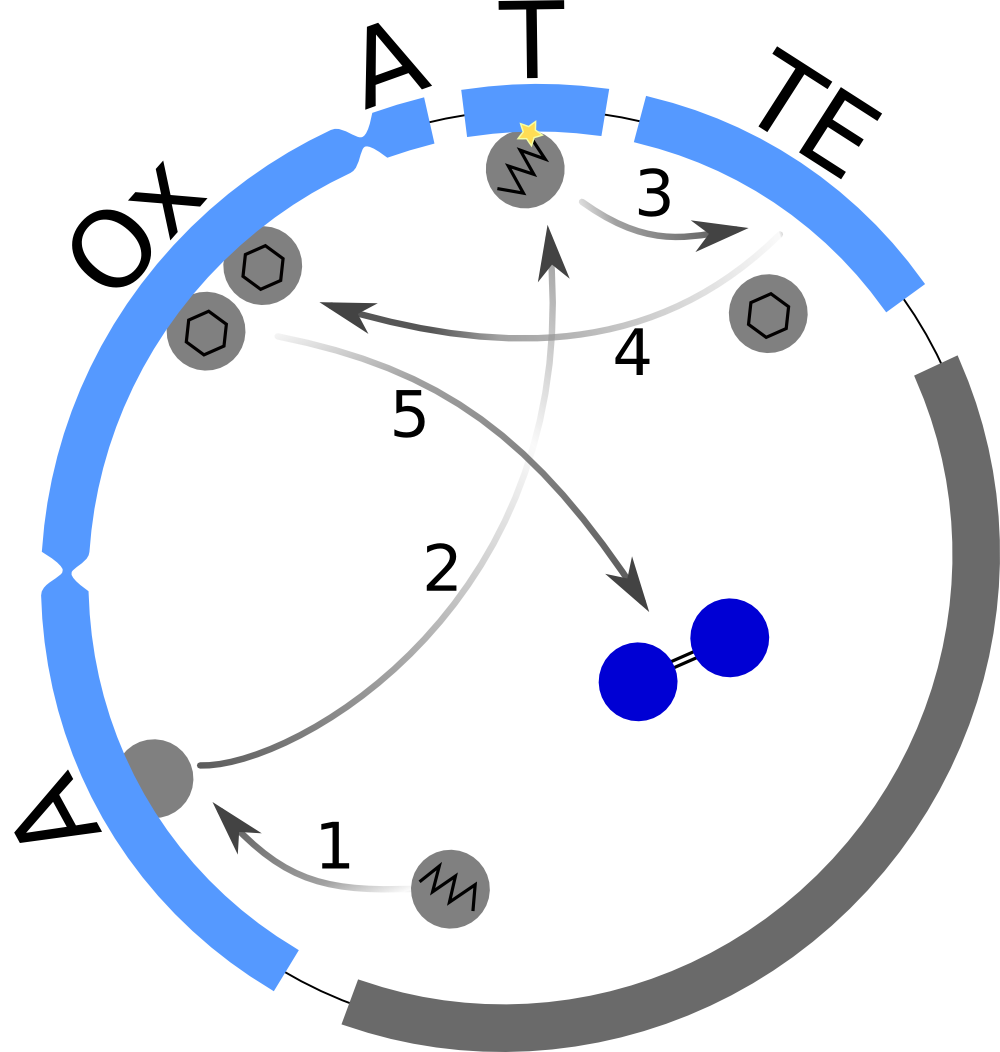
A challenge we had to face during the characterization and optimization of indC was to identify the production kinetics of indigoidine. In order to disentangle the underlying mechanisms of bacterial growth and peptide synthesis, we decided to set up a mathematical model based on coupled ordinary differential equations (ODEs). Calibrated with our experimental time-resolved data, the mathematical model could potentially not only elucidate how indigoidine production influences growth of bacteria but also provide a more quantitative understanding of the synthesis efficiency of the different T domains and PPTases that were tested.Approach
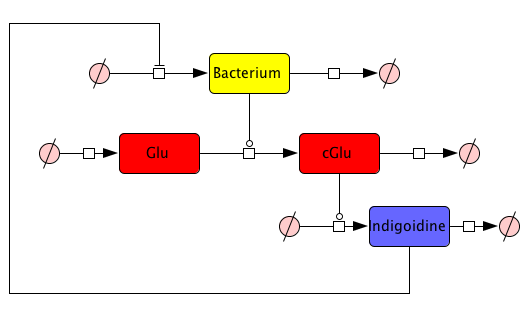
First, we set up a mind model based on the fact that the functional indigoidine dimer is produced from two glutamines (Glu) that are each cyclized (cGlu)[1] (Fig. 1), and our observation that indigoidine (Ind)-producing bacteria (Bac) grow slower than mock controls. Those hypotheses resulted in a general model scheme depicting the interdependency between indigoidine synthesis and bacterial growth. With the mathematical model, we could then validate whether there is indeed a negative feedback from the indigoidine production to the growth of bacteria.
Since we had already established our quantitative indigoidine production assay (see Tag-Optimization) in a time-dependent manner, we wanted to further exploit these experimental data via quantitative dynamic modeling. The change of bacteria and Indigoidine with time was measured via optical density of the liquid cultures in a 96-well plate of a TECAN reader and can be described in ordinary differential equations (ODEs). Such ODEs contain parameters that characterize e.g. growth or synthesis rates for bacteria or indigoidine, respectively.
Ordinary Differential Equations (ODEs)
How to find proper equations for bacterial growth and indigoidine synthesis? From our mind model (Fig. 2), we derived ODEs based on mass-action kinetics[2]. However, bacterial growth curves cannot be sufficiently described by mass action, thus we adapted our ODE for the bacterial growth from equation (7) of Kenneth and Kamau, 1993[3]. Our ODE system is now given by the following 4 equations:
\begin{align} \mathrm{d}\mathrm{[Bac]}/\mathrm{d}t &= \frac{\mathrm{[Bac]} \cdot \left(\mathrm{Bacmax} - \mathrm{[Bac]}\right) \cdot \mathrm{beta}}{\mathrm{Bacmax}}\label{bacgrowth}\\ \mathrm{d}\mathrm{[Glu]}/\mathrm{d}t &= - \mathrm{[Bac]} \cdot \mathrm{[Glu]} \cdot \mathrm{ksyn}\label{glu}\\ \mathrm{d}\mathrm{[cGlu]}/\mathrm{d}t &= - \mathrm{kdim} \cdot {\mathrm{[cGlu]}}^2 + \mathrm{[Bac]} \cdot \mathrm{[Glu]} \cdot \mathrm{ksyn}\label{cglu}\\ \mathrm{d}\mathrm{[Ind]}/\mathrm{d}t &= {\mathrm{[cGlu]}}^2 \cdot \mathrm{kdim} - \mathrm{[Ind]} \cdot \mathrm{kdegi}\label{ind} \end{align}
Initially, inhibition of bacterial growth by indigoidine and degradation of cyclic glutamine were also described by the model, using equations \eqref{bacgrowthinhib} and \eqref{cgludeg} instead of \eqref{bacgrowth} and \eqref{cglu}, respectively, however the degradation rate turned out to be non-identifiable for all data sets, converging to the lower bound, whereas the growth inhibition term led to frequent convergence failures, the inhibition constant being very low in cases where convergence was achieved. These two terms were thus removed from the model. \begin{align} \mathrm{d}\mathrm{[Bac]}/\mathrm{d}t &= \frac{\mathrm{[Bac]} \cdot \left(\mathrm{Bacmax} - \mathrm{[Bac]}\right) \cdot \left(\mathrm{beta} - \mathrm{ki} \cdot \mathrm{[Ind]}\right)}{\mathrm{Bacmax}}\label{bacgrowthinhib}\\ \mathrm{d}\mathrm{[cGlu]}/\mathrm{d}t &= - \mathrm{kdim} \cdot {\mathrm{[cGlu]}}^2 - \mathrm{kdegg} \cdot \mathrm{[cGlu]} + \mathrm{[Bac]} \cdot \mathrm{[Glu]} \cdot \mathrm{ksyn}\label{cgludeg} \end{align}
This system contains 4 dynamic variables: Bacteria (Bac), Glutamine (Glu), cyclized Glutamine (cGlu) and Indigoidine (Ind) that change with time t. Bacteria and Indigoidine was experimentally measured, we thus call Bac and Ind observables of our system. The equations are described by 5 kinetic parameters:
- Bacmax: maximum capacity for bacterial growth
- beta: maximum attainable growth rate
- ksyn: synthesis rate of cyclized glutamine from glutamine
- kdim: dimerization rate of two cyclized glutamines to an Indigoidine dimer
- kdegi: degradation rate of indigoidine
In addition, the experimental error for the observables was estimated with 2 error parameters and the initial concentration of the bacteria at t=0 was estimated. Data was otherwise normalized between 0 and 1, thus no scaling and offset parameters were required. In order to keep the model simple, it does not contain glutamine production, the initial glutamine concentration was arbitrarily set to 1. While this does not permit conclusions about absolute indigoidine synthesis rates, comparison of rates between the individual conditions is possible.
Framework
Parameters have to be estimated from experimental data. In order to implement our mathematical model and the wetlab data, we used an open-source software package allowing for comprehensive analysis (D2D Software). With this framework, we were able to calibrate the model and perform robust parameter estimations[4] as well as identifiability analysis[5] yielding valuable insight into bacterial indigoidine production.
Results
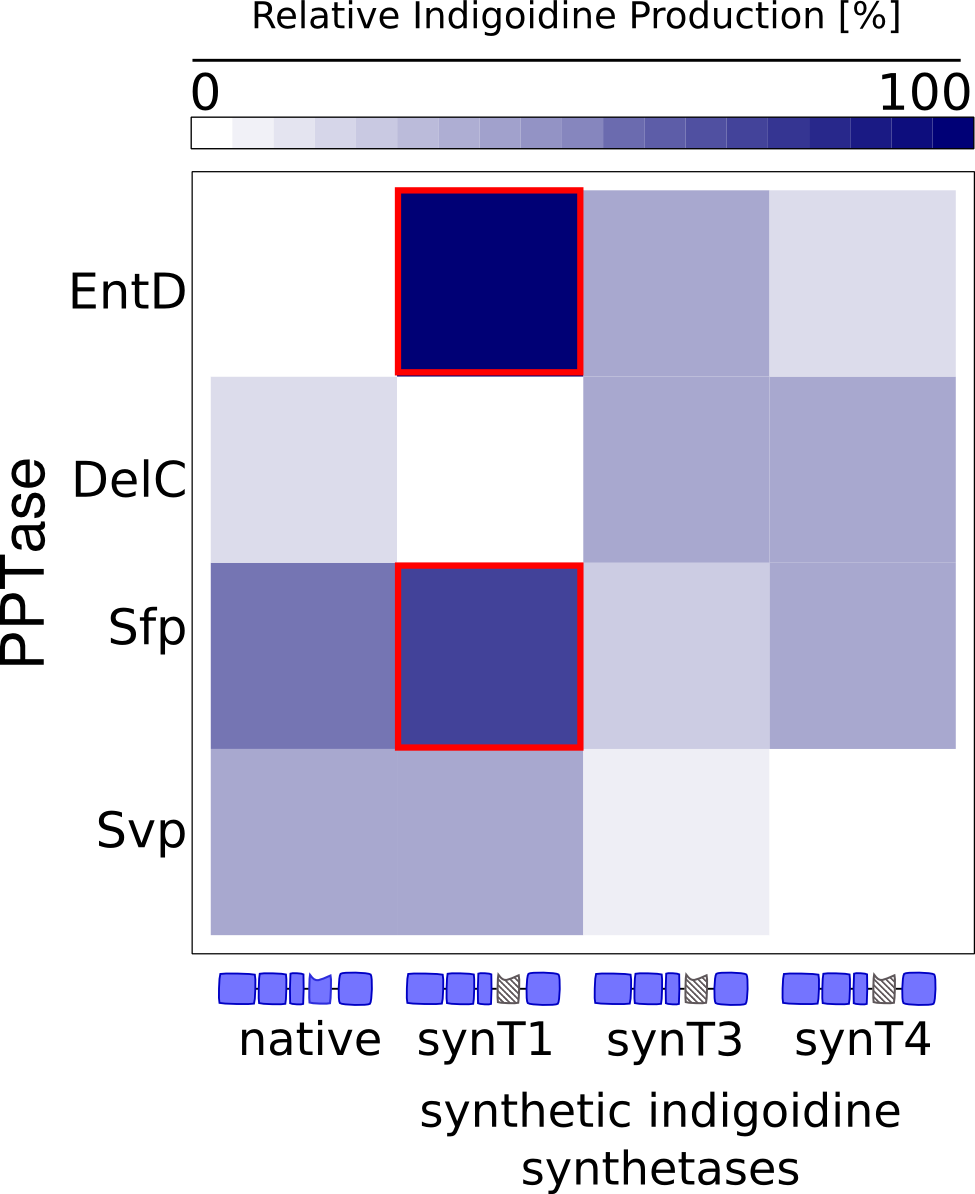
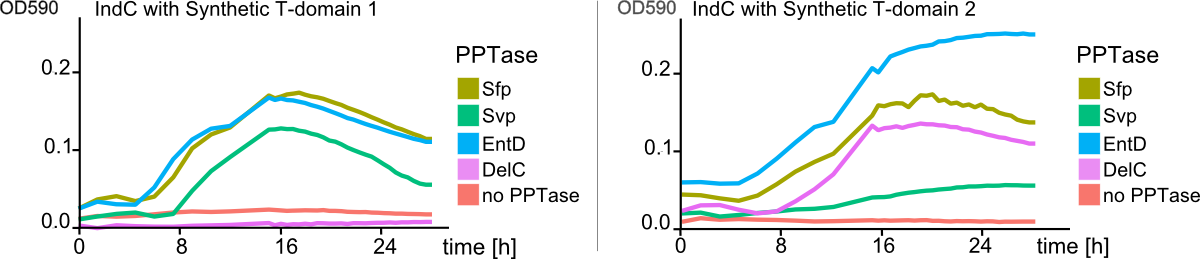
We received experimental data from the indigoidine team, who wanted to compare indigoidine synthesis rates between various T domains and PPTases. The model described above was thus fitted individually to each T domain / PPTase combination and simultaneously to all replicates. The data sets could be grouped into two types, those with a significant indigoidine production and those without. Although both types of data sets resulted in seemingly good fits (Fig. 4), identifiability analysis using a profile likelihood exploiting approach[6] showed that for all data sets without indigoidine production at least one parameter could not be reliably estimated (an exemplary plot is shown in Fig. 5B), whereas all parameters were identifiable for data sets showing indigoidine production (Fig. 5A). As our model only permits relative quantification of synthesis rates due to the lack of glutamine production and the arbitrarily chosen initial glutamine concentration, we normalized the indigoidine synthesis rates of the fully identifiable data sets to the range [0, 1] and visualized them in a heatmap (Fig. 3). SynT1 seems to be the most effective T domain for the entD and sfp PPTases, which corresponds very well to the preliminary analysis performed by the indigoidine team.
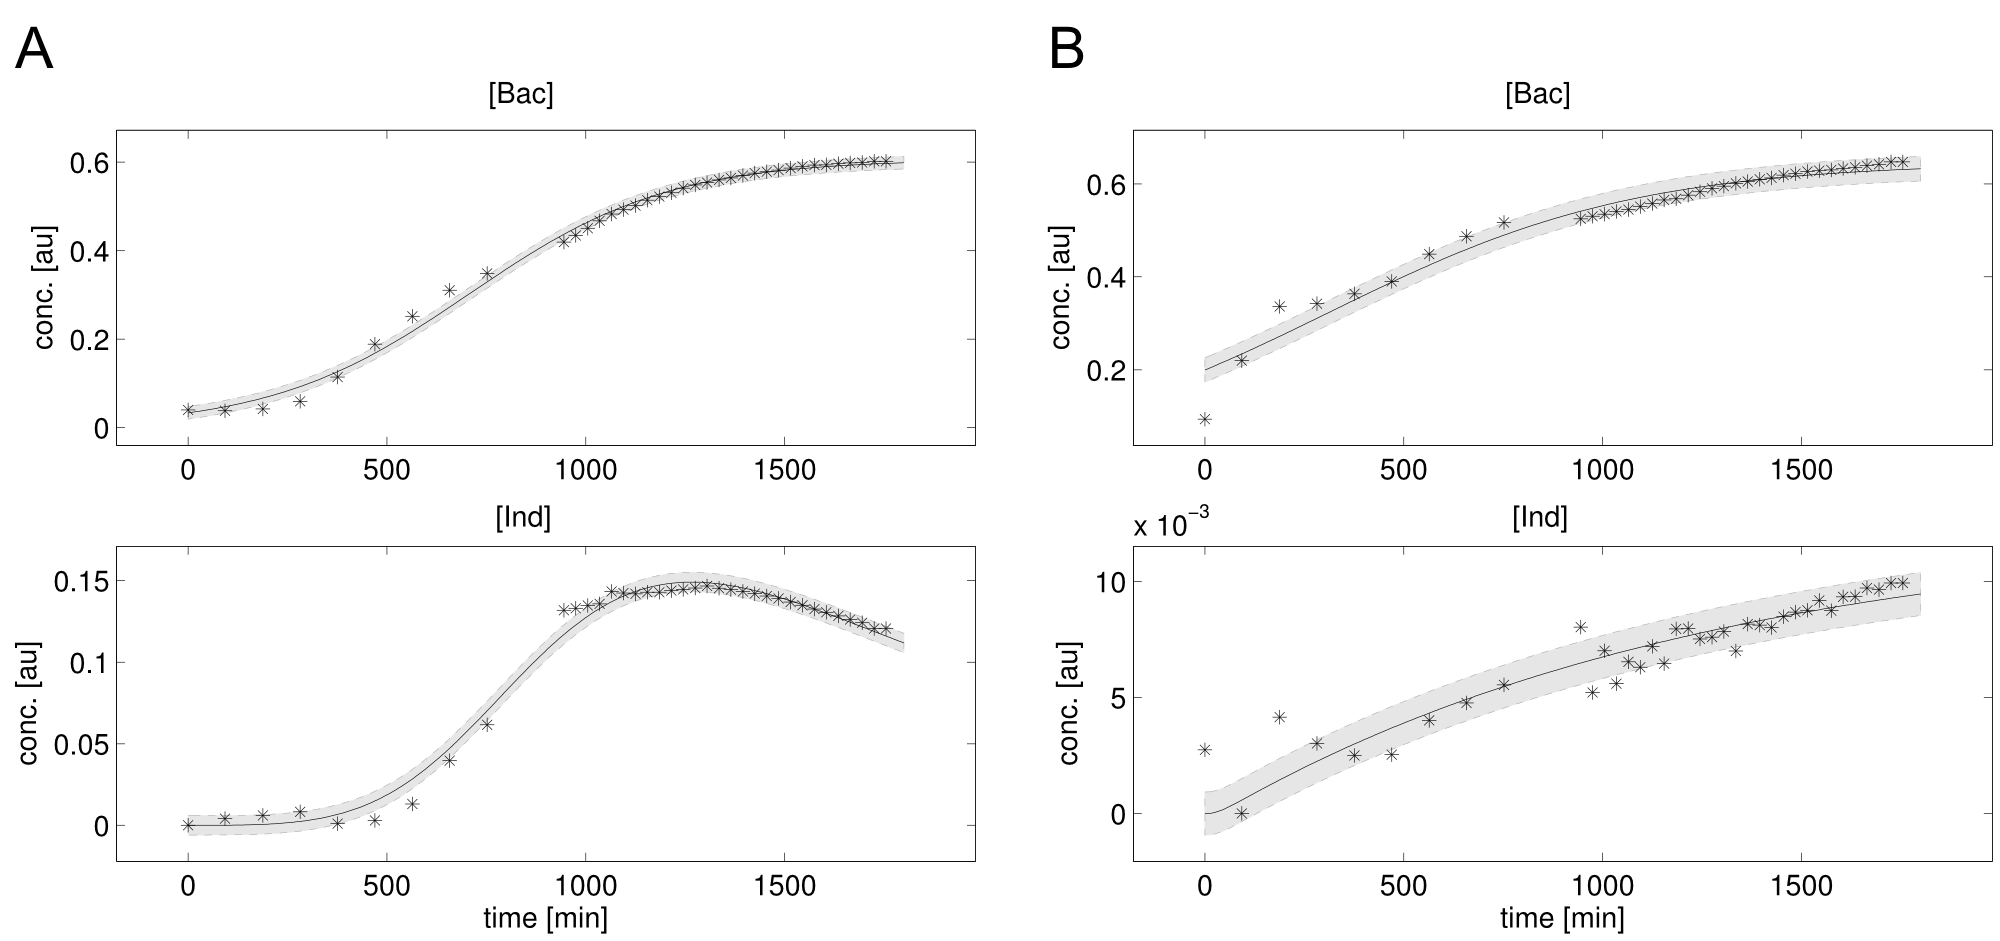
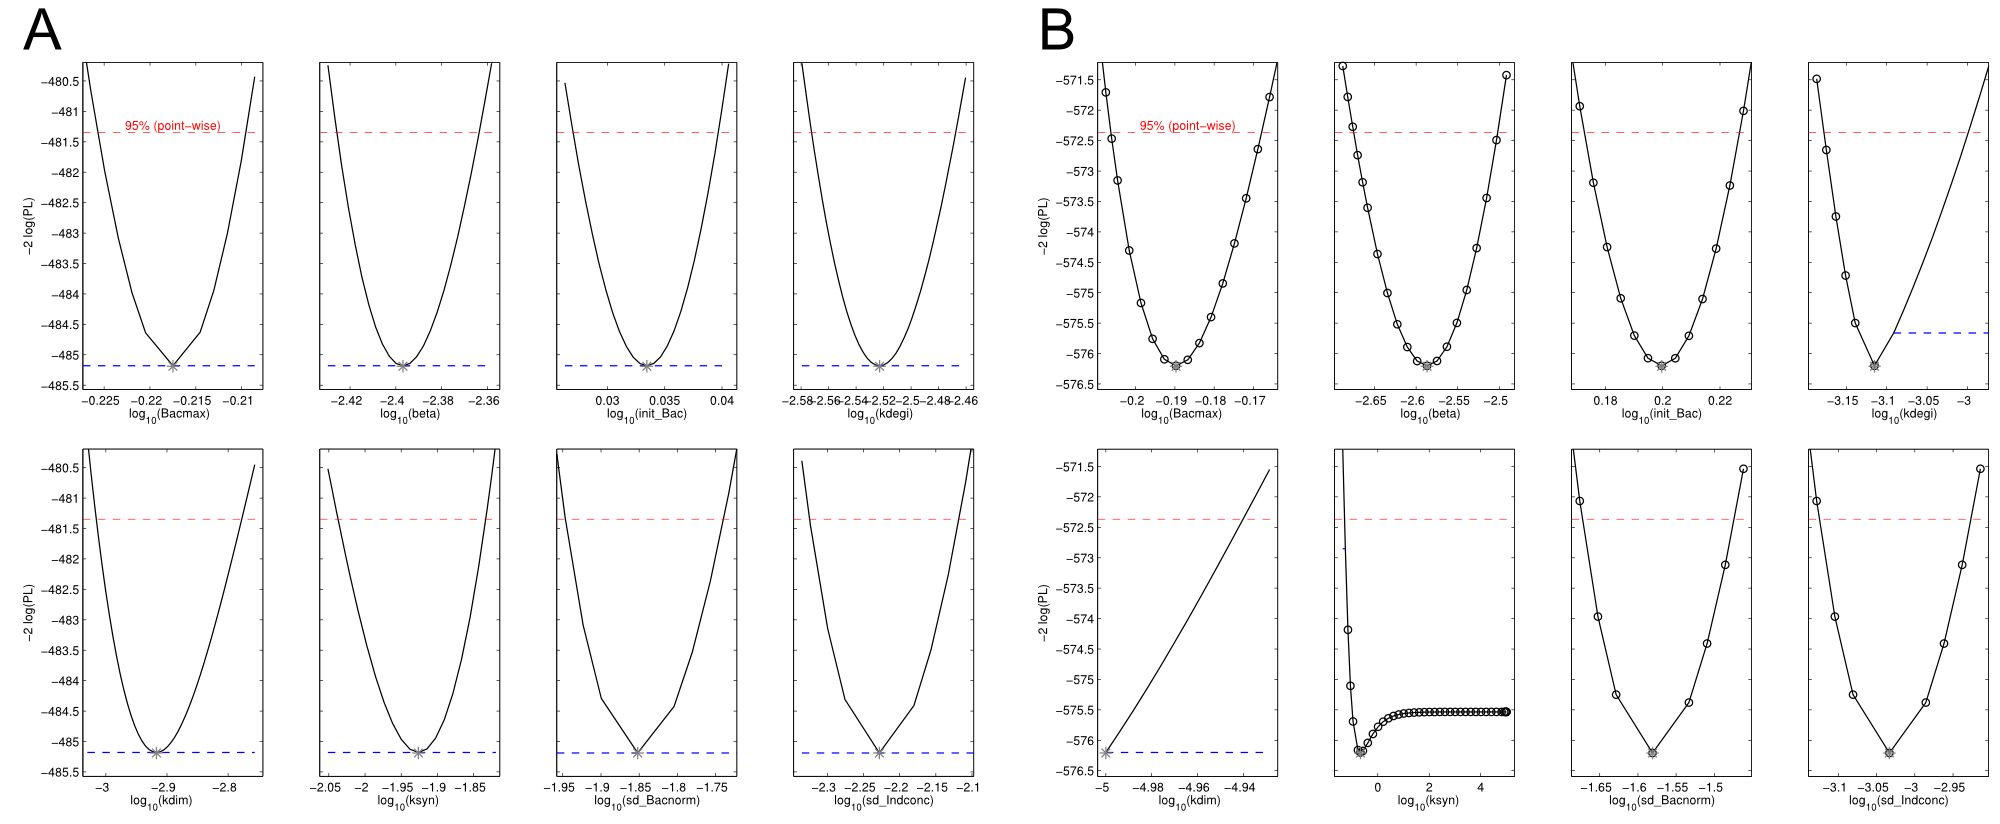
Our mathematical model was able to describe most of our experimental data and was in those cases structurally and practically fully identifiable. We thus challenged the model to deduce additional facts on indigoidine synthesis. First, we had a look at the parameters that were estimated to describe our experimental data sets. For each parameter estimate, the lower boundary was set to 1e-5 and the upper boundary was set to 1e+5. Initial guesses for parameters during parameter estimations were generated via latin hypercube sampling to ensure broad coverage of all regions in the high-dimensional parameter space[7]. Nevertheless, some parameters exhibited broad variation among the best fits of the different data sets while other parameters were estimated in a narrow range (Fig. 6).
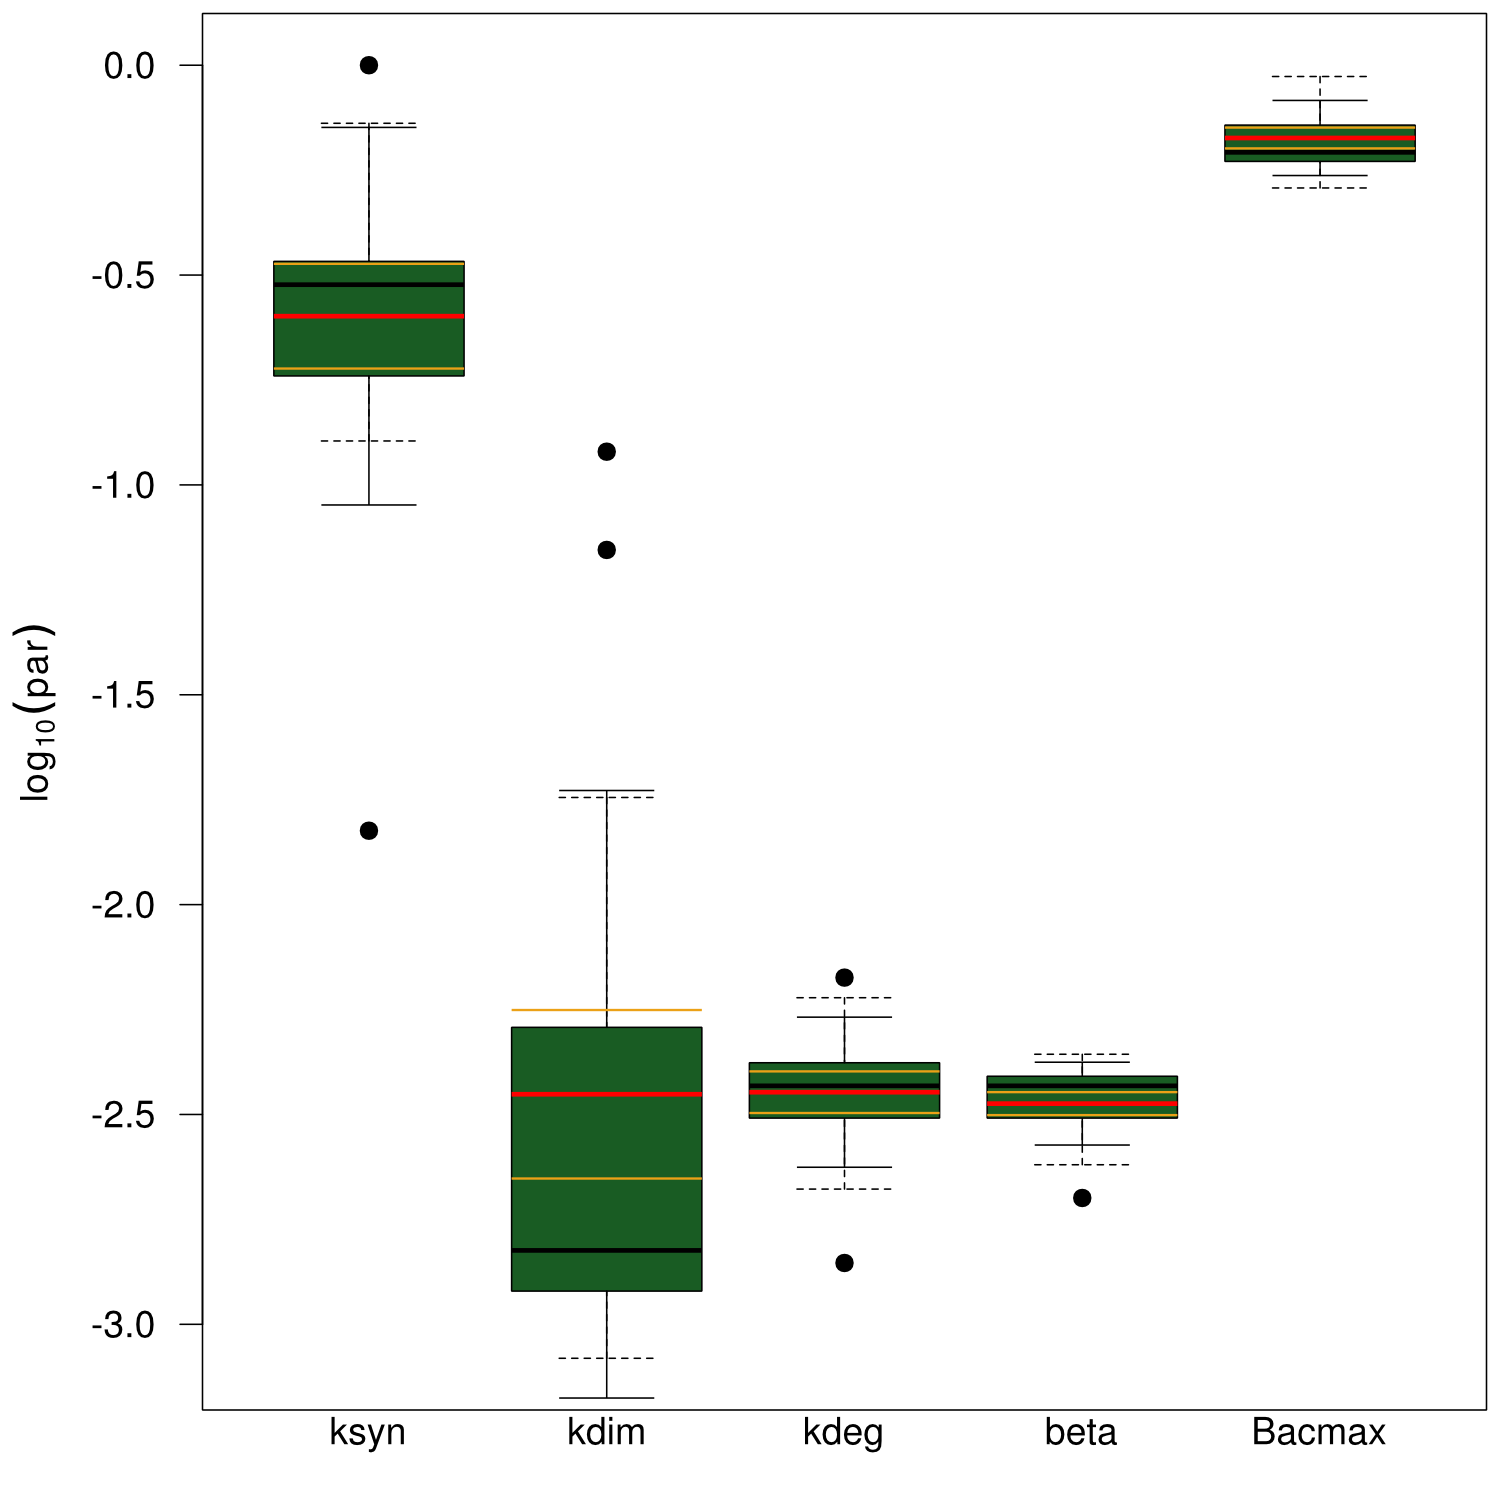
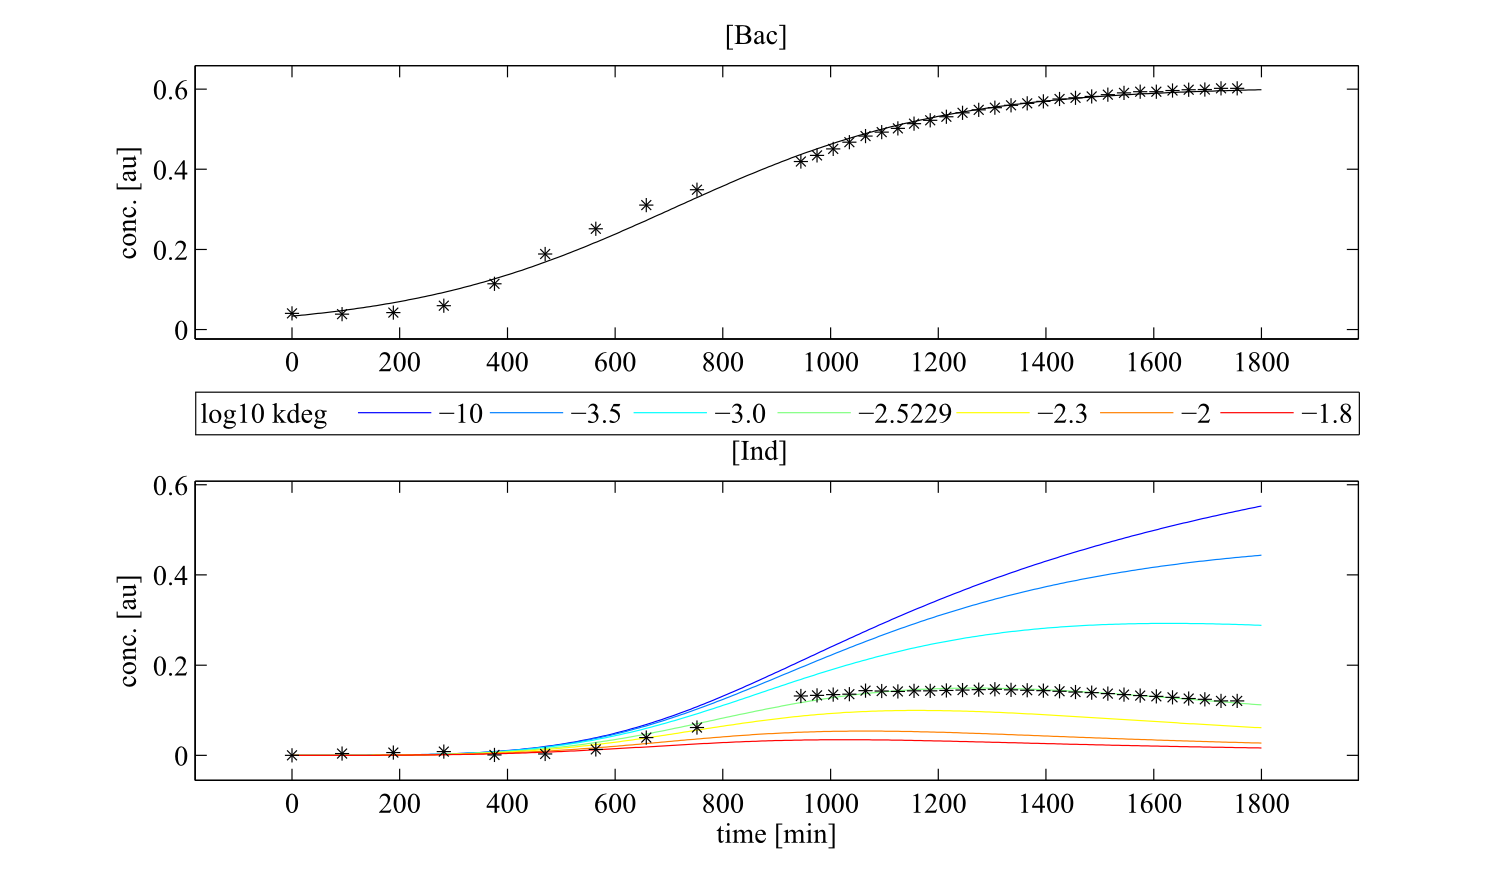
Interestingly, the bacterial growth rate beta and the maximum growth capacity Bacmax were very consistent. The parameters ksyn, kdim and kdegi contributed directly to indogoidine synthesis as it can be inferred from the above mentioned equations \eqref{glu}, \eqref{cglu} and \eqref{ind}. The synthesis rate ksyn characterizes the cyclization of glutamine. The dimerization rate kdim reflects how two cyclized glutamine molecules form one indgoidine molecule. As such, ksyn and kdim represent the efficiency of the T domain of indC. The degradation rate of indigoidine, kdegi, should be independent from the domain structure of the indigoidine synthetase as the stability of the peptide is not affected by the T domains or the PPTases that were tested. The rate did not vary widely and the diverse data sets could still be explained by the mathematical model. At first glance, kdegi seemed less important for our experimentally assessed conditions. To further investigate the role of kdegi for indigoidine production kinetics, we systematically varied this parameter and compared simulation results. The synthesis of indigoidine was clearly affected by variation of kdegi (Fig. 7). The [Ind] trajectory collapsed more than 3-fold increase of the degradation rate. On the contrary, improved peptide stability could yield much more indigoidine. For very low degradation rates (i.e. kdegi < 1e-3), synthesis would not even saturate within the observed time frame.
Sensitivity analysis for optimized indigoidine production
To perceive the role of kdegi for indigoidine synthesis, we have varied the parameter over a broad range and observed qualitatively distinct model trajectories. For a more quantitative understanding of how indigoidine yield changes with altering parameters of the system, we conducted a sensitivity analysis[8]. Therefore, we first defined the variable IntInd, the integrated indigoidine reflecting production yield. The change of the indigoidine concentration with time is determined by the ODE \eqref{ind} and its integral with time can be depicted as the area under the [Ind] curve, i.e. the amount of indigoidine produced by the bacteria with time. Now we were interested in the change of IntInd with the change of the different parameters of our system. Mathematically, this is expressed as the so called sensitivity $\frac{\partial \mathrm{X}}{\partial \mathrm{p}}$, with X as our variable of interest (IntInd) and p as the parameter (beta, Bacmax, ksyn, kdim or kdegi, respectively). This partial derivative provides a measure of how much X changes with the change of p or how sensitive X is against small variations in p. Sensitivities can be scaled with the actual values of X and the respective p to fall in the range from -1 to +1. The higher the absolute value of the sensitivity, the more important is the parameter for the variable. A positive sensitivity means positive impact of the parameter on the variable whereas a sensitivity < 0 indicates reduction of X for subtle decrease in p. We utilised our mathematical model and computed the sensitivities of IntInd against the change of all five kinetic parameters of our system and scaled them accordingly. The analysis confirmed that the kdegi was the only parameter of the system that exhibited a negative impact on the indigoidine production (Tab. 1). Slight increase of all the other parameters also augmented additional yield.
Sensitivity analysis for native_sfp:| Parameter | $$\left.\mathrm{[Bac]}\right|_{t=0}$$ | kdegi | kdim | beta | ksyn | Bacmax |
|---|---|---|---|---|---|---|
| $$\frac{\partial\int\!\mathrm{Ind}\,\mathrm{d}t}{\partial p}$$ | 0.784 | -0.7024 | 0.5117 | 0.3338 | 0.2919 | 0.1036 |
The initial concentration of bacteria represented the most crucial parameter for indigoidine production, which was intuitive since the amount of produced indigoidine depends on the amount of bacteria in culture that synthesise the peptide. The parameter kdegi exhibited a high impact on IntInd but did not vary so much among the experimental conditions. One would assume that the half-life of the peptide is not affected by different T domains or PPTases. Possibly, the arrangement of modules influences peptide stability as inter-modular communication is a precondition for robust peptide assembly[9]. This links the peptide synthesis optimisation to our module shuffling project where modules of different hosts were combined for custom peptide synthesis. Indigoidine yield was also sensitive against small variations in beta and Bacmax. Culture conditions could be improved and metabolically more active strains could be chosen to further optimize performance in this respect. The parameters ksyn and kdim also determine peptide production.
The question is whether those rates could be altered by engineering the NRPS to advanced performance. To answer this question, we performed multiple linear regressions. We regressed the alignment score of the synthetic T domains of the indigoidine synthase with the rates from the respective best fit. The score was calculated by pairwise multiple sequence alignment of the amino acid sequences of the synthetic T domains with the native T domain of the indigoidine synthase as a template. The parameter values were obtained from parameter estimations of our mathematical model that has been calibrated with experimental data as described above. Linear regression of the alignment score on ksyn did only result in a coefficient of correlation of 0.48 while kdim correlated rather well (R2=0.97). This pinpointed the possibility to engineer T domains of NRPSs to optimize kinetic rates in silico for peptide production.
Conclusion and Outlook
We set up a mathematical model for bacterial indigoidine production to showcase the systematic scrutinization of NRP synthesis kinetics. In the course of model calibration with experimental data we could already falsify the hypothesis that indigoidine had an inhibitory effect on growth of the bacteria. The model with such inhibitory terms was not able to describe the experimental data. A reduced model was proven to be fully identifiable via a profile likelihood approach and simulations could reproduce experimental findings. The impact of the different rates on indigoidine production was investigated via sensitivity analysis. We can conclude that yield could be increased when peptide stability is improved and synthesis efficiency is advanced. Linear regression suggests that the dimerization rate of indigoidine could be engineered by editing the T domain sequence. With this, we have learnt valuable lessons on optimizing production of synthetic peptides in silico. Of course, dependency of yield on kinetic parameters does not necessarily scale linearly with peptide length but with these initial trials the way is paved for further analysis.
1. Brachmann, Alexander O, Kirchner, Ferdinand, Kegler, Carsten, Kinski, Sebastian C, Schmitt, Imke, Bode, Helge B: Triggering the production of the cryptic blue pigment indigoidine from Photorhabdus luminescens., J. Biotechnol. 157(1), 96–9, January 2012
2. Klipp, Edda, Liebermeister, Wolfram: Mathematical modeling of intracellular signaling pathways., BMC Neurosci 7 Suppl 1, S10, 2006
3. Pruitt, Kenneth M., Kamau, David N.: Mathematical models of bacterial growth, inhibition and death under combined stress conditions, Journal of Industrial Microbiology 12(3-5), Springer, 221, 1993
4. Raue, Andreas, Schilling, Marcel, Bachmann, Julie, Matteson, Andrew, Schelke, Max, Kaschek, Daniel, Hug, Sabine, Kreutz, Clemens, Harms, Brian D, Theis, Fabian J, Klingmüller, Ursula, Timmer, Jens: Lessons learned from quantitative dynamical modeling in systems biology., PLoS ONE 8(9), e74335, 2013
5. Raue, A, Becker, V, Klingmüller, U, Timmer, J: Identifiability and observability analysis for experimental design in nonlinear dynamical models., Chaos 20(4), 045105, December 2010
6. Raue, A, Kreutz, C, Maiwald, T, Bachmann, J, Schilling, M, Klingmüller, U, Timmer, J: Structural and practical identifiability analysis of partially observed dynamical models by exploiting the profile likelihood., Bioinformatics 25(15), 1923–9, August 2009
7. Owen, Art B.: A Central Limit Theorem for Latin Hypercube Sampling, Journal of the Royal Statistical Society. Series B (Methodological) 54(2), Wiley for the Royal Statistical Society, 541–551, 1992
8. Zi, Zhike, Zheng, Yanan, Rundell, Ann E, Klipp, Edda: SBML-SAT: a systems biology markup language (SBML) based sensitivity analysis tool., BMC Bioinformatics 9, 342, 2008
9. Gokhale, R S, Tsuji, S Y, Cane, D E, Khosla, C: Dissecting and exploiting intermodular communication in polyketide synthases., Science 284(5413), 482–5, April 1999
