Team:NTU-Taida/Result/Flow Cytometry
From 2013.igem.org
(Created page with "{{:Team:NTU-Taida/Templates/Header}}{{:Team:NTU-Taida/Templates/Navbar}}{{:Team:NTU-Taida/Templates/Sidebar|Title=Flow cytometry}}{{:Team:NTU-Taida/Templates/ContentStart}} ==Fl...") |
(→Flow cytometry) |
||
| Line 3: | Line 3: | ||
==Flow cytometry== | ==Flow cytometry== | ||
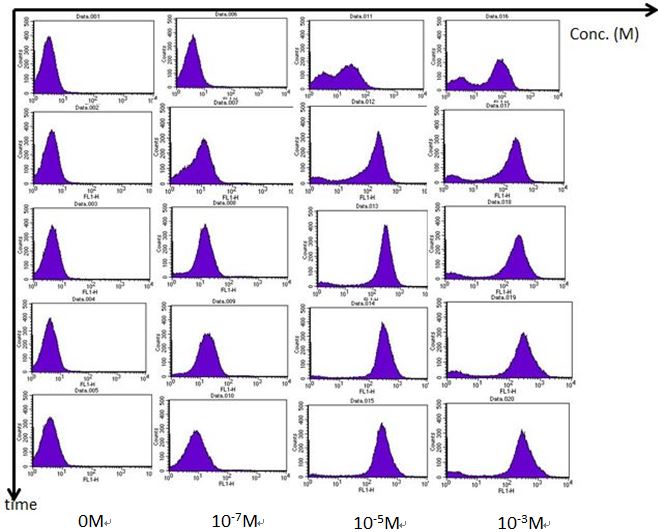
| - | In order to understand the “actual” bacterial fluorescence expression during each time point, we use flow | + | In order to understand the “actual” bacterial fluorescence expression during each time point, we use flow cytometry to detect individual fluorescence. Most of the modeling in igem are singal cell determine models, which neglects the special effect. Therefore we used flow cytometry to see if our single cell model fits the actual fluorescence expression. We added AHL into the bacterial medium at different time points and then centrifuge the mixture to retrieve the bacteria. Bacteria is then suspended in PBS and tested in the flow cytometer. The results are as follows. |
A. We use Rhl biosensor BBa_K575024 to test the results of different C-4 AHL concentration response. During higher AHL concentration, fluorescence fits the single cell model of bimodel distribution. Compared to ELISA plate reader, the fluorescence is significantly strong within 2 hours, while it takes around 4 hours for ELISA plate reader to get clear results. | A. We use Rhl biosensor BBa_K575024 to test the results of different C-4 AHL concentration response. During higher AHL concentration, fluorescence fits the single cell model of bimodel distribution. Compared to ELISA plate reader, the fluorescence is significantly strong within 2 hours, while it takes around 4 hours for ELISA plate reader to get clear results. | ||
Revision as of 03:48, 28 September 2013
Flow cytometry
In order to understand the “actual” bacterial fluorescence expression during each time point, we use flow cytometry to detect individual fluorescence. Most of the modeling in igem are singal cell determine models, which neglects the special effect. Therefore we used flow cytometry to see if our single cell model fits the actual fluorescence expression. We added AHL into the bacterial medium at different time points and then centrifuge the mixture to retrieve the bacteria. Bacteria is then suspended in PBS and tested in the flow cytometer. The results are as follows.
A. We use Rhl biosensor BBa_K575024 to test the results of different C-4 AHL concentration response. During higher AHL concentration, fluorescence fits the single cell model of bimodel distribution. Compared to ELISA plate reader, the fluorescence is significantly strong within 2 hours, while it takes around 4 hours for ELISA plate reader to get clear results.
B. We use the Rhl biosensor without positive feedback with mCherry reporter to test the results of different C-4 AHL concentration response.
C. We tested the Rhl receptor positive control circuit qualitatively to see if there is significant response of fluorescence. The results fits the biomodel distribution.
 "
"


