Team:Heidelberg/Tyrocidine
From 2013.igem.org
| Line 343: | Line 343: | ||
<li class="active"><a href="#a14" data-toggle="tab">Overview</a></li> | <li class="active"><a href="#a14" data-toggle="tab">Overview</a></li> | ||
<li><a href="#b14" data-toggle="tab">Module Shuffling</a></li> | <li><a href="#b14" data-toggle="tab">Module Shuffling</a></li> | ||
| - | + | ||
| - | + | ||
| - | + | ||
| Line 366: | Line 364: | ||
</p> | </p> | ||
</div> | </div> | ||
| - | + | ||
| - | + | ||
| - | + | ||
| - | + | ||
| - | + | ||
| - | + | ||
| - | + | ||
| - | + | ||
| - | + | ||
| - | + | ||
| - | + | ||
| - | + | ||
| - | + | ||
Revision as of 16:36, 4 October 2013


Tyrocidine. Proving Modularity of NRPS by Shuffling Modules.
Lorem ipsum dolor sit amet, consetetur sadipscing elitr, sed diam nonumy eirmod tempor invidunt ut labore et dolore magna aliquyam erat, sed diam voluptua. At vero eos et accusam et justo duo dolores et ea rebum. Stet clita kasd gubergren, no sea takimata sanctus est Lorem ipsum dolor sit amet.
Week 12
Module Shuffling
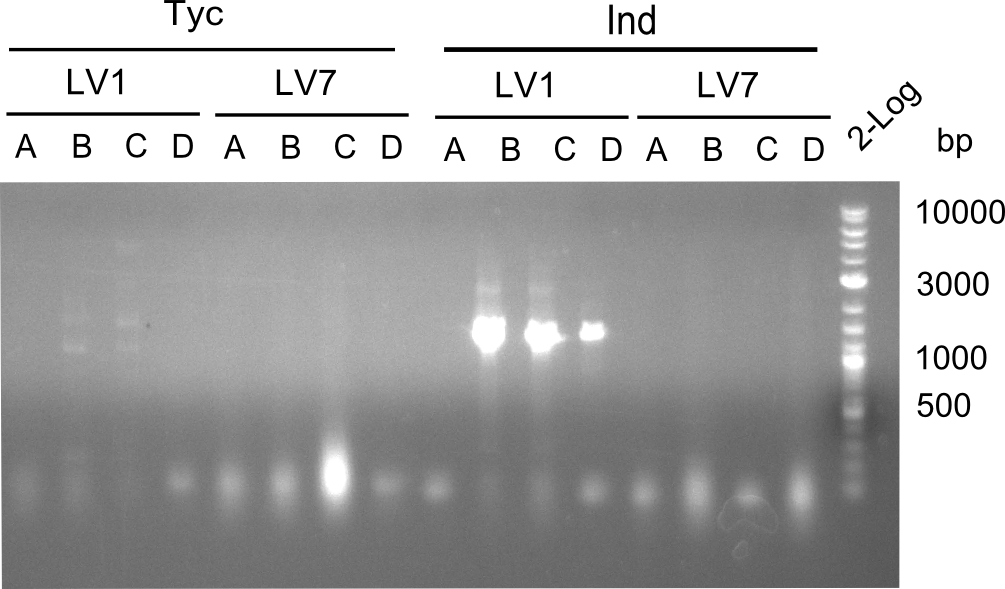
Our strain Brevibacillus Parabrevis arrived from the Marahiel-lab. As preparation for the module shuffling experiments the strain was validated with test primers by colony PCR. The screening was positive, so we designed our Gibson compatible primers for amplification.
Week 13
Module Shuffling
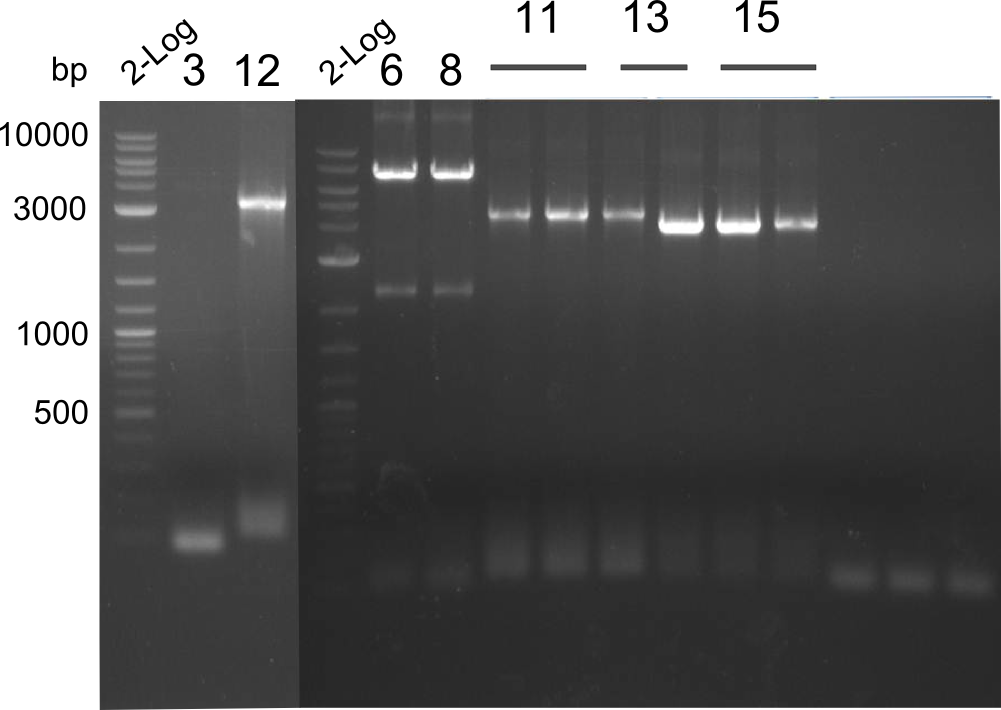
We started with the amplification of fragments for the module shuffling with Gibson Primers. Most fragments were amplified in the first attempt, however others needed protocol optimization. At the end of the week 12 out of 15 fragments were successfully amplified. The next step to take, is to amplify the remaining fragments and start with the Gibson Assembly.
Week 14
Module Shuffling
After DNA concentration measurements, some of the previously amplified fragments had to be reamplified. The PCR protocols were optimized and the missing fragments were successfully obtained. We amplified all fragments with the necessary concentration to start with the Gibson assembly. However we noticed that we mixed up fragments during the assembly of Tripeptide-I-NRPS (pIK04)and resumed this experiment in the next week.
Week 15
Module Shuffling
The DNA concentration for all obtained fragments were measured and used for the calculation of the Gibson Assembly master mix. All five NRPS constructs producing the Dipeptide, Tripeptides I & II and Tetrapeptides I & II were assembled into a pSB1C3 backbone, electroporated into DH10β and spread on Chloramphenicol-LB plates. Several white colonies were picked and grown in 2x YT medium. Their mini-preps where validated through restriction digest. Positive samples were sent to sequencing. The results arrived in week 16.
For the detection of the short synthetic NRPs we decided on using Mass Spectrometry (MS) and contacted a MS facility on campus.
Week 16
Module Shuffling
Sequencing proved the successful assembly of the Tripeptide-I-NRPS (pIK04). All other NRPs had to be reconstructed through a new Gibson Assembly. For this purpose, we optimized the Gibson Assembly master mix, assuming that backbone religations were one of the main reasons for the failed assembly. We calculated a lower backbone-to-insert ratio and added fragment 12 in excess to the Tetrapeptide-I-fragment-mix. The assembled plasmids were transformed into electrocompetent DH10β and plated onto Cm-Lb. Afterwards white colonies were picked and grown overnight in 2x YT medium (Cm).
Their mini-preps were analyzed with restriction digest. Two samples of each the Dipeptide (pIK03) and the Tetrapeptide-I (pPW01) plasmids were sent to sequencing. There was no positive restriction digest, neither for the Tetrapeptide-I-NRPS (pPW01) nor for Tetrapeptide-II-NRPS (pPW02). We decided not to reassemble the Tetrapeptide-II-construct (pPW02) and did not continue working on this NRP. Hence only colonies on the Tetrapeptide-I-construct (pPW01) plates were picked.
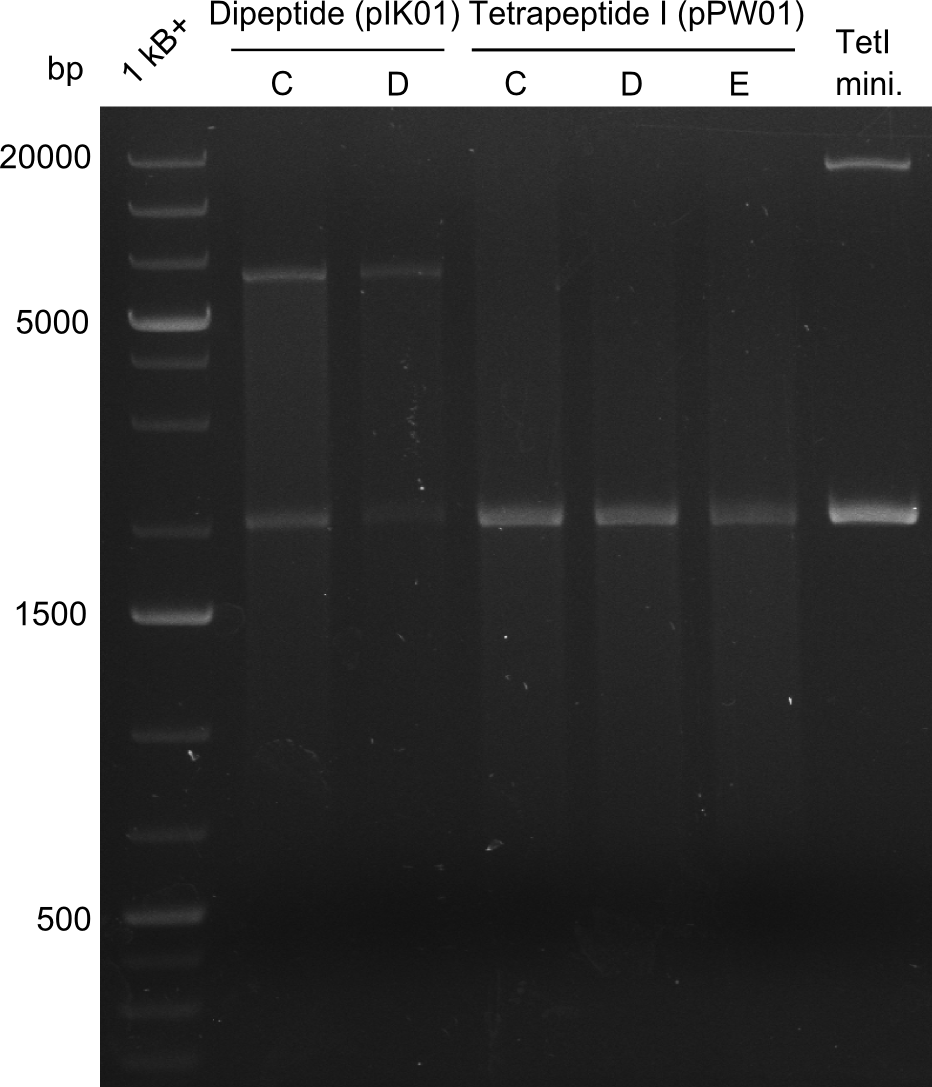
The positive Dipeptide- (pIK03), Tripeptide-I (pIK04) and Tetrapeptide-I (pPW01) NRPS constructs were chemically transformed into BAP I cells and plated onto Cm-LB. Furthermore colonies were picked and validated through restriction digest. Here only pIK03 (Dipeptide) and pIK04 (Tripeptide-I) were positive. The Tetrapeptide-I-NRPS (pPW01) was chemically transformed a second time into BAP I.
Interspecies
Module Shuffling
The primers for the interspecies NRPS fusion of different Tyrocidine modules with the Indigoidine synthetase indC were designed and ordered.
BioBrick Assembly
For the standardization of the modules from the Tyrocidine cluster used in the shuffling we started amplification with the previously ordered Primers for Modules tycAdCom, tycB1dCom, tycC5, tycC6 introducing the RFC10 prefix and suffix. However, errors in the reverse Primers for tycC5 and tycC6 were noticed and re-ordered. Still the amplification of modules tycAdCom and tycB1dCom was started, but could not be amplified in the necessary concentrations.
Week 17
Module Shuffling
Validation and characterization of BAP I cells transformed with the Dipeptide- (pIK03), Tripeptide-I- (pIK04) and Tetrapeptide-I-synthetase (pPW01) constructs through restriction digest. The pIK03 and pIK04 were positive and sent to sequencing.
The restriction digest for pPW01 was negative. I a new strategy it was therefore co-transformed with a plasmid (pRB15) carrying the PPTase sfp into electrocompetent DH10β. Again the restriction digest was negative and we decided to abandon this construct assuming it was too big for simple transformation.
For the Mass Spectrometry (MS) we needed to find a clone strongly expressing the NRPS. Therefore we performed a SDS-PAGE, which failed due to systematic errors. This was resumed the following week.
Interspecies
Module Shuffling
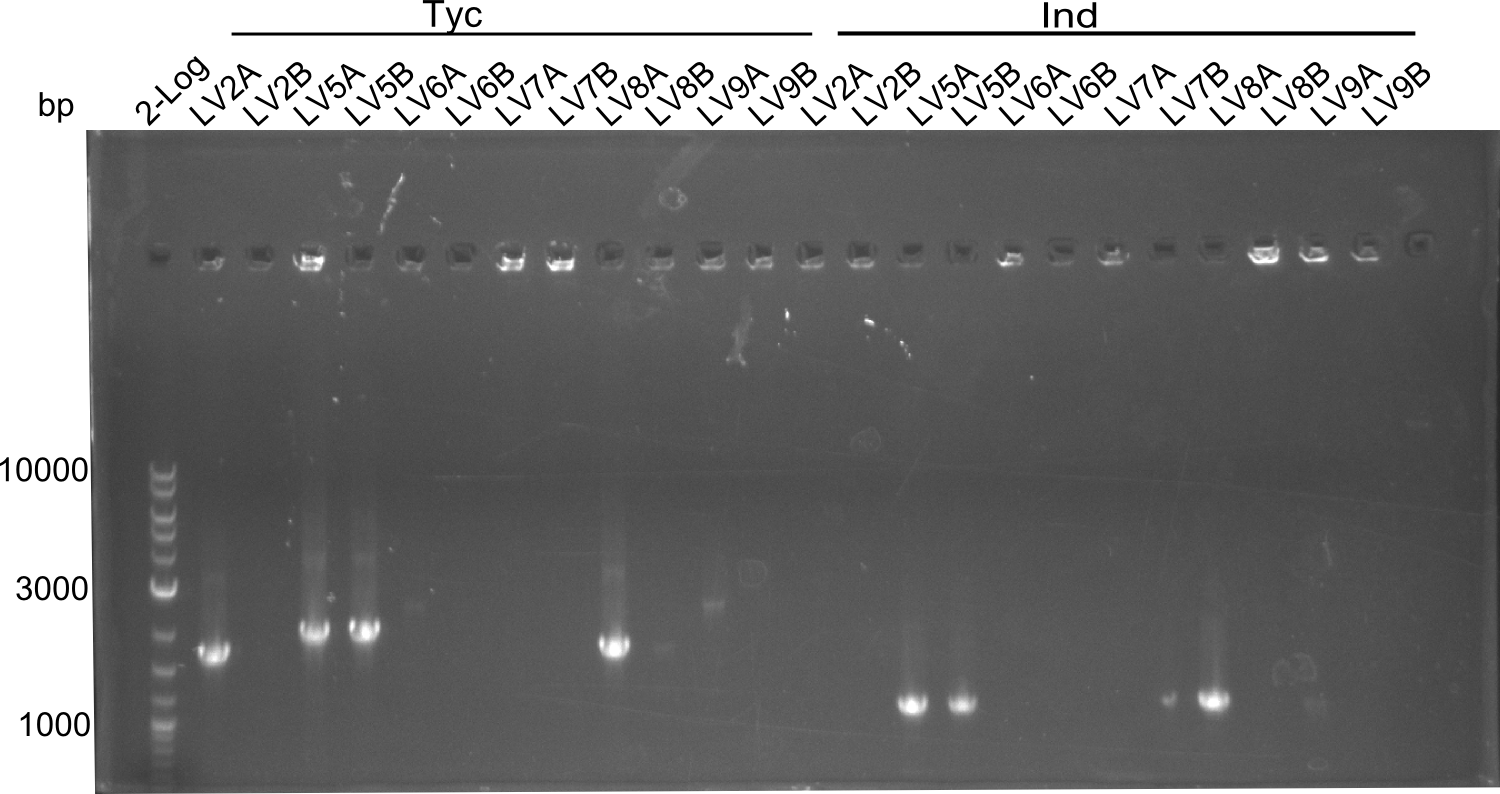
The experiments concerning the synthesis of the interspecies fusion of a Tyrocidine module and the Indigoigine synthetase were started with the amplification of the fragments needed for introduction of the three constructs (coding for Phe-/Asn-/Val-Ind-Synthetases) into their backbone pSB1C3 by Gibson Assembly. All of those fragments were obtained in the necessary concentrations after optimization of the protocols.
BioBrick Assembly
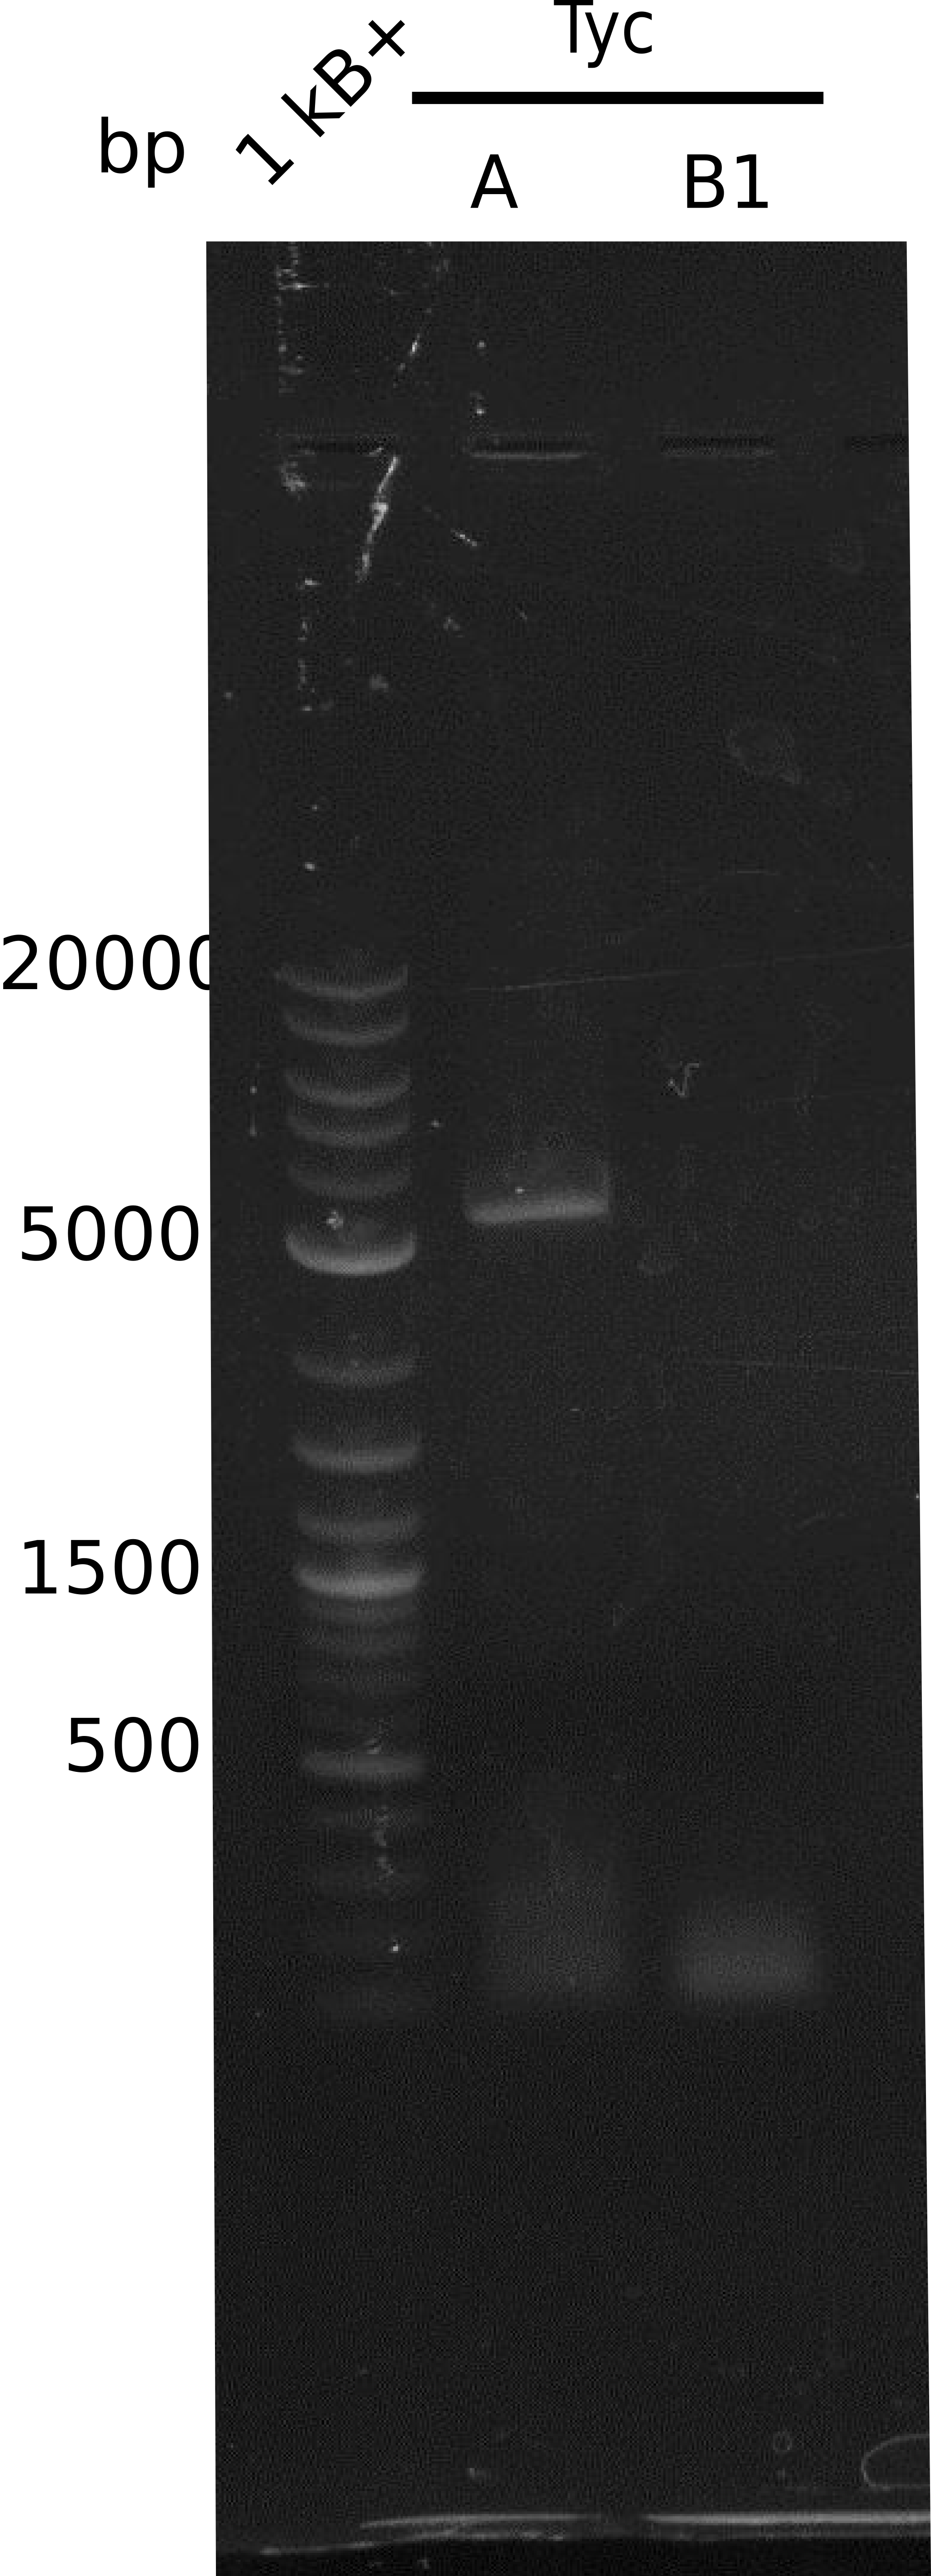
The RFC10 standardization of the modules still showed to be difficult due to the total length of prefix/suffix + binding sequence (resulting in high annealing temperatures). To be efficient, we focused on the optimization of the amplification protocol for tycAdCom. We succeeded and adapted our protocols in the same manner for the other modules. Again the amplification for tycB1 and tycC5 failed, however we were able to amplify the module tycC6. After many attempts we redesigned the primers for tycB1dCom (fw and rv) and tycC5 (fw).
Week 18
Module Shuffling
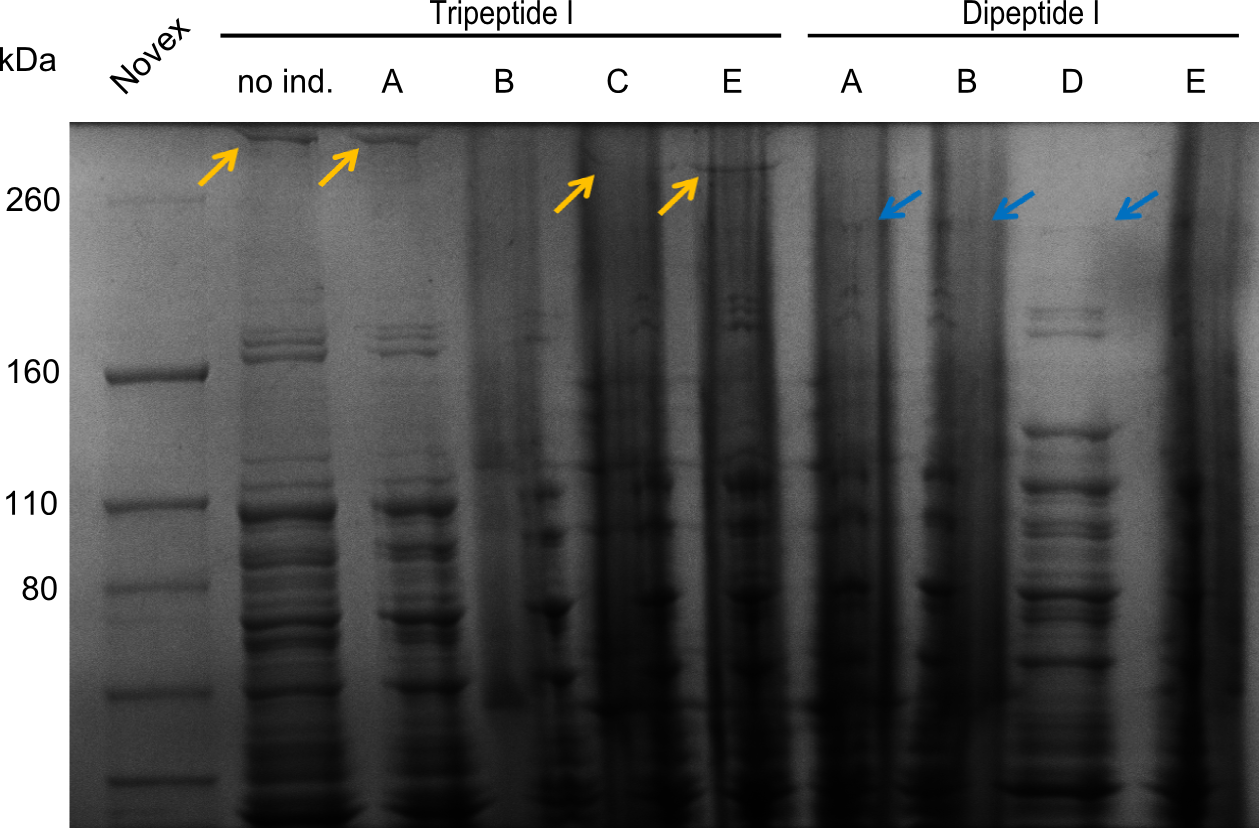
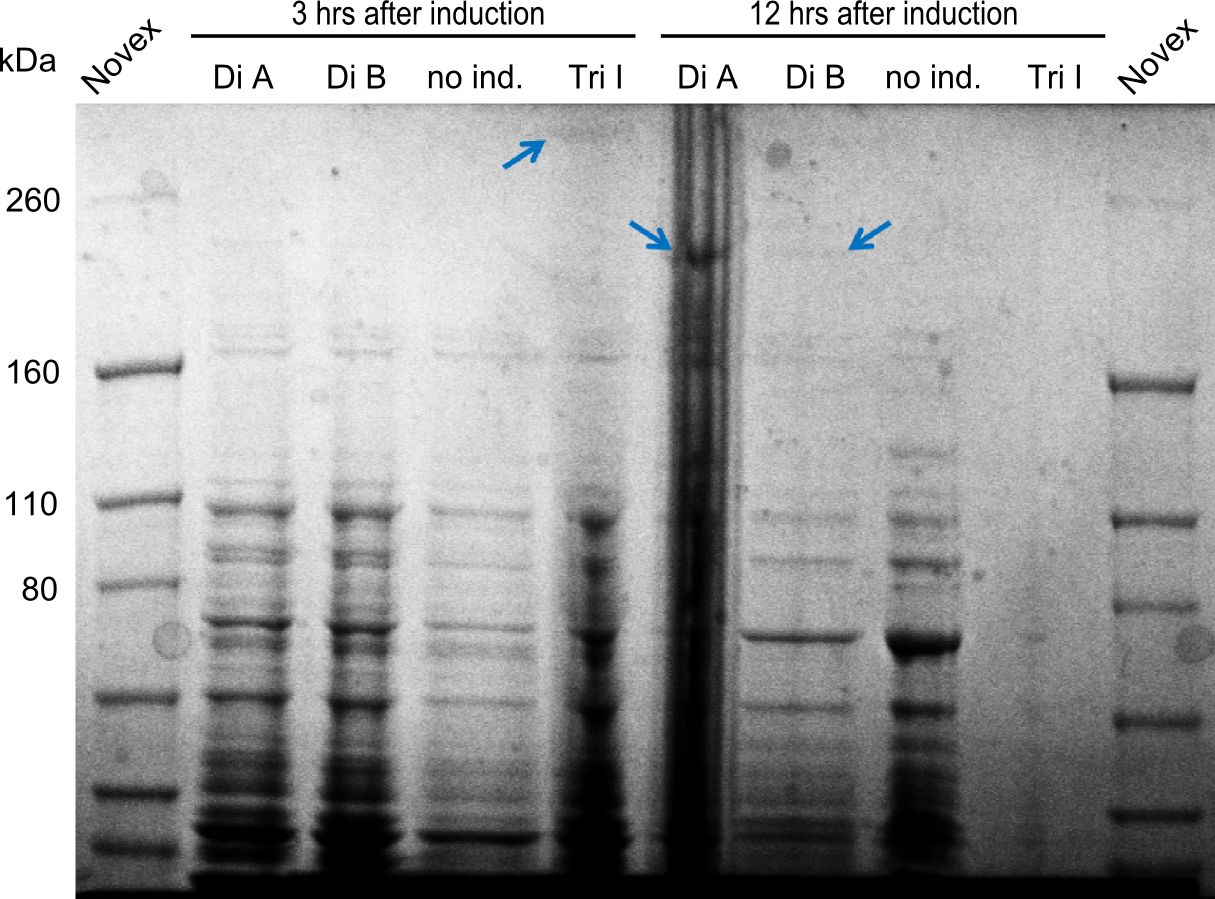
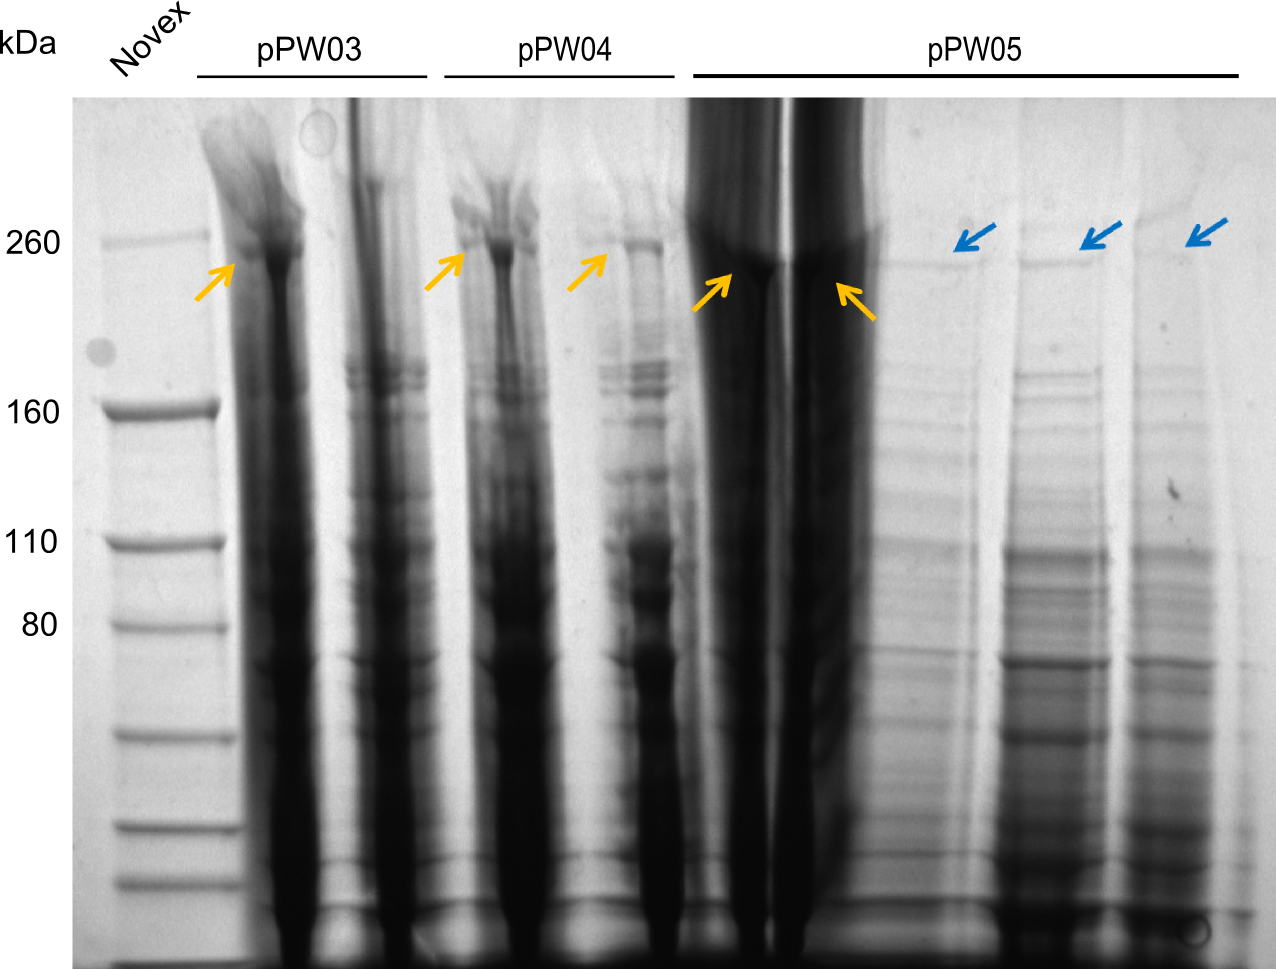
We started the week with a SDS-PAGE analyzing the expression capacity of several clones for the Dipeptide- and Tripeptide-I-NRPS. It showed a positive band for the Dipeptide synthetase (212 kDa) and an inconclusive band for the Tripeptide-I synthetase (381 kDa), because the top band of our ladder was at 260 kDa). Hence we interpreted this as a positive result for Tripeptide-I-synthetase as well.
Interspecies
Module Shuffling
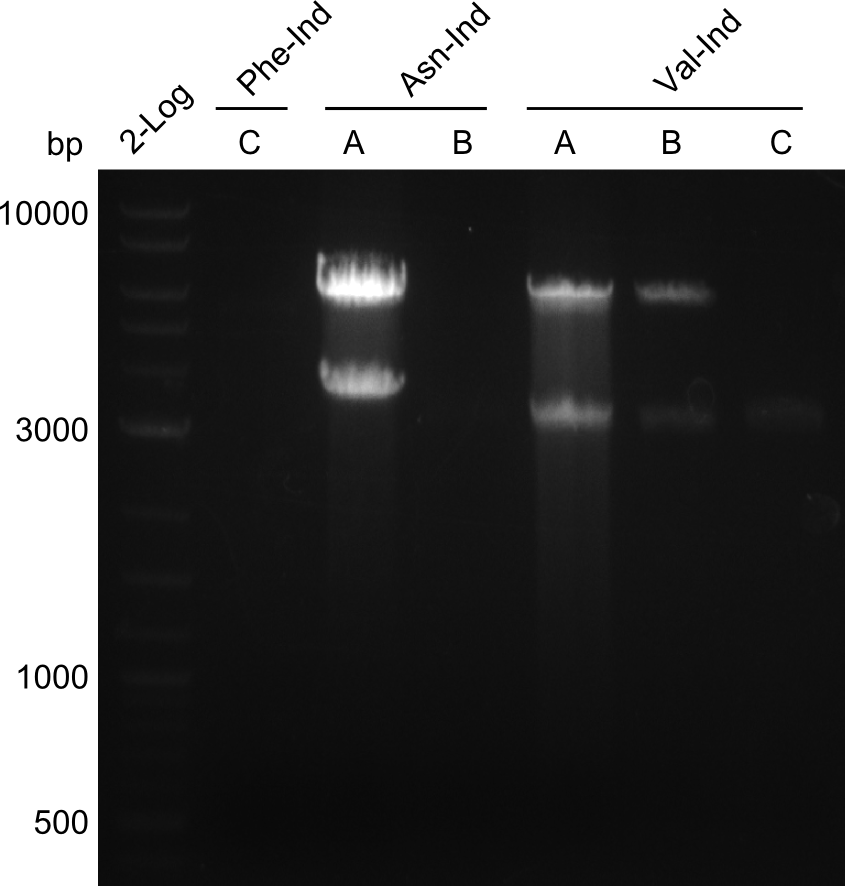
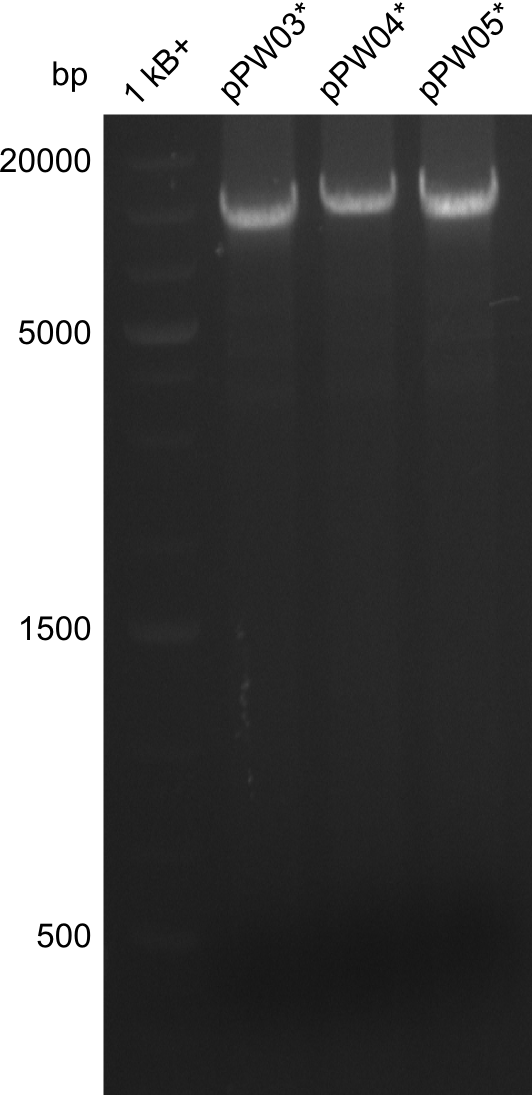
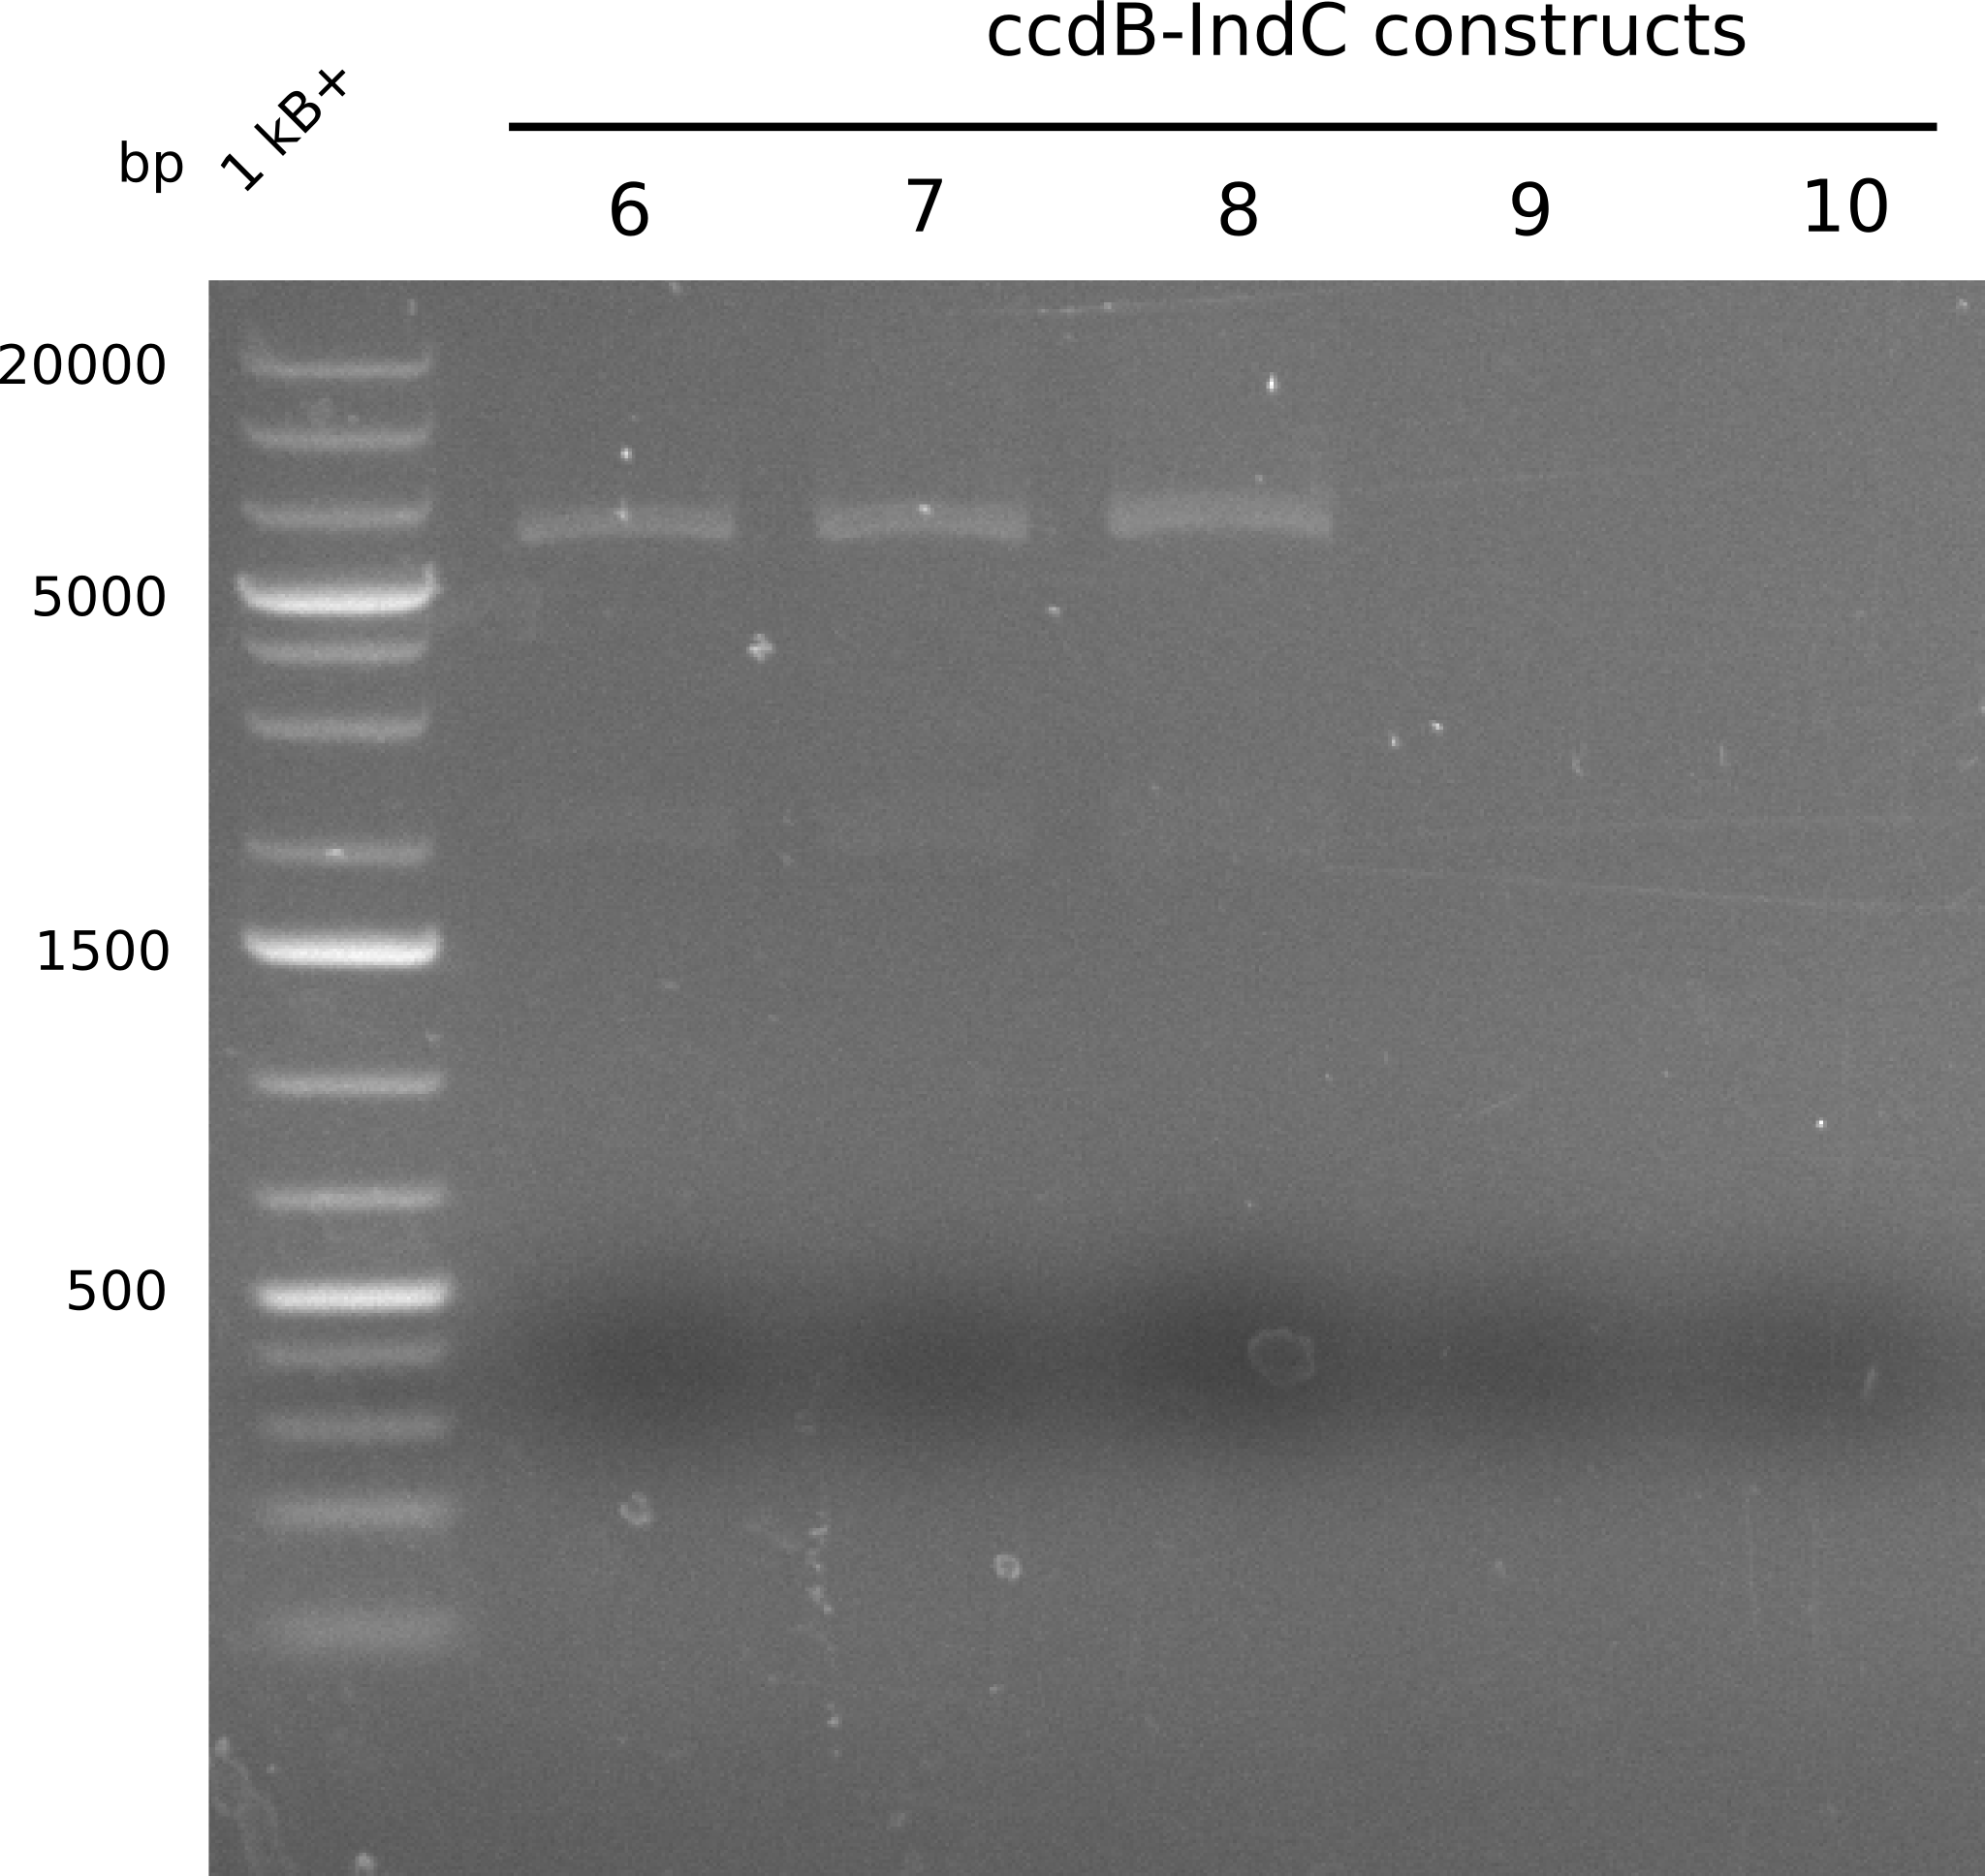
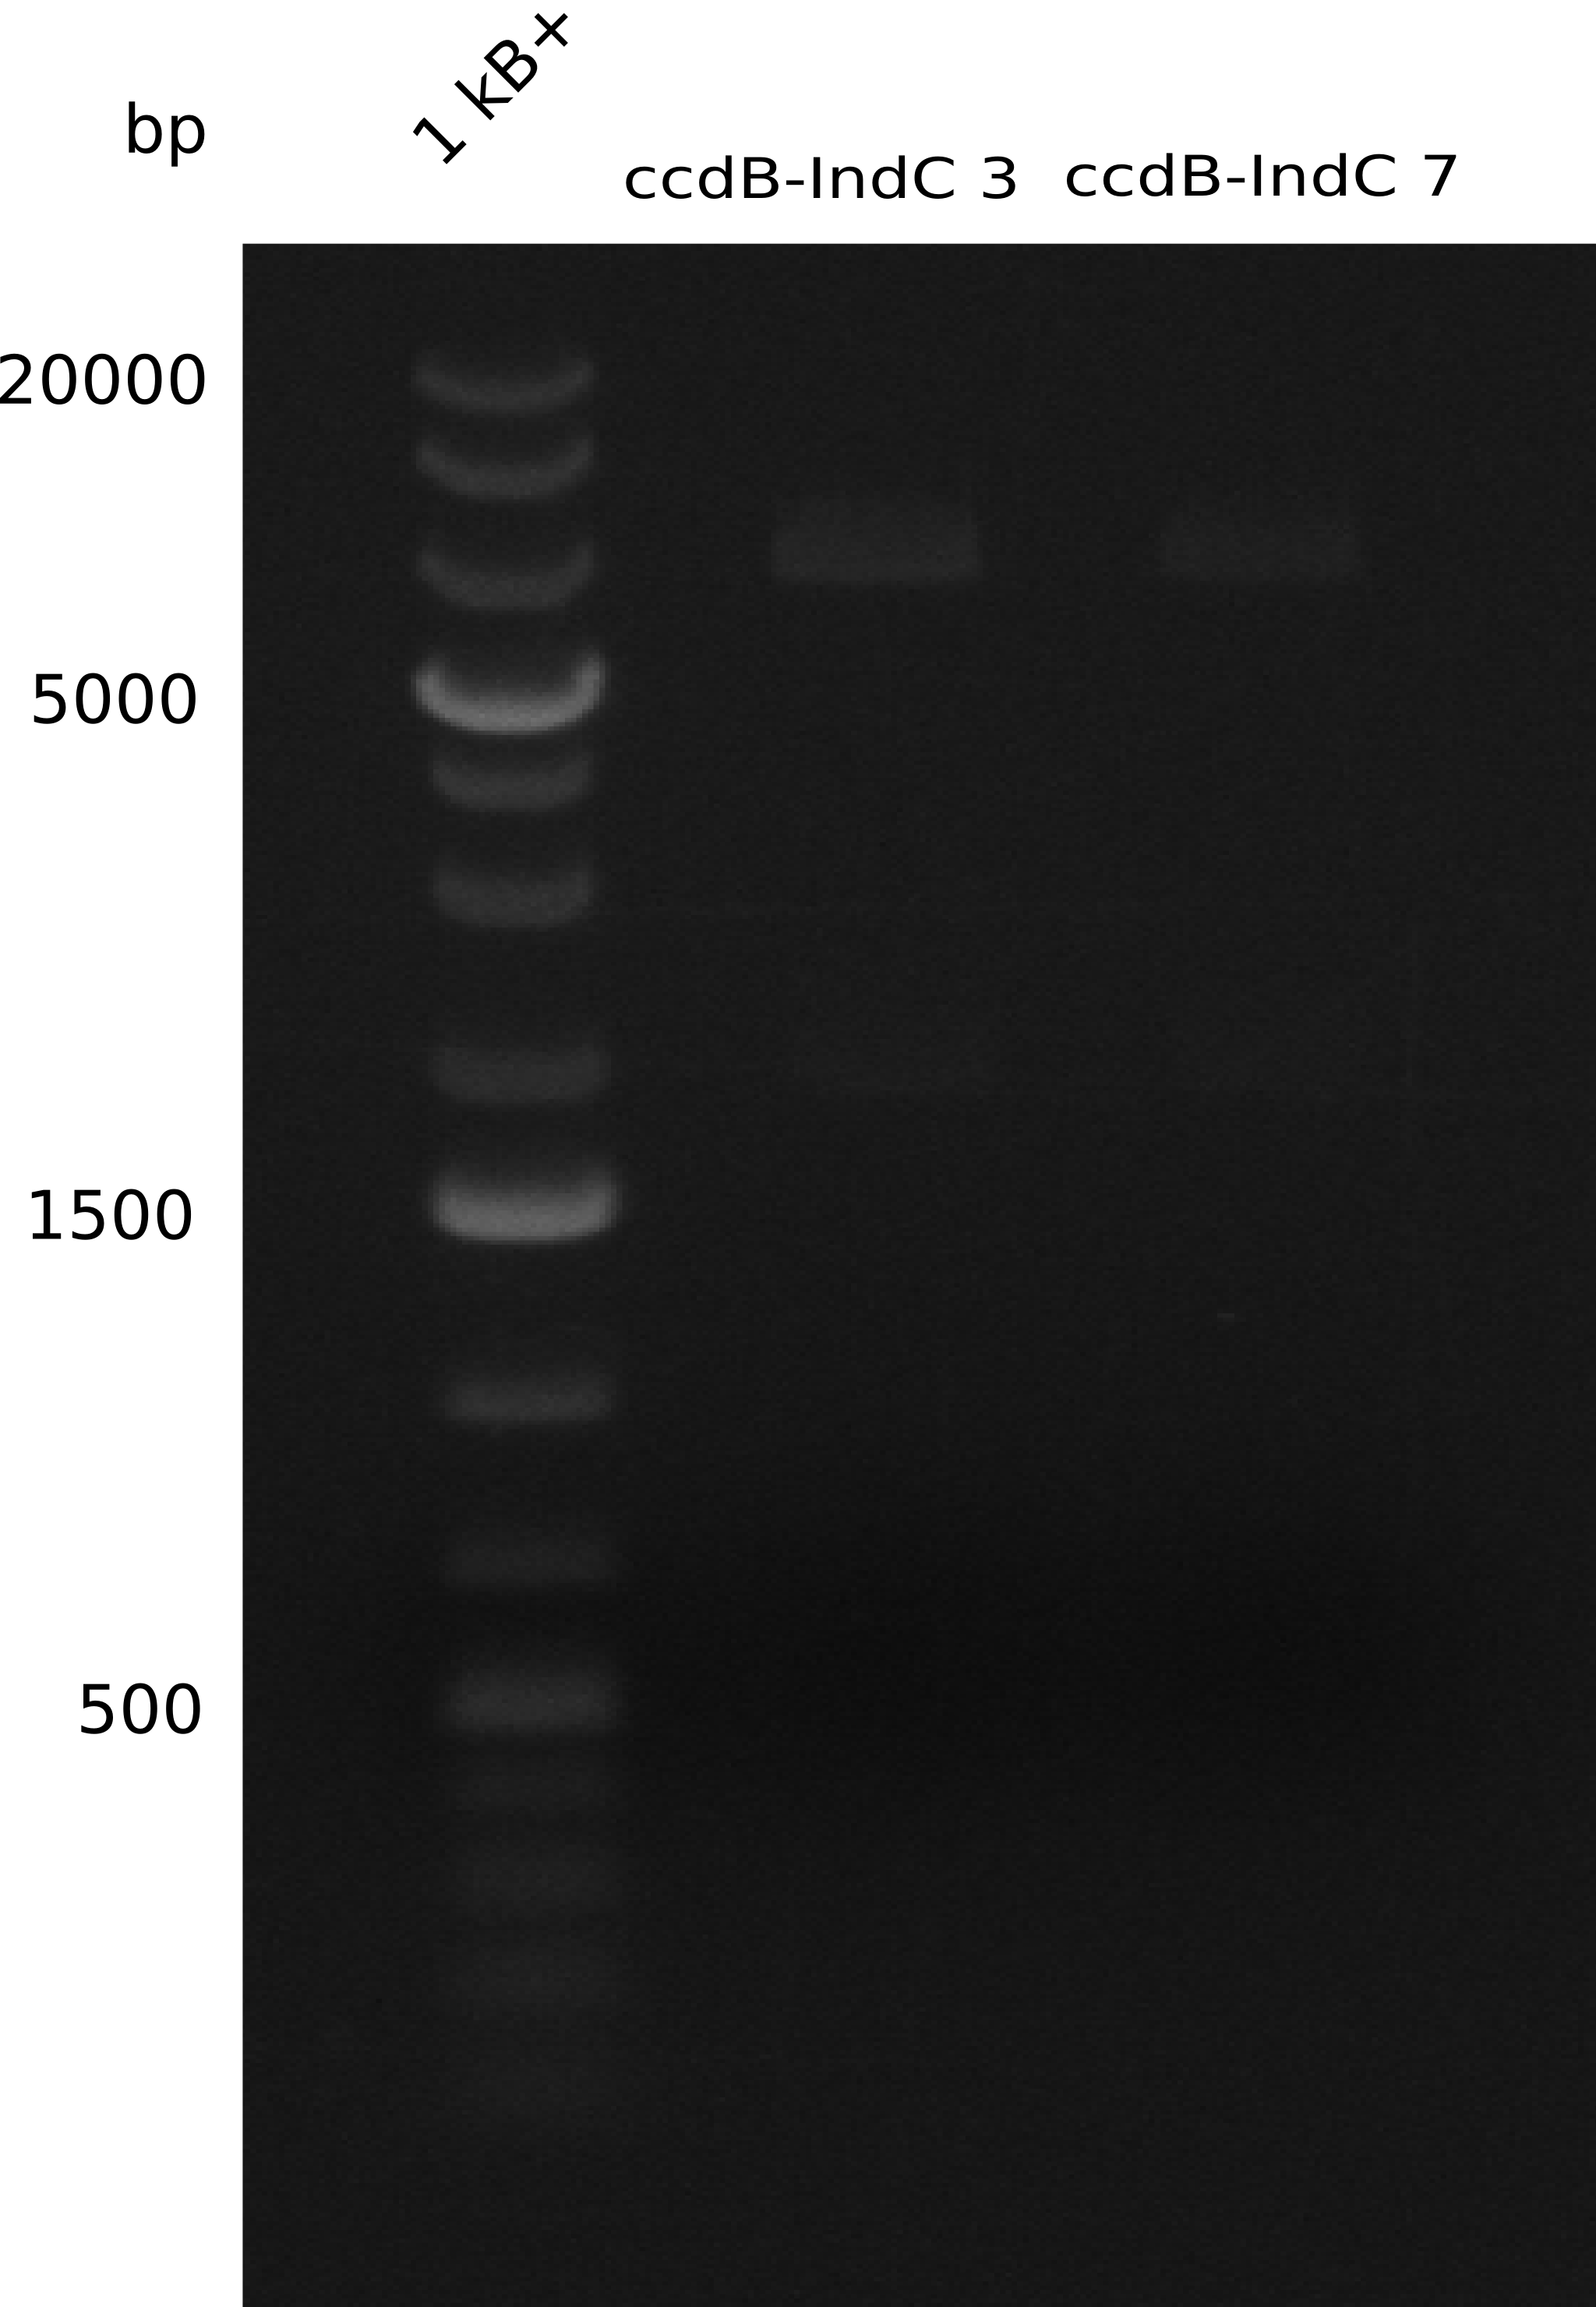
Our fusion experiment was continued for all three constructs with the Gibson Assembly into pSB1C3. The mix was electroporated into DH10β and plated onto Cm-LB. The analytical restriction digest of picked colonies was positive for all constructs. Selected samples of each were proven to be positive by sequencing. Thereafter, the constructs were chemically transformed into our expression strain BAPI and spread onto Cm-LB plates. The colonies turned blue after less than two days, indicating the expression of Indigoidine.
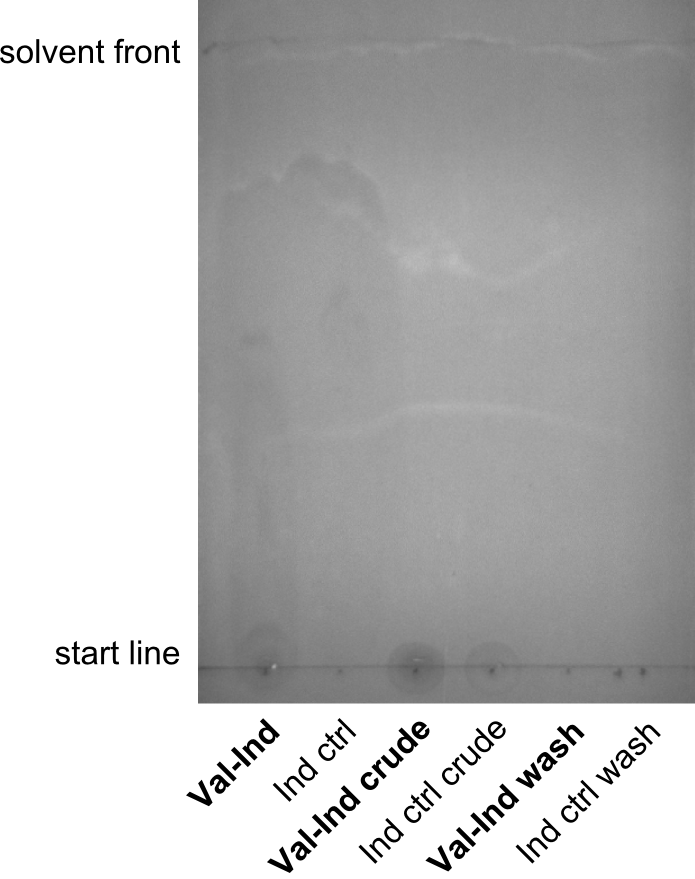
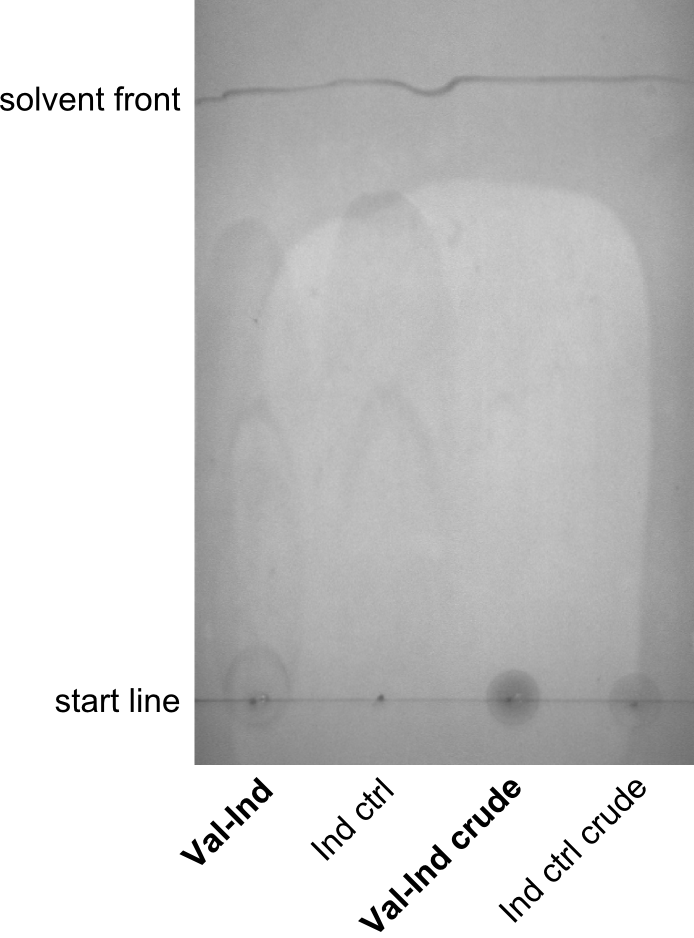
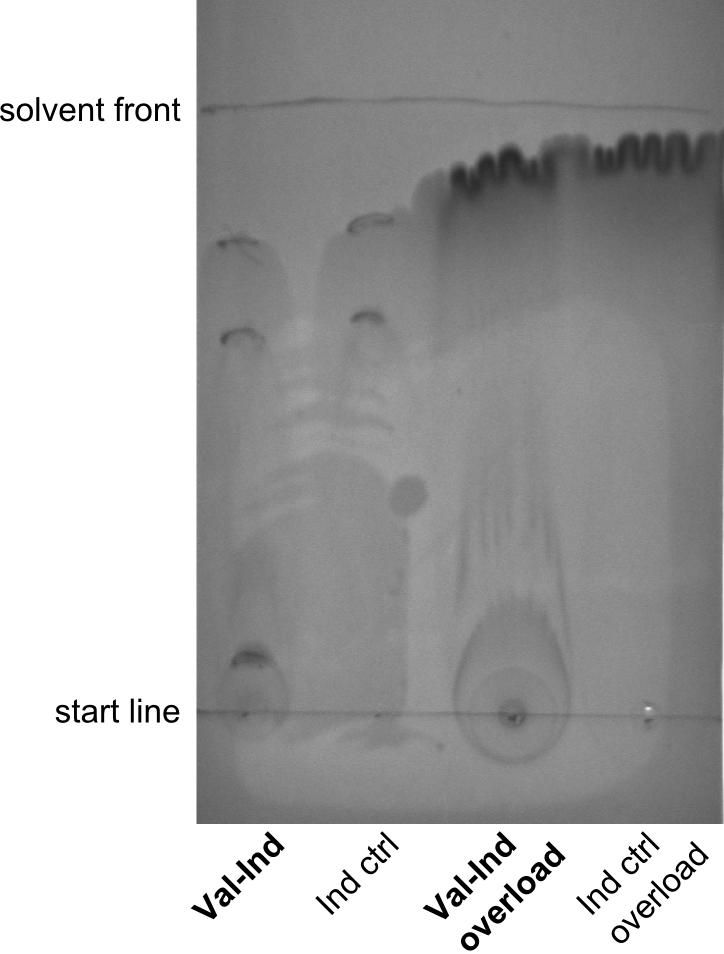
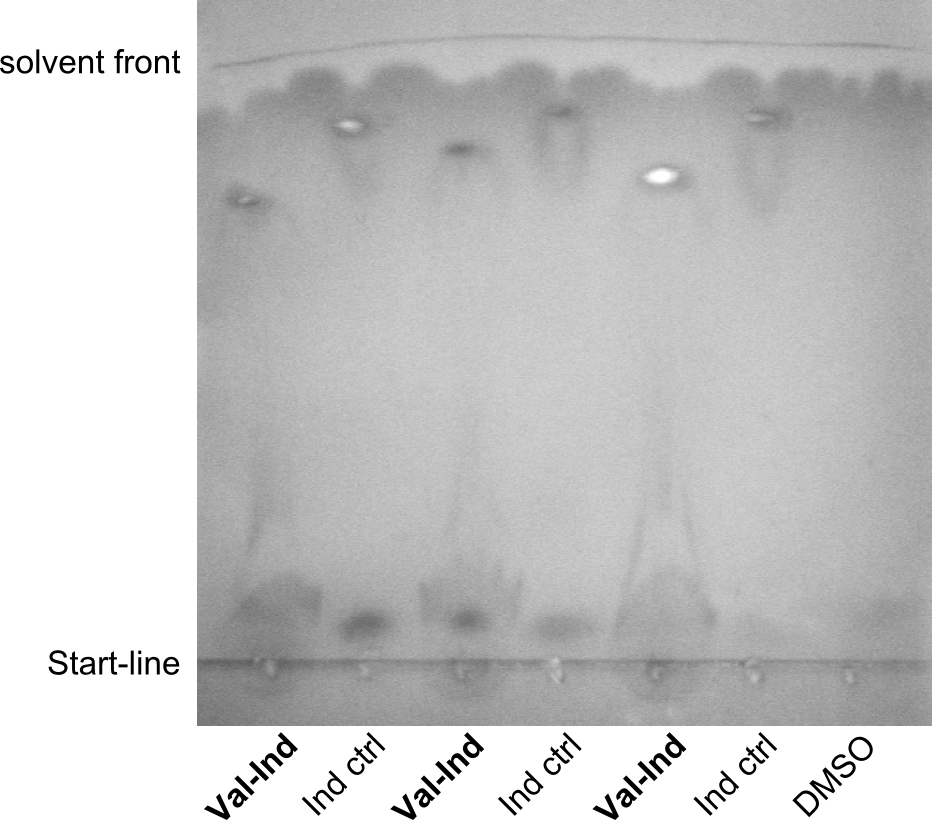
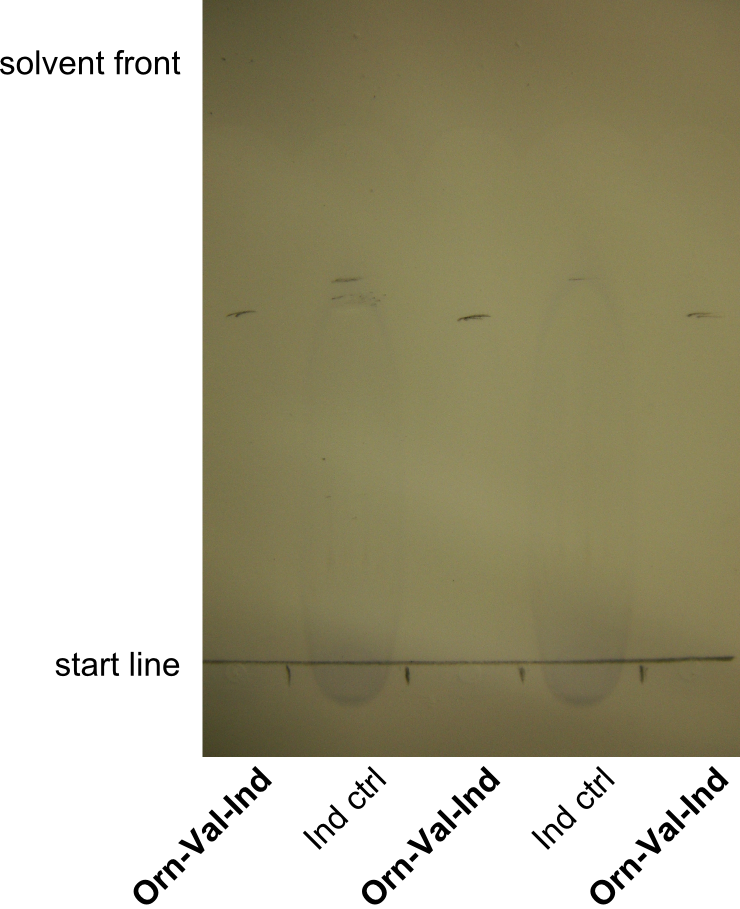
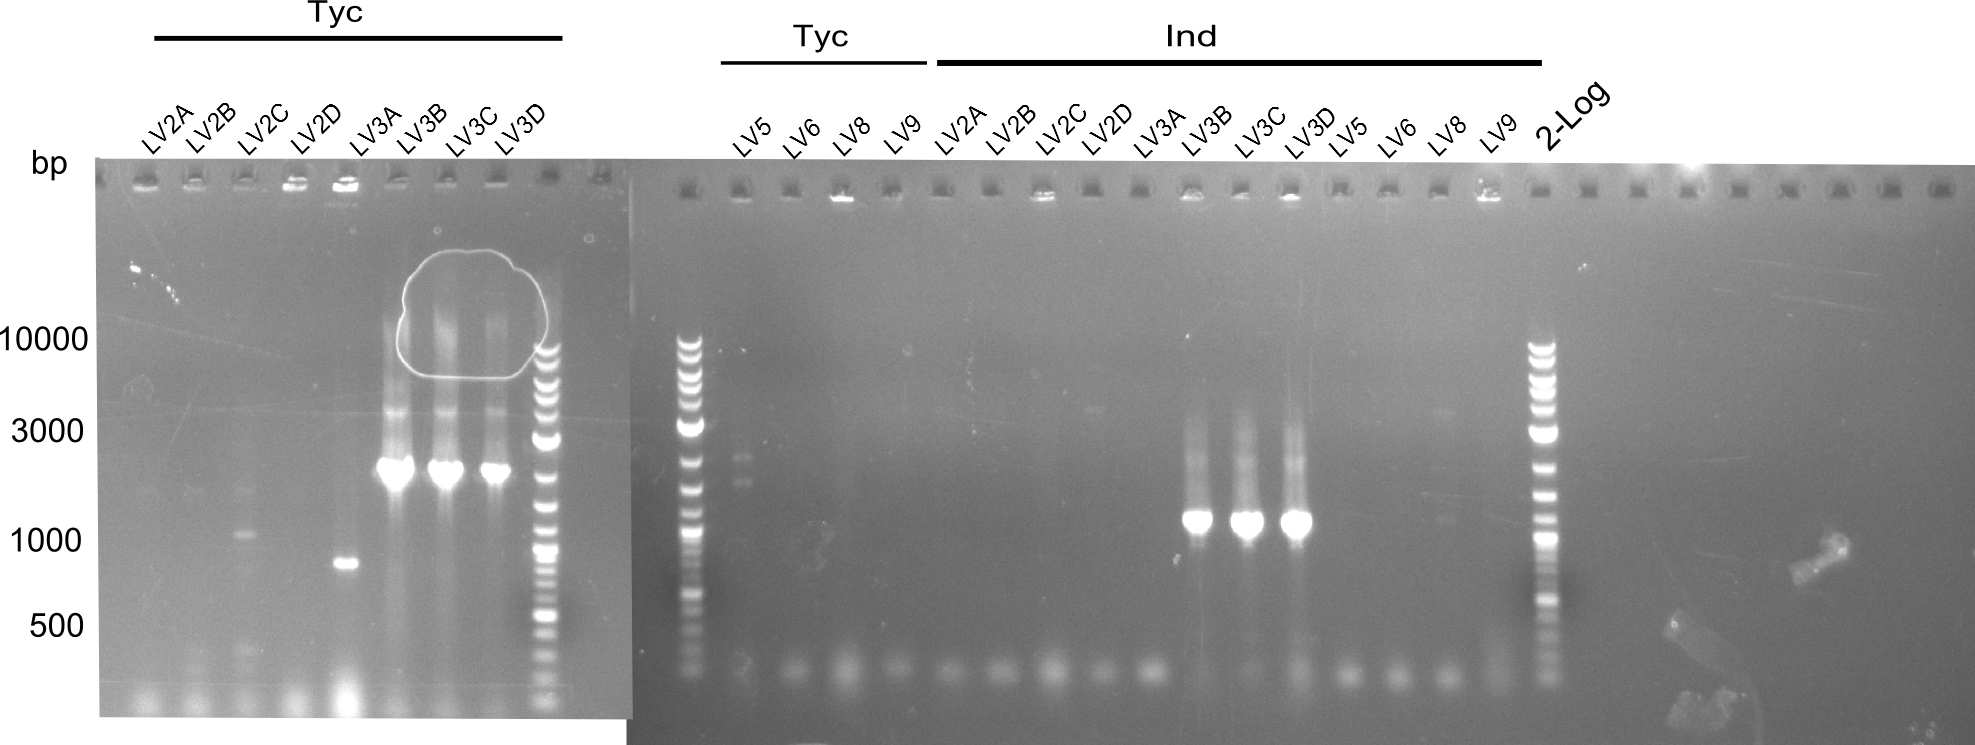
First a SDS-PAGE was executed showing that only the band for the Fusion NRPS producing Val-Ind was positive. For this clone purified Valine-Indigoidine from liquid culture was run next to native Indigoidine in a comparative TLC. Here it could be shown that the product from the Val-Ind-Synthetase runs slower than native Indigoidine. At this point it was already possible to assume that Indigoidine could be used to tag other NRP synthetase products by fusing it at the end of NRPS coding genes. To prove this assumption we designed a new strategy for the fusion of the indC to up to four Tyrocidine modules. For this experiment new Gibson Assembly compatible primers were designed and ordered.
BioBrick Assembly
New primers for the tycB1dCom and tycC5 modules arrived and new protocols led to the successful amplification of the fragments. A restriction digest with EcoRI and PstI was executed to linearize the backbone pSB1C3 and to prepare the fragments for ligation. The Ligation was performed with T4 Ligase and then transformed into TOP10 cells. White clones where screened with a colony PCR (VF2 and VR primers) and one positive sample for each RFC10 compatible module-construct was sent to sequencing.
Week 19
Module Shuffling
Two months after the start of the tyrocidine project and a lot of planning concerning the verifiability of the existence of small synthetic non-ribosomal peptides, the purification procedure for mass spectrometry was conducted. Since our backup strategies were rather complex, the simplest purification procedure was chosen to begin with. This procedure was performed in order to get a general idea of whether further desalting steps were needed. Purified samples were delievered to the neonate screening facility (tandem MS) at the university medical centre and the mass spectrometry facility at the Institute for Chemistry (HR-ESI MS).
After a first measurement with a tandem mass spectrometer (neonate screening facility) reasonable amino acid levels were observed, accounting for a well suited sample work up process. Therefore, samples of different constructs were taken at several time points after induction and delievered as well to assess time dependet expression.
BioBrick Assembly
Module Shuffling
For our RFC10 standardized modules we had to reamplify all fragments again and then prepared them by restriction digest with EcoRI and PstI for the standard Ligation. The standard shipment backbone pSB1C3 was linearized in this process. After Ligation with T4-Ligase and transformation into TOP10 cells white colonies were picked from the LB-Cm plates. The colonies were screened with VR and VF2 primers in a colony PCR. For each we could find a positive sample, of which we sent a sample to sequencing
Interspecies Module Shuffling
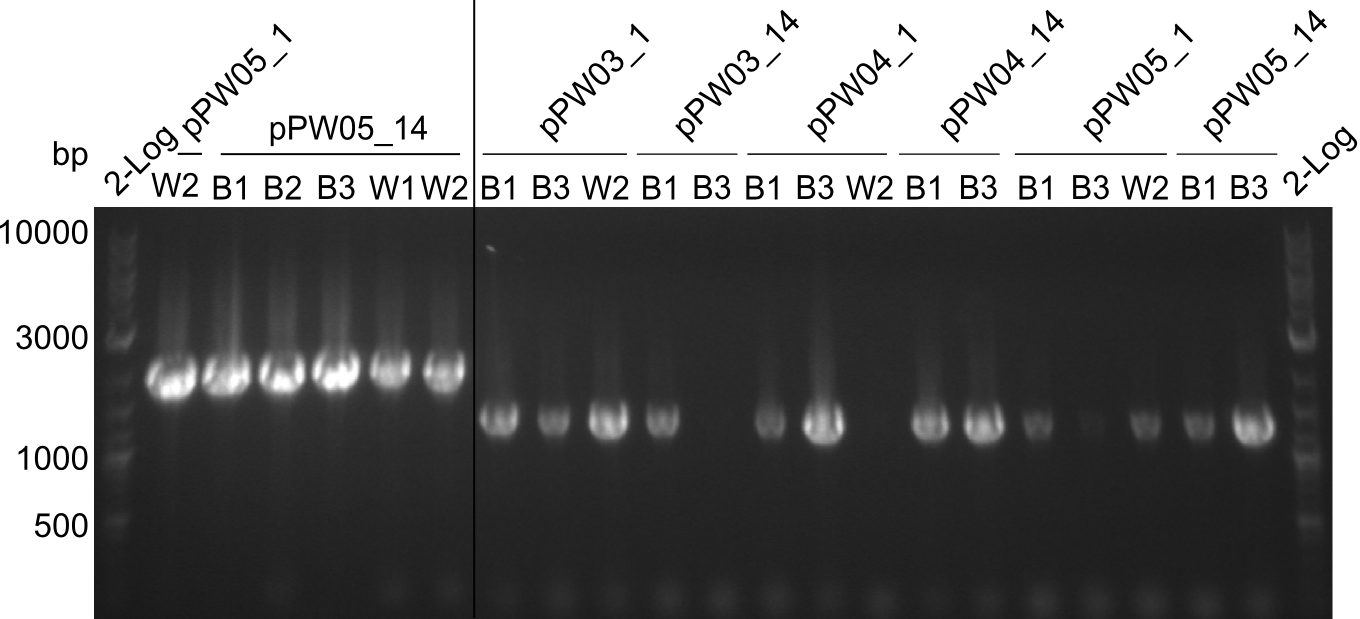
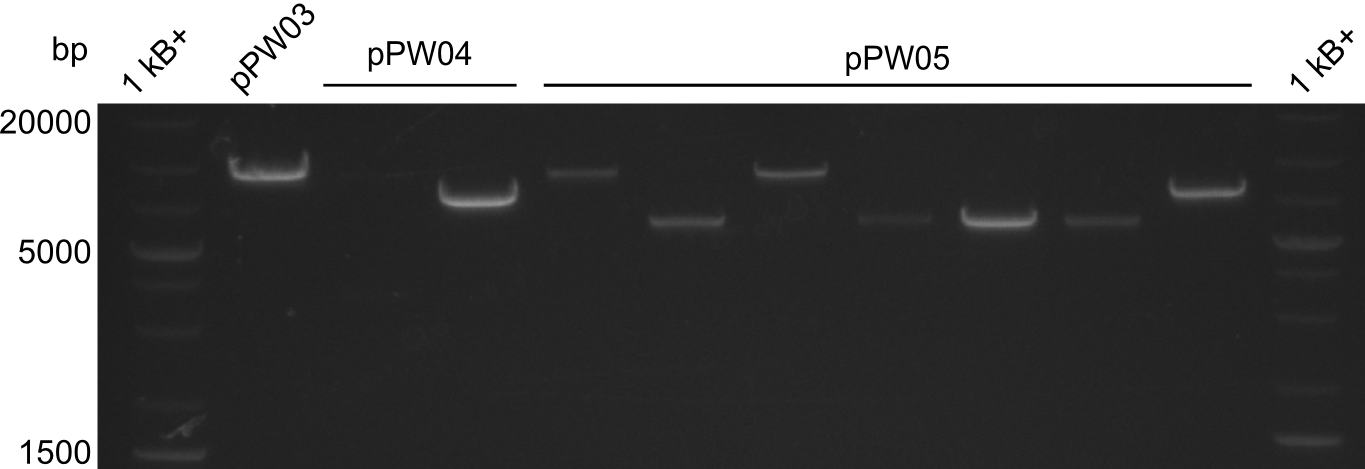
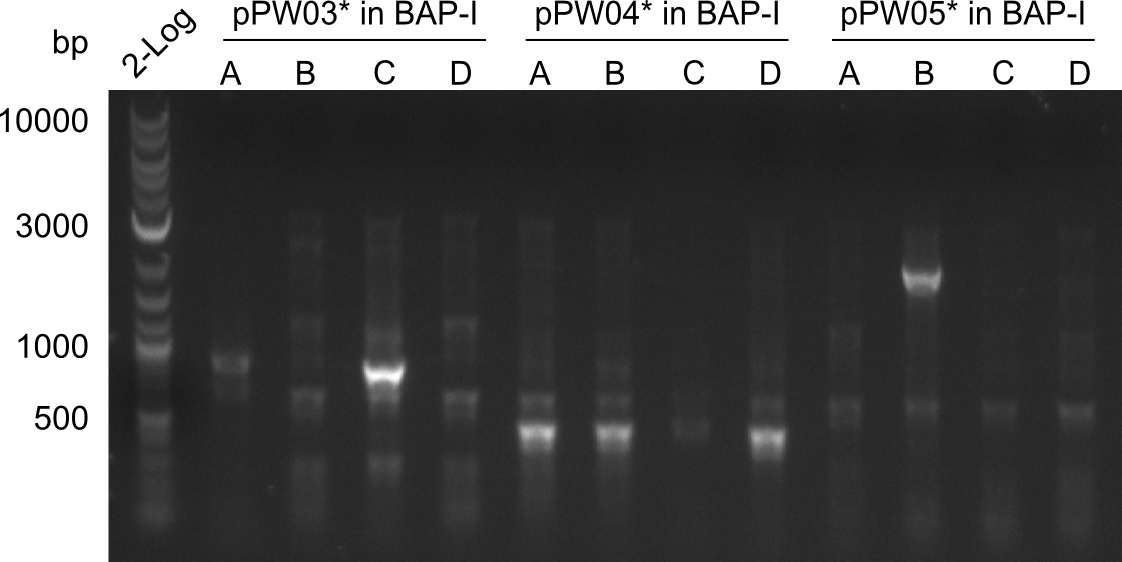
Since two illegal cutting sites of RFC-10 restriction enzymes were found, a CPEC approach was tried for the Asn-Indigoidine fusion (pPW04) to introduce a mutation at the targeted position. In the first instance this procedure did not result in visible colonies after transformation and is therefore planned to be repeated in the upcoming week.
Week 20
Module Shuffling
In this week we sent two samples to the mass spectrometry facility of the Institute for Chemistry on campus. We have been offered only a couple of free measurements, so we decided to send two pellet samples containing the Dipeptide (pIK03) and Tripeptide-I (pIK04). Even though we did not receive a conclusive spectrum we can be sure that the salt concentrations were low enough to not overlap the signals of our peptides. We assume that either the solvent or cell lysis debris could be the reason for the unspecific profile. We now want to test samples of the supernatant, as well.
BioBrick Assembly
Module Shuffling
The sequencing showed positive results for tycAdCom, tycB1dCom (silent mutations) and tycC6 (silent mutation). However the suspected tycC5 carying plasmid did NOT contain the right insert in the alignment. We tried to reamplify this fragment, however could not find the right protocol. We assume that, instead of tycC5, tycB1dCom (or similar) was the insert and that tycC5 was amplified with the same protocols as tycB1dCom because it was in fact tycB1dCom and not tycC5. Because of the amplification dificulties and the limited time we decided to cancel the standardization of tycC5.
We started the preparation of the positive plasmids for shipping to the parts-registry.
Interspecies Module Shuffling
With regard to the week before, the CPEC approach was resumed with a mutation at the desired position. In parallel as an alternative approach the indC fragment of the domain shuffling experiments was used.
Interspecies Module Shuffling
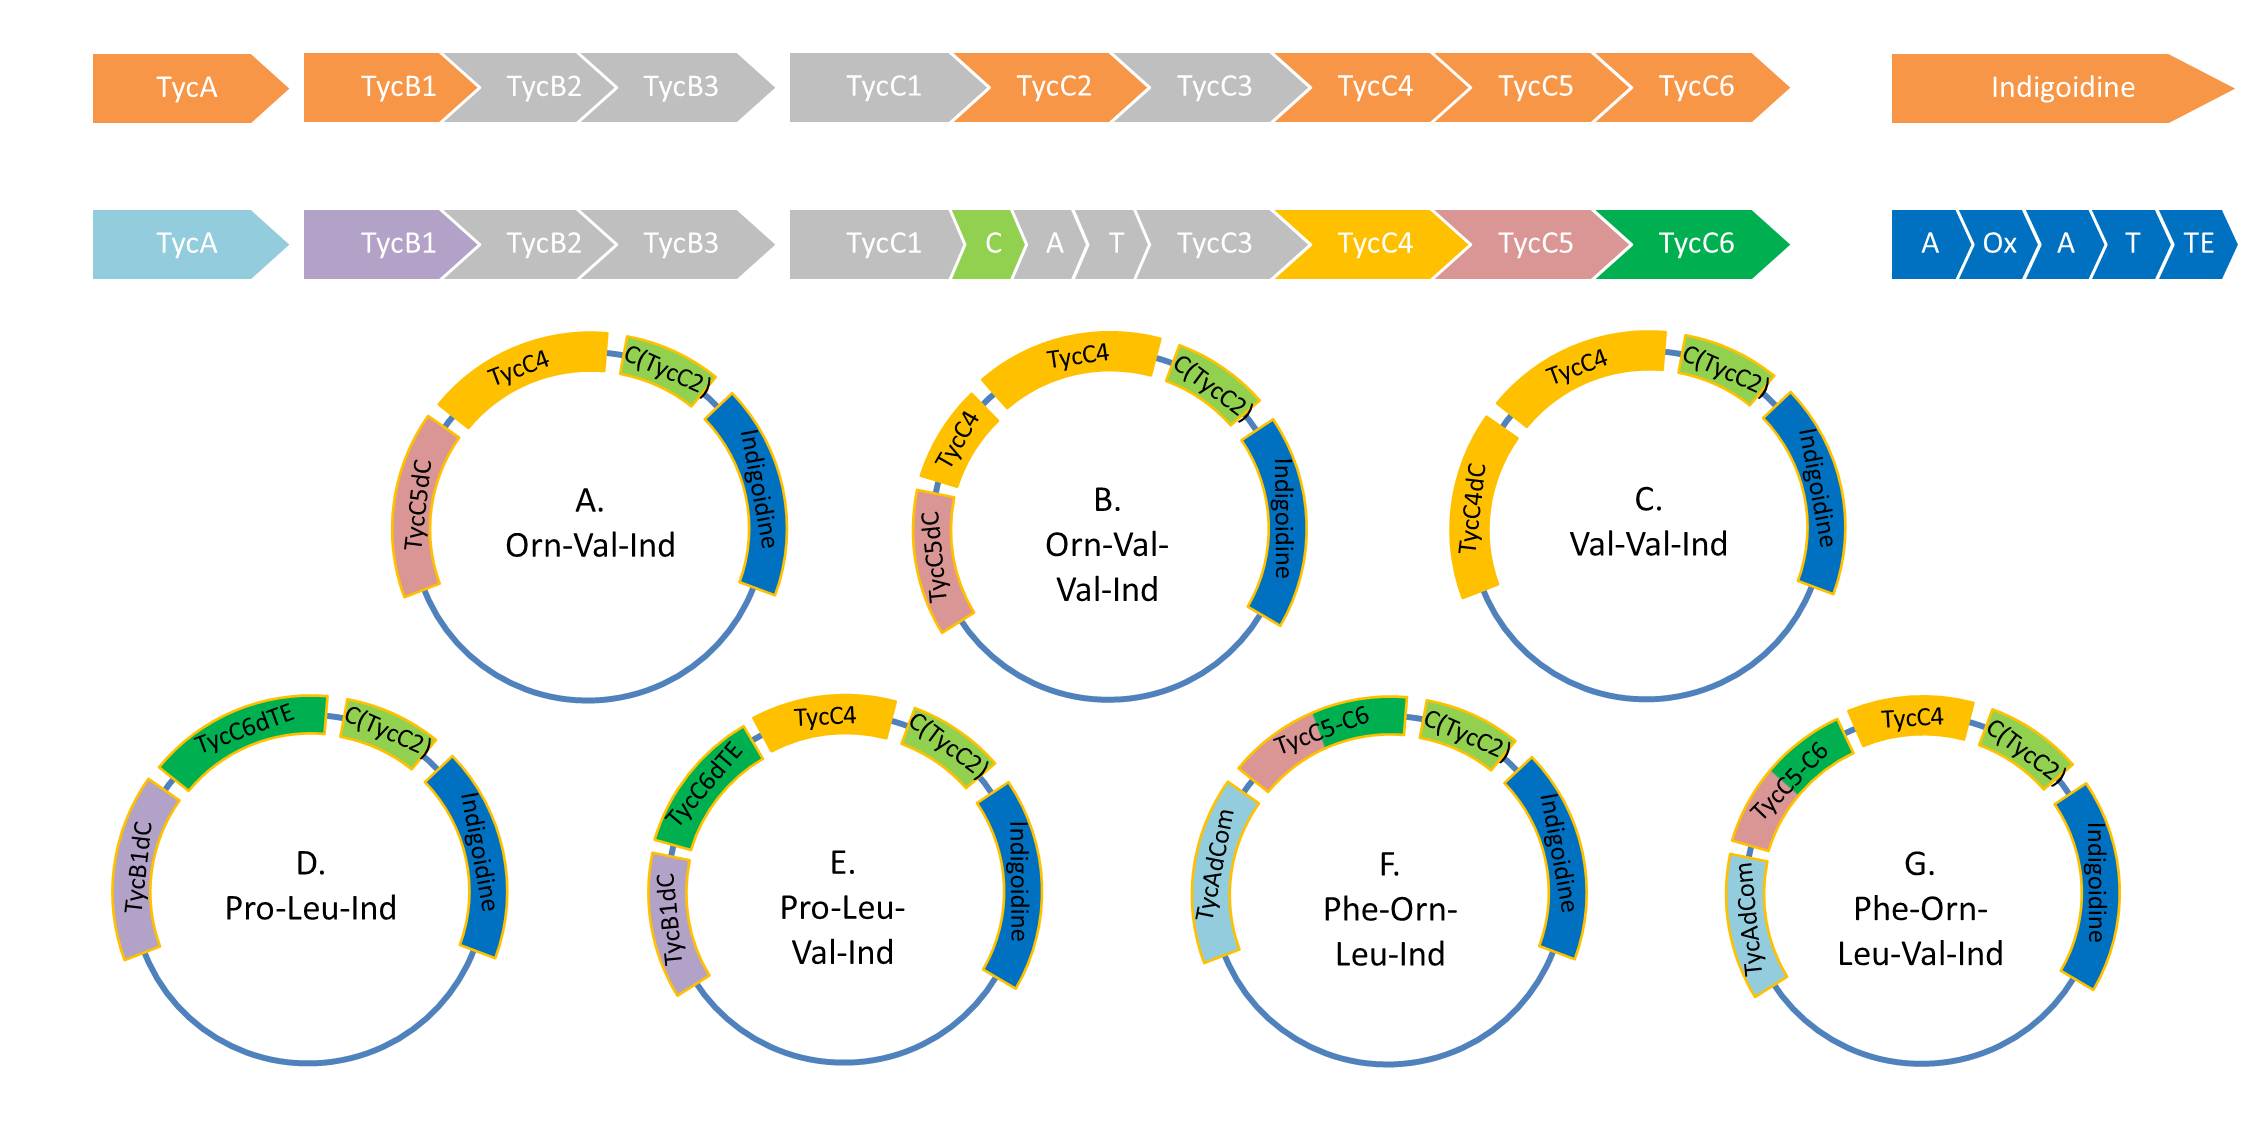
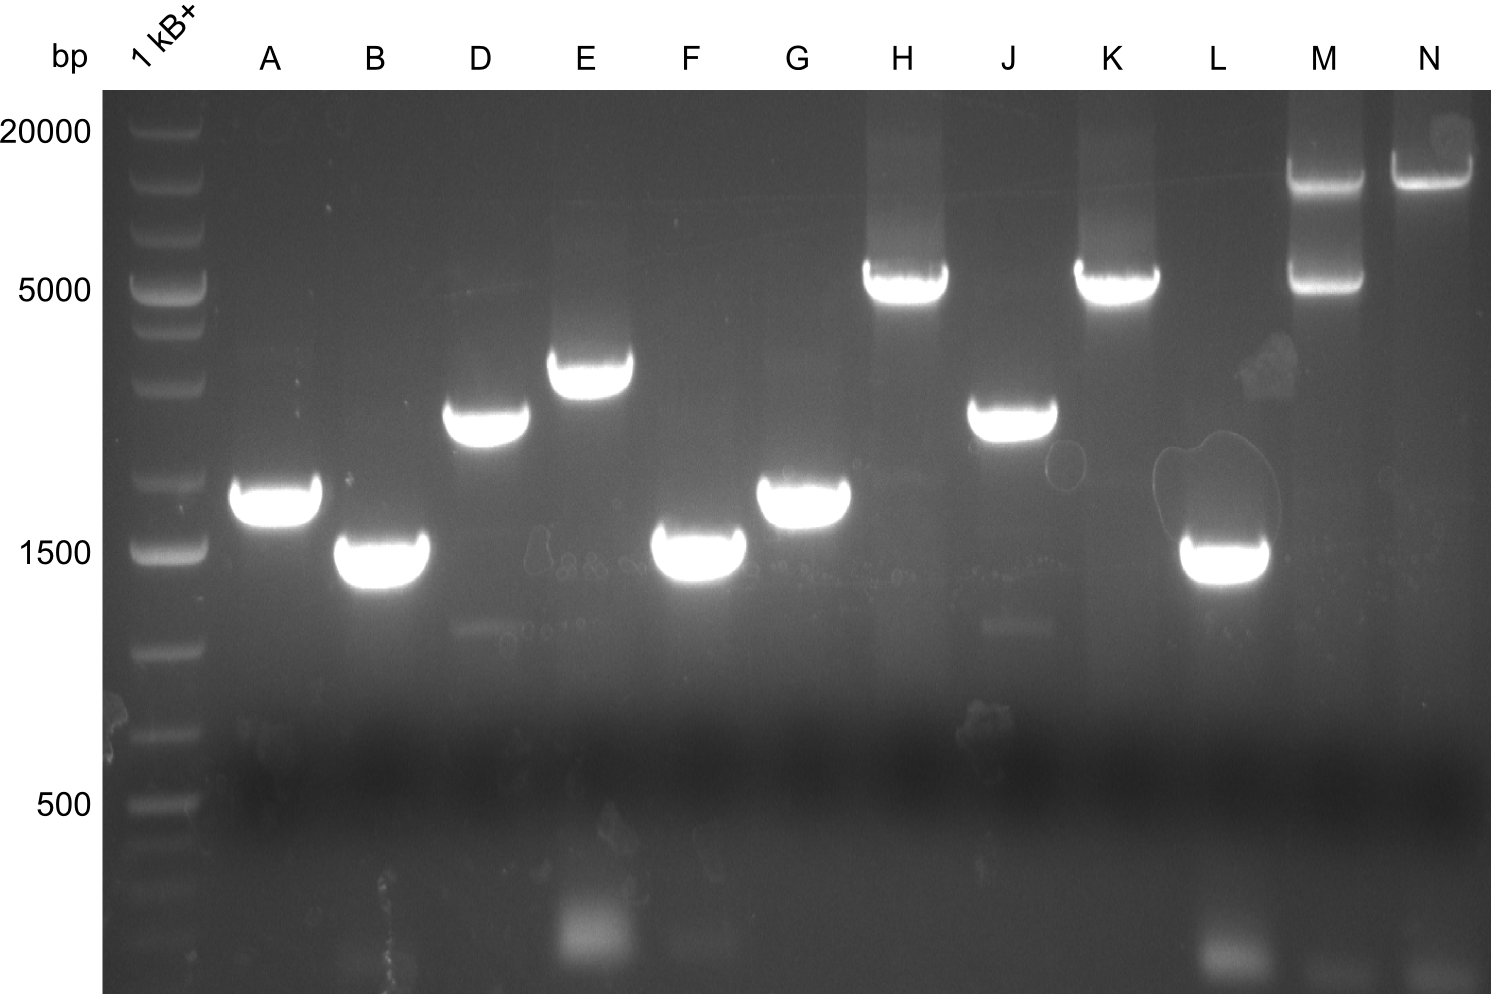
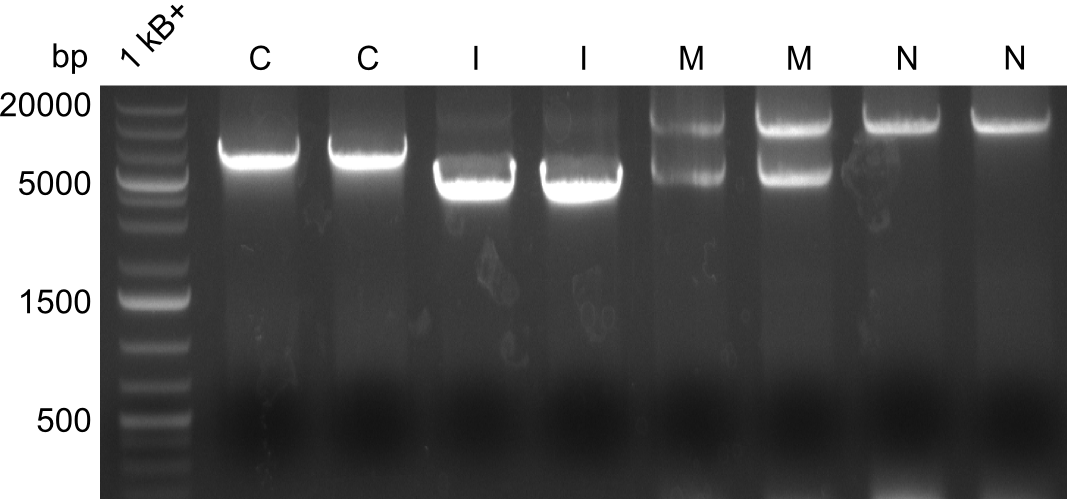
Because we could detect the Valin-Indigoidine NRP with comparative TLC and its synthetase by SDS-PAGE, we designed seven additional constructs adding up to four modules in front of the indC. We successfully amplified all fragments for the Gibson assembly and transformed the new constructs into electrocompetent DH10β.
Week 21
Cras justo odio, dapibus ac facilisis in, egestas eget quam. Donec id elit non mi porta gravida at eget metus. Nullam id dolor id nibh ultricies vehicula ut id elit.
Week 22
Cras justo odio, dapibus ac facilisis in, egestas eget quam. Donec id elit non mi porta gravida at eget metus. Nullam id dolor id nibh ultricies vehicula ut id elit.
Week 23
Cras justo odio, dapibus ac facilisis in, egestas eget quam. Donec id elit non mi porta gravida at eget metus. Nullam id dolor id nibh ultricies vehicula ut id elit.
Methods:
Lorem ipsum dolor sit amet, consetetur sadipscing elitr, sed diam nonumy eirmod tempor invidunt ut labore et dolore magna aliquyam erat, sed diam voluptua. At vero eos et accusam et justo duo dolores et ea rebum. Stet clita kasd gubergren, no sea takimata sanctus est Lorem ipsum dolor sit amet. Lorem ipsum dolor sit amet, consetetur sadipscing elitr, sed diam nonumy eirmod tempor invidunt ut labore et dolore magna aliquyam erat, sed diam voluptua. At vero eos et accusam et justo duo dolores et ea rebum. Stet clita kasd gubergren, no sea takimata sanctus est Lorem ipsum dolor sit amet.Lorem ipsum dolor sit amet, consetetur sadipscing elitr, sed diam nonumy eirmod tempor invidunt ut labore et dolore magna aliquyam erat, sed diam voluptua. .
Validation of the strain from Marahiel by Colony PCR
Primers used
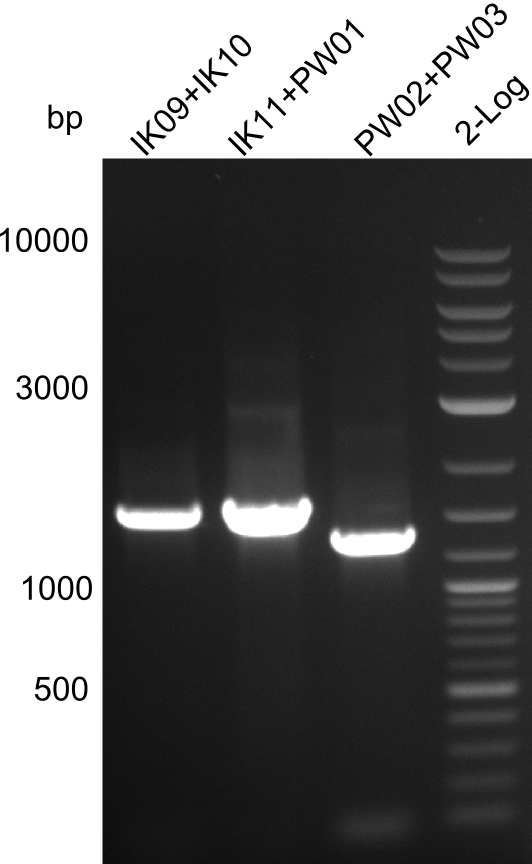
TycA_A-domain: IK09, IK10
TycB1_A-domain: IK11, PW01
TycB1_E-domain: PW02, PW03
Conditions
| Cycles | temperature [°C] | Time [s] |
|---|---|---|
| 1 | 95 | 300 |
| 12 | 95 | 60 |
| 66 ↓0.5°C | 30 | |
| 72 | 240 | |
| 23 | 95 | 60 |
| 60 | 30 | |
| 72 | 240 | |
| 1 | 72 | 600 |
| 1 | 12 | inf |
Handling of the strain
- received Brevibacillus parabrevis ATCC 8185 from Marahiel lab
- plate stood 1 week at RT in Marburg => wet, stinks
- plate cells on LB, inoculate 2x YT medium
- scratch everything from plate, centrifuge, wash with H2O, centrifuge, resuspend in H2O
Result
Three bands were visible in the UV-chamber. The three respective lanes implicate a fragment size of 1.5kb, 1.5kb and 1.2kb. This matches well the expected sizes. Therefore we can conclude that our colony PCRs have been successful!
Date: 19-07-2013
Evaluation of the strain
Result
Colonies grew over night -> as colony PCRs were positive and the strain was cultivatable, the plate of marburg seemed to be intact (despite long storage under bad conditions).
Amplifications
Amplification of fragment 1
A
| what | µl |
|---|---|
| pSB1C3 | 0,5 |
| IK22 | 2 |
| IK23 | 2 |
| Q5 2x Master mix | 10 |
| ddH20 | 5,5 |
| Cycles | temperature [°C] | Time [s] |
|---|---|---|
| 1 | 98 | 120 |
| 35 | 98 | 5 |
| 66 | 10 | |
| 72 | 120 | |
| 1 | 72 | 600 |
| 1 | 12 | inf |
Result band in gel--> cut and extraction
B
| what | µl |
|---|---|
| IK23 | 2 |
| IK22 | 2 |
| pSB1C3 | 0.5 (for fragments 1, 4 & 9) |
| Q5 2x Master mix | 10 |
| ddH20 | 5 |
| Cycles | temperature [°C] | Time [min:s] |
|---|---|---|
| 1 | 98 | 2:00 |
| 35 | 98 | 0:05 |
| 66 | 0:15 | |
| 72 | 1:00 | |
| 1 | 72 | 10:00 |
| 1 | 12 | inf |
Amplification of fragment 2
A
| what | µl |
|---|---|
| B. parabrevis | 1 |
| IK13 | 2 |
| IK14 | 2 |
| Q5 2x Master mix | 10 |
| ddH20 | 5 |
| Cycles | temperature [°C] | Time [s] |
|---|---|---|
| 1 | 98 | 300 |
| 35 | 98 | 5 |
| 70 | 10 | |
| 72 | 60 | |
| 1 | 72 | 600 |
| 1 | 12 | inf |
Result Successful
B
| what | µl |
|---|---|
| Bacillus | 1 |
| IK13 | 2 |
| IK14 | 2 |
| Q5 2x Master mix | 10 |
| ddH20 | 5 |
| Cycles | temperature [°C] | Time [min:s] |
|---|---|---|
| 1 | 98 | 2:00 |
| 35 | 98 | 0:05 |
| 70 | 0:15 | |
| 72 | 1:00 | |
| 1 | 72 | 10:00 |
| 1 | 12 | inf |
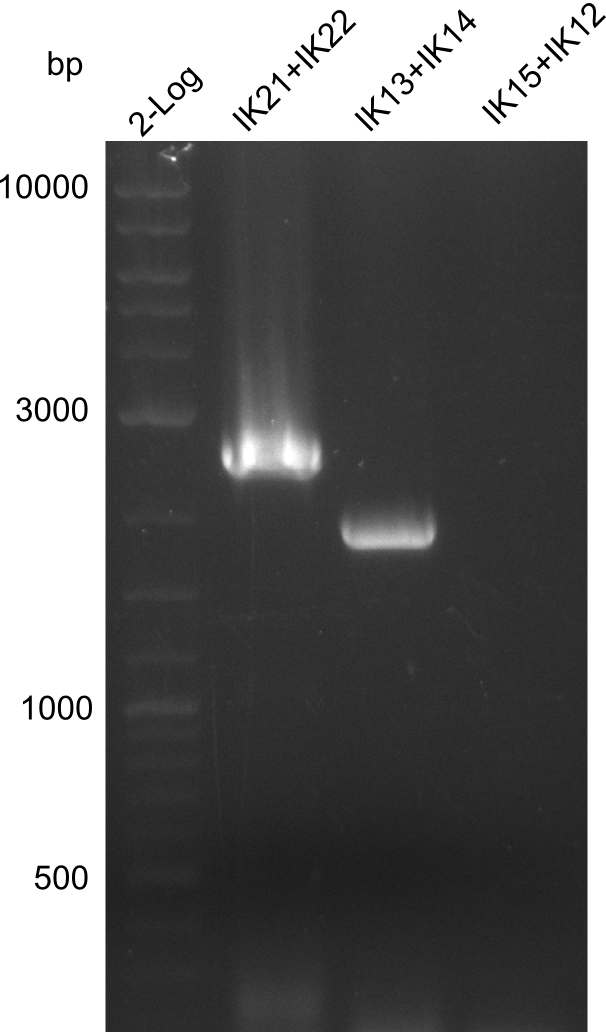
PCR redone over night as gel was clumpy and did not show the expected fragments.
Amplification of fragment 3
A
| what | µl |
|---|---|
| B. parabrevis | 1 |
| IK12 | 2 |
| IK15 | 2 |
| Q5 2x Master mix | 10 |
| ddH20 | 5 |
| Cycles | temperature [°C] | Time [s] |
|---|---|---|
| 1 | 98 | 300 |
| 35 | 98 | 5 |
| 66 | 10 | |
| 72 | 120 | |
| 1 | 72 | 600 |
| 1 | 12 | inf |
Result no band; new PCR settings
B
| Cycles | temperature [°C] | Time [s] |
|---|---|---|
| 1 | 98 | 300 |
| 12 | 98 | 5 |
| 70 touchdown (-0.5°C) | 5 | |
| 72 | 180 | |
| 23 | 98 | 5 |
| 66 | 10 | |
| 72 | 180 | |
| 1 | 72 | 600 |
| 1 | 12 | inf |
Result xxxxxxxx; new: touchdown PCR with Phusion Flash
C
| what | µl |
|---|---|
| primer fw | 2 |
| primer rv | 2 |
| DMSO | 1 |
| B. parabrevis | 1 |
| Phusion flash | 10 |
| ddH20 | 4 |
| Cycles | temperature [°C] | Time [s] |
|---|---|---|
| 1 | 98 | 120 |
| 12 | 98 | 5 |
| 70 touchdown (-0.5°C) | 5 | |
| 72 | 120 | |
| 23 | 98 | 5 |
| 64 | 5 | |
| 72 | 120 | |
| 1 | 72 | 600 |
| 1 | 12 | inf |
Result Just a light band, have to improve conditions.
D
Amplification with Q5
| what | µl |
|---|---|
| Bacillus | 1 |
| IK12 | 2 |
| IK15 | 2 |
| Q5 2x Master mix | 10 |
| ddH20 | 5 |
| Cycles | temperature [°C] | Time [min:s] |
|---|---|---|
| 1 | 98 | 2:00 |
| 35 | 98 | 0:05 |
| 66 | 0:15 | |
| 72 | 2:00 | |
| 1 | 72 | 10:00 |
| 1 | 12 | inf |
E
Amplification with Phusion Flash
| what | µl |
|---|---|
| Bacillus | 1 |
| IK12 | 2 |
| IK15 | 2 |
| Phusion 2x Master mix | 10 |
| DMSO | 1 |
| ddH20 | 4 |
| Cycles | temperature [°C] | Time [s] |
|---|---|---|
| 1 | 98 | 2:00 |
| 12 | 98 | 0:05 |
| 70↓0.5°C | 0:05 | |
| 72 | 2:30 | |
| 23 | 98 | 0:05 |
| 64 | 0:05 | |
| 72 | 3:00 | |
| 1 | 72 | 10:00 |
| 1 | 12 | inf |
F
| what | µl |
|---|---|
| Bacillus | 1 |
| IK12 | 2 |
| IK15 | 2 |
| Q5 2x Master mix | 10 |
| ddH20 | 5 |
| Cycles | temperature [°C] | Time [min:s] |
|---|---|---|
| 1 | 98 | 2:00 |
| 35 | 98 | 0:05 |
| 70 | 0:15 | |
| 72 | 2:00 | |
| 1 | 72 | 10:00 |
| 1 | 12 | inf |
PCR redone over night as gel was clumpy and did not show the expected fragments.
Amplification of fragment 4
A
| what | µl |
|---|---|
| pSB1C3 | 0,5 |
| IK21 (1:10) | 2 |
| IK22 (1:10) | 2 |
| Q5 2x Master mix | 10 |
| ddH20 | 5,5 |
| Cycles | temperature [°C] | Time [s] |
|---|---|---|
| 1 | 98 | 300 |
| 35 | 98 | 5 |
| 66 (fragment 4) | 10 | |
| 72 | 120 | |
| 1 | 72 | 600 |
| 1 | 12 | inf |
Result
Successful
B
| what | µl |
|---|---|
| pSB1C3 | 0.5 |
| IK21 | 2 |
| IK22 | 2 |
| Q5 2x Master mix | 10 |
| ddH20 | 5 |
| Cycles | temperature [°C] | Time [min:s] |
|---|---|---|
| 1 | 98 | 2:00 |
| 35 | 98 | 0:05 |
| 66 | 0:15 | |
| 72 | 1:00 | |
| 1 | 72 | 10:00 |
| 1 | 12 | inf |
Result PCR redone over night as gel was clumpy and did not show the expected fragments.
C
| what | µl |
|---|---|
| IK21 | 2 |
| IK22 | 2 |
| pSB1C3 | 0.5 |
| Q5 2x Master mix | 10 |
| ddH20 | 5 |
| Cycles | temperature [°C] | Time [min:s] |
|---|---|---|
| 1 | 98 | 2:00 |
| 35 | 98 | 0:05 |
| 66 | 0:15 | |
| 72 | 1:00 | |
| 1 | 72 | 10:00 |
| 1 | 12 | inf |
Amplification of fragment 5
A
| what | µl |
|---|---|
| B. Parabrevis | 1 |
| IK16 | 2 |
| IK17 | 2 |
| Q5 2x Master mix | 10 |
| ddH20 | 5,0 |
| Cycles | temperature [°C] | Time [s] |
|---|---|---|
| 1 | 98 | 120 |
| 35 | 98 | 5 |
| 65 | 10 | |
| 72 | 60 | |
| 1 | 72 | 600 |
| 1 | 12 | inf |
B
| what | µl |
|---|---|
| Bacillus | 1 |
| IK16 | 2 |
| IK17 | 2 |
| Q5 2x Master mix | 10 |
| ddH20 | 5 |
| Cycles | temperature [°C] | Time [min:s] |
|---|---|---|
| 1 | 98 | 2:00 |
| 35 | 98 | 0:05 |
| 66 | 0:15 | |
| 72 | 1:30 | |
| 1 | 72 | 10:00 |
| 1 | 12 | inf |
Amplification of fragment 6
A
| what | µl |
|---|---|
| B. Parabrevis | 1 |
| IK12 | 2 |
| IK18 | 2 |
| Q5 2x Master mix | 10 |
| ddH20 | 5,0 |
| Cycles | temperature [°C] | Time [s] |
|---|---|---|
| 1 | 98 | 120 |
| 35 | 98 | 5 |
| 66 | 10 | |
| 72 | 150 | |
| 1 | 72 | 600 |
| 1 | 12 | inf |
B
| what | µl |
|---|---|
| Bacillus | 1 |
| IK12 | 2 |
| IK18 | 2 |
| Q5 2x Master mix | 10 |
| ddH20 | 5 |
| Cycles | temperature [°C] | Time [min:s] |
|---|---|---|
| 1 | 98 | 2:00 |
| 35 | 98 | 0:05 |
| 66 | 0:15 | |
| 72 | 3:00 | |
| 1 | 72 | 10:00 |
| 1 | 12 | inf |
Amplification of fragment 7
A
| what | µl |
|---|---|
| B. Parabrevis | 1 |
| IK13 | 2 |
| IK19 | 2 |
| Q5 2x Master mix | 10 |
| ddH20 | 5,0 |
| Cycles | temperature [°C] | Time [s] |
|---|---|---|
| 1 | 98 | 120 |
| 35 | 98 | 5 |
| 70 | 10 | |
| 72 | 60 | |
| 1 | 72 | 600 |
| 1 | 12 | inf |
B
| what | µl |
|---|---|
| Bacillus | 1 |
| IK13 | 2 |
| IK19 | 2 |
| Q5 2x Master mix | 10 |
| ddH20 | 5 |
| Cycles | temperature [°C] | Time [min:s] |
|---|---|---|
| 1 | 98 | 2:00 |
| 35 | 98 | 0:05 |
| 70 | 0:15 | |
| 72 | 1:00 | |
| 1 | 72 | 10:00 |
| 1 | 12 | inf |
PCR redone over night as gel was clumpy and did not show the expected fragments.
Amplification of fragment 8
A
| what | µl |
|---|---|
| B. Parabrevis | 1 |
| IK20 | 2 |
| IK12 | 2 |
| Q5 2x Master mix | 10 |
| ddH20 | 5,0 |
| Cycles | temperature [°C] | Time [s] |
|---|---|---|
| 1 | 98 | 120 |
| 35 | 98 | 5 |
| 66 | 10 | |
| 72 | 150 | |
| 1 | 72 | 600 |
| 1 | 12 | inf |
B
| what | µl |
|---|---|
| Bacillus | 1 |
| IK12 | 2 |
| IK20 | 2 |
| Q5 2x Master mix | 10 |
| ddH20 | 5 |
| Cycles | temperature [°C] | Time [min:s] |
|---|---|---|
| 1 | 98 | 2:00 |
| 35 | 98 | 0:05 |
| 66 | 0:15 | |
| 72 | 3:00 | |
| 1 | 72 | 10:00 |
| 1 | 12 | inf |
Amplification of fragment 9
A
| what | µl |
|---|---|
| pSB1C3 | 0.5 |
| PW04 | 2 |
| IK21 | 2 |
| Q5 2x Master mix | 10 |
| ddH20 | 5 |
| Cycles | temperature [°C] | Time [min:s] |
|---|---|---|
| 1 | 98 | 2:00 |
| 35 | 98 | 0:05 |
| 66 | 0:15 | |
| 72 | 1:00 | |
| 1 | 72 | 10:00 |
| 1 | 12 | inf |
PCR redone over night as gel was clumpy and did not show the expected fragments.
B
| what | µl |
|---|---|
| PW04 | 2 |
| IK22 | 2 |
| pSB1C3 | 0.5 |
| Q5 2x Master mix | 10 |
| ddH20 | 5 |
| Cycles | temperature [°C] | Time [min:s] |
|---|---|---|
| 1 | 98 | 2:00 |
| 35 | 98 | 0:05 |
| 66 | 0:15 | |
| 72 | 1:00 | |
| 1 | 72 | 10:00 |
| 1 | 12 | inf |
Amplification of fragment 10
A
| what | µl |
|---|---|
| Bacillus | 1 |
| PW05 | 2 |
| PW06 | 2 |
| Q5 2x Master mix | 10 |
| ddH20 | 5 |
| Cycles | temperature [°C] | Time [min:s] |
|---|---|---|
| 1 | 98 | 2:00 |
| 35 | 98 | 0:05 |
| 70 | 0:15 | |
| 72 | 1:00 | |
| 1 | 72 | 10:00 |
| 1 | 12 | inf |
PCR redone over night as gel was clumpy and did not show the expected fragments.
B
| what | µl |
|---|---|
| PW05 | 2 |
| PW06 | 2 |
| Bacillus | 1 |
| Q5 2x Master mix | 10 |
| ddH20 | 5 |
| Cycles | temperature [°C] | Time [min:s] |
|---|---|---|
| 1 | 98 | 2:00 |
| 35 | 98 | 0:05 |
| 70 (fragment 10) | 0:15 | |
| 72 | 1:00 | |
| 1 | 72 | 10:00 |
| 1 | 12 | inf |
Amplification of fragment 11
A
| what | µl |
|---|---|
| PW07 | 2 |
| PW08 | 2 |
| Bacillus | 1 |
| Q5 2x Master mix | 10 |
| ddH20 | 5 |
| Cycles | temperature [°C] | Time [min:s] |
|---|---|---|
| 1 | 98 | 2:00 |
| 35 | 98 | 0:05 |
| 72 | 0:15 | |
| 72 | 2:30 | |
| 1 | 72 | 10:00 |
| 1 | 12 | inf |
Amplification of fragment 12
A
| what | µl |
|---|---|
| PW09 | 2 |
| PW10 | 2 |
| Bacillus | 1 |
| Q5 2x Master mix | 10 |
| ddH20 | 5 |
| Cycles | temperature [°C] | Time [min:s] |
|---|---|---|
| 1 | 98 | 2:00 |
| 35 | 98 | 0:05 |
| 69 | 0:15 | |
| 72 | 1:30 | |
| 1 | 72 | 10:00 |
| 1 | 12 | inf |
Amplification of fragment 13
A
| what | µl |
|---|---|
| Bacillus | 1 (for fragments 2, 3, 7, 10, 13 & 15) |
| PW11 | 2 |
| IK12 | 2 |
| Q5 2x Master mix | 10 |
| ddH20 | 5 |
| Cycles | temperature [°C] | Time [min:s] |
|---|---|---|
| 1 | 98 | 2:00 |
| 35 | 98 | 0:05 |
| 66 | 0:15 | |
| 72 | 2:00 | |
| 1 | 72 | 10:00 |
| 1 | 12 | inf |
PCR redone over night as gel was clumpy and did not show the expected fragments.
B
| what | µl |
|---|---|
| PW11 | 2 |
| IK12 | 2 |
| Bacillus | 1 |
| Q5 2x Master mix | 10 |
| ddH20 | 5 |
| Cycles | temperature [°C] | Time [min:s] |
|---|---|---|
| 1 | 98 | 2:00 |
| 35 | 98 | 0:05 |
| 66 | 0:15 | |
| 72 | 2:00 | |
| 1 | 72 | 10:00 |
| 1 | 12 | inf |
Amplification of fragment 14
A
| what | µl |
|---|---|
| PW09 | 2 |
| IK12 | 2 |
| Bacillus | 1 (for fragments 2, 10, 13, 14 & 15) |
| pSB1C3 | 0.5 (for fragments 1, 4 & 9) |
| Q5 2x Master mix | 10 |
| ddH20 | 5 |
| Cycles | temperature [°C] | Time [min:s] |
|---|---|---|
| 1 | 98 | 2:00 |
| 35 | 98 | 0:05 |
| 62 | 0:15 | |
| 72 | 1:00 | |
| 1 | 72 | 10:00 |
| 1 | 12 | inf |
Amplification of fragment 15
A
| what | µl |
|---|---|
| Bacillus | 1 (for fragments 2, 3, 7, 10, 13 & 15) |
| PW13 | 2 |
| IK12 | 2 |
| Q5 2x Master mix | 10 |
| ddH20 | 5 |
| Cycles | temperature [°C] | Time [min:s] |
|---|---|---|
| 1 | 98 | 2:00 |
| 35 | 98 | 0:05 |
| 66 | 0:15 | |
| 72 | 2:00 | |
| 1 | 72 | 10:00 |
| 1 | 12 | inf |
PCR redone over night as gel was clumpy and did not show the expected fragments.
B
| what | µl |
|---|---|
| PW13 | 2 |
| IK12 | 2 |
| Bacillus | 1 |
| Q5 2x Master mix | 10 |
| ddH20 | 5 |
| Cycles | temperature [°C] | Time [min:s] |
|---|---|---|
| 1 | 98 | 2:00 |
| 35 | 98 | 0:05 |
| 66 | 0:15 | |
| 72 | 2:00 | |
| 1 | 72 | 10:00 |
| 1 | 12 | inf |
Analysis of DNA concentrations of previously amplified fragments
Analytical Gel Electrophoresis 0.8% agarose
Scheme: each 1µL DNA (eluation in 20µL water)+ 3 µL loading dye
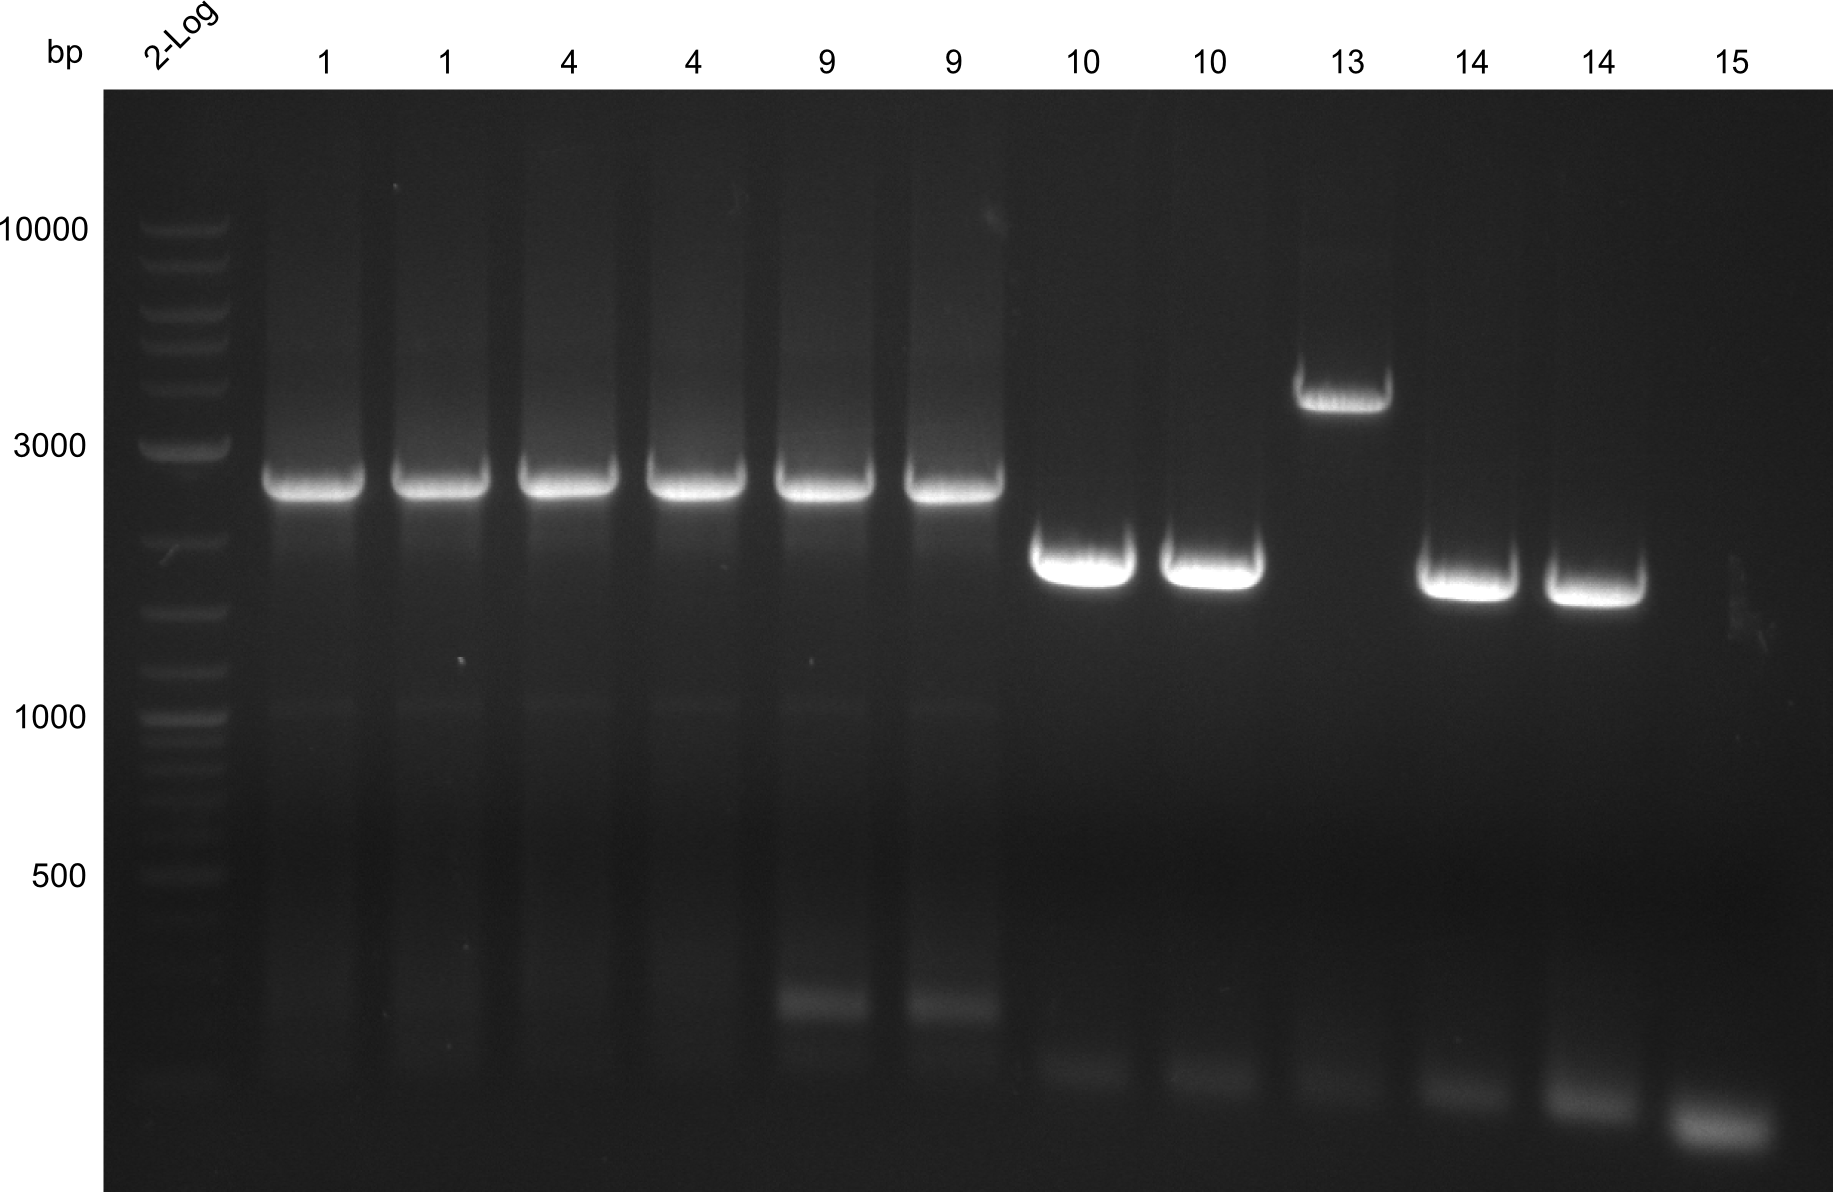
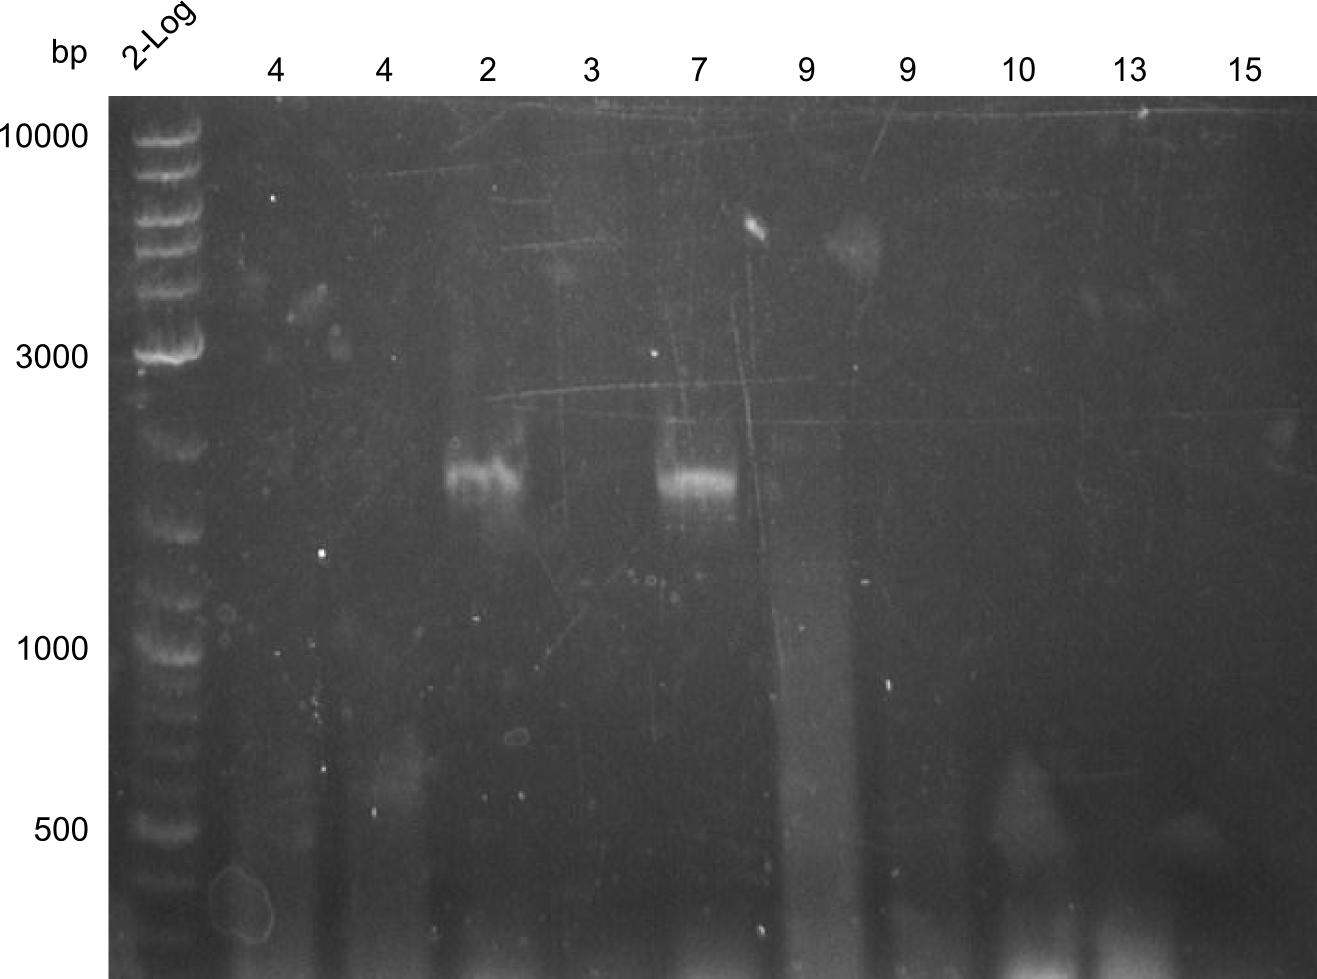
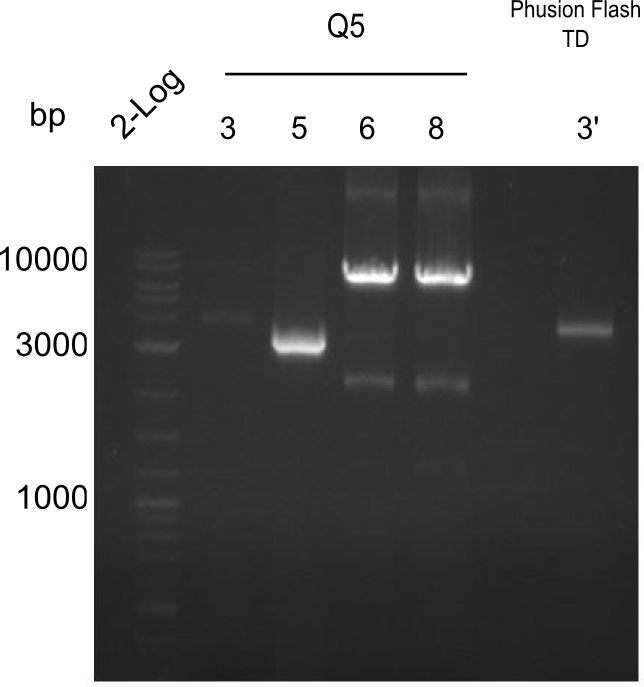
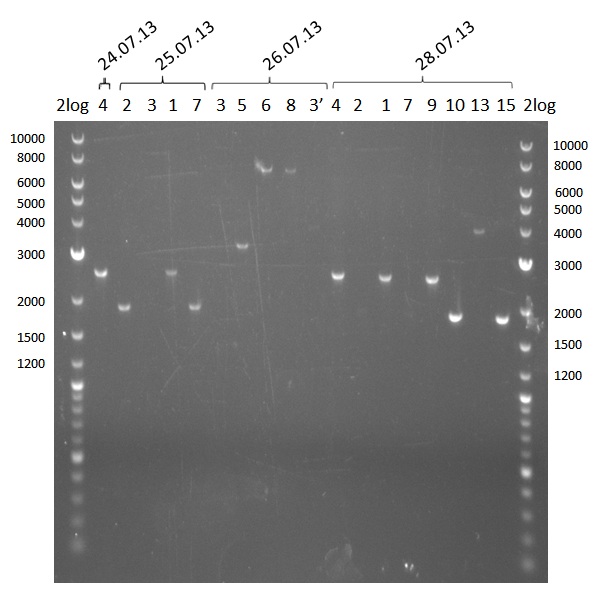
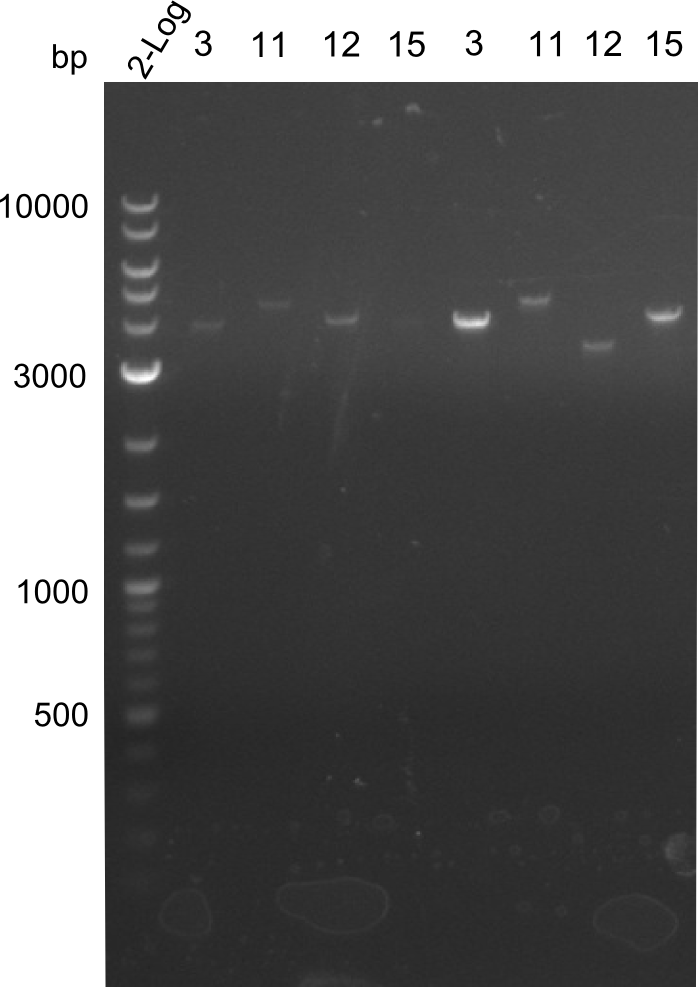
2log ladder, 4 µL 24.7:4, 25.7:1,2,3,7, 26.7.:3,5,6,8,3', 28.7.1,2,4,9,10,13,14 2log ladder, 4 µL
| fragment | concentration [ng/µl] |
|---|---|
| 1 | 32 |
| 2 | 16 |
| 3 | -- |
| 4 | 30 |
| 5 | 12 |
| 6 | 8 |
| 7 | 12 |
| 8 | 8 |
| 9 | 30 |
| 10 | 40 |
| 11 | in progress |
| 12 | in progress |
| 13 | 4 |
| 14 | 40 |
| 15 | -- |
Amplifications Round I
Analysis of DNA concentrations of fragments amplified so far
Analytical Gel Electrophoresis 0.8% agarose
Scheme: each 1µL DNA (eluation in 20µL water)+ 3 µL loading dye
2log ladder, 4 µL 24.7:4, 25.7:1,2,3,7, 26.7.:3,5,6,8,3', 28.7.1,2,4,9,10,13,14 2log ladder, 4 µL
| fragment | concentration [ng/µl] |
|---|---|
| 1 | 32 |
| 2 | 16 |
| 3 | -- |
| 4 | 30 |
| 5 | 12 |
| 6 | 8 |
| 7 | 12 |
| 8 | 8 |
| 9 | 30 |
| 10 | 40 |
| 11 | in progress |
| 12 | in progress |
| 13 | 4 |
| 14 | 40 |
| 15 | -- |
--> next steps:
- reamplify fragments 3, 13 & 15 (optimize)
- reamplify fragments 5, 6, 7 & 8 for higher yield
- Plan B: Re-PCR from low-yield fragments
Reamplification of low yield fragments: 2, 7, 6, 8, 5
- fragments 2 & 7 (Two-Block A)
- fragments 6 & 8 (T 100)
- fragment 5 (Two-Block B)
For all amplifications 2x 20µl PCRs were used. PCR was run with Q5
| what | µl |
|---|---|
| fw primer | 2 |
| rv primer | 2 |
| Bacillus | 1 |
| Q5 2x Master mix | 10 |
| ddH20 | 5 |
| Cycles | temperature [°C] | Time [min:s] |
|---|---|---|
| 1 | 98 | 2:00 |
| 35 | 98 | 0:05 |
| 68 (fr. 2 & 7) / 64 (fr. 6 & 8) / 63 (fr. 5) | 0:15 | |
| 72 | 1:00 (fr. 2 & 7) / 3:30 (fr. 6 & 8) / 1:30 (fr. 5) | |
| 1 | 72 | 10:00 |
| 1 | 12 | inf |
The PCRs were run 2°C under Tm for the primers, as specific products were obtained in the previous amplifications, but yield after gel-extraction was low.
Amplification of 3, 5, 15
PCRs of Fragments 3, 5 and 15 with phusion flash. And same PCR touchdown program. Two-block A.
fragment 3: IK15+13 fragment 5: IK12+PW11 fragments 15: Ik12+Pw13
| what | µl |
|---|---|
| fw primer | 2 |
| rv primer | 2 |
| Bacillus | 1 |
| Phusion 2x Master mix | 10 |
| DMSO | 1 |
| ddH20 | 4 |
| Cycles | temperature [°C] | Time [s] |
|---|---|---|
| 1 | 98 | 2:00 |
| 12 | 98 | 0:05 |
| 66↓0.5°C | 0:05 | |
| 72 | 2:30 | |
| 23 | 98 | 0:05 |
| 60 | 0:05 | |
| 72 | 2:30 | |
| 1 | 72 | 10:00 |
| 1 | 12 | inf |
Amplification of Fragment 12
Fusion/Q5
| Cycles | temperature [°C] | Time [min:s] |
|---|---|---|
| 1 | 98 | 2:00 |
| 36 | 98 | 0:05 |
| 67 | 0:10 | |
| 72 | 1:30 (Q5) / 1:00 Fusion | |
| 1 | 72 | 10:00 |
| 1 | 12 | inf |
Fusion Touch Down
| Cycles | temperature [°C] | Time [min:s] |
|---|---|---|
| 1 | 98 | 2:00 |
| 12 | 98 | 2:00 |
| 68↓0.5°C | 0:05 | |
| 72 | 1:00 | |
| 23 | 98 | 0:05 |
| 62 | 0:05 | |
| 72 | 1:00 | |
| 1 | 72 | 10:00 |
| 1 | 12 | inf |
Analysis of DNA concentrations
- Gel-extraction of fragments 2, 3, 4, 5, 6, 7, 8, 11, 12, 13, 15
- DNA was eluted with 30 µl instead of 20 µl
| fragment | concentration [ng/µl] |
|---|---|
| 2 | 12 |
| 3 | 3 |
| 4 | 16 |
| 5 | 14 |
| 6 | -- |
| 7 | 18 |
| 8 | -- |
| 11 | 5 |
| 12 | -- |
| 13 | 20 |
| 15 | 11 |
- Reamplify fragments 6 & 8 and use gel-extraction kit for long fragments
- Optimize conditions for fragment 12
Amplification of fragments 6, 8, 12
Q5 6 IK12,18 8 IK18,20
| what | µl |
|---|---|
| fw primer | 2 |
| rv primer | 2 |
| Bacillus | 1 |
| Q5 2x Master mix | 10 |
| ddH20 | 5 |
| Cycles | temperature [°C] | Time [min:s] |
|---|---|---|
| 1 | 98 | 2:00 |
| 35 | 98 | 0:05 |
| 66 | 0:15 | |
| 72 | 3:00 | |
| 1 | 72 | 10:00 |
| 1 | 12 | inf |
Phusion Flash, Touchdown 12 PW09,10
| what | µl |
|---|---|
| fw primer | 2 |
| rv primer | 2 |
| Bacillus | 1 |
| Phusion 2x Master mix | 10 |
| DMSO | 1 |
| ddH20 | 4 |
| Cycles | temperature [°C] | Time [s] |
|---|---|---|
| 1 | 98 | 2:00 |
| 12 | 98 | 2:00 |
| 66↓0.5°C | 0:05 | |
| 72 | 1:10 | |
| 23 | 98 | 0:05 |
| 64 | 0:05 | |
| 72 | 1:10 | |
| 1 | 72 | 10:00 |
| 1 | 12 | inf |
Assembly Round I
Tripeptide-I-NRPS Assembly
Gibson Assembly to Tripeptide-I-NRPS
- DO ALL WORK ON ICE!!
- mix 1,08 µl of fragment 4, 3; 24 µl of fragment 5 & 5.68 µl of fragment 6
- add 10 µl of Gibson master mix
- let incubate for 60 minutes at 50°C
- split up 20 µl into:
- 15 µl for isopropanol / ethanol DNA precipitation
- add 60 µl (4 volumes) of isopropanol and centrifuge for 20 mins at full speed
- discard supernatant
- wash pellet in ethanol, centrifuge for 5 mins and discard supernatant, let dry
- let resuspend in 10 µl H20 and electroporate
- to the remaining 5 µl, add 10µl ddH2O
- electroporate with 1 µl
- electroporate with 14 µl
- 15 µl for isopropanol / ethanol DNA precipitation
- use a negative control (10 µl H2O)
CPEC Assembly of Tripeptide-I-NRPS
- DO ALL WORK ON ICE!!
- mix fragment - DNA aequimolarly --> 10 µl
- add 10 µl of Phusion flash master mix
| Cycles | temperature [°C] | Time [min:s] |
|---|---|---|
| 1 | 98 | 0:05 |
| 10 | 98 | 0:01 |
| 55 | 0:05 | |
| 72 | 2:00 | |
| 1 | 10 | inf |
- split up 20 µl into:
- 5 µl for chemical transformation
- 10 µl for isopropanol / ethanol DNA-precipitation
- see above
- add 10 µl ddH2O to the remaining 5 µl
- electroporate 1 µl
- electroporate 14µl
- split up 20 µl into:
Gibson Assembly Results
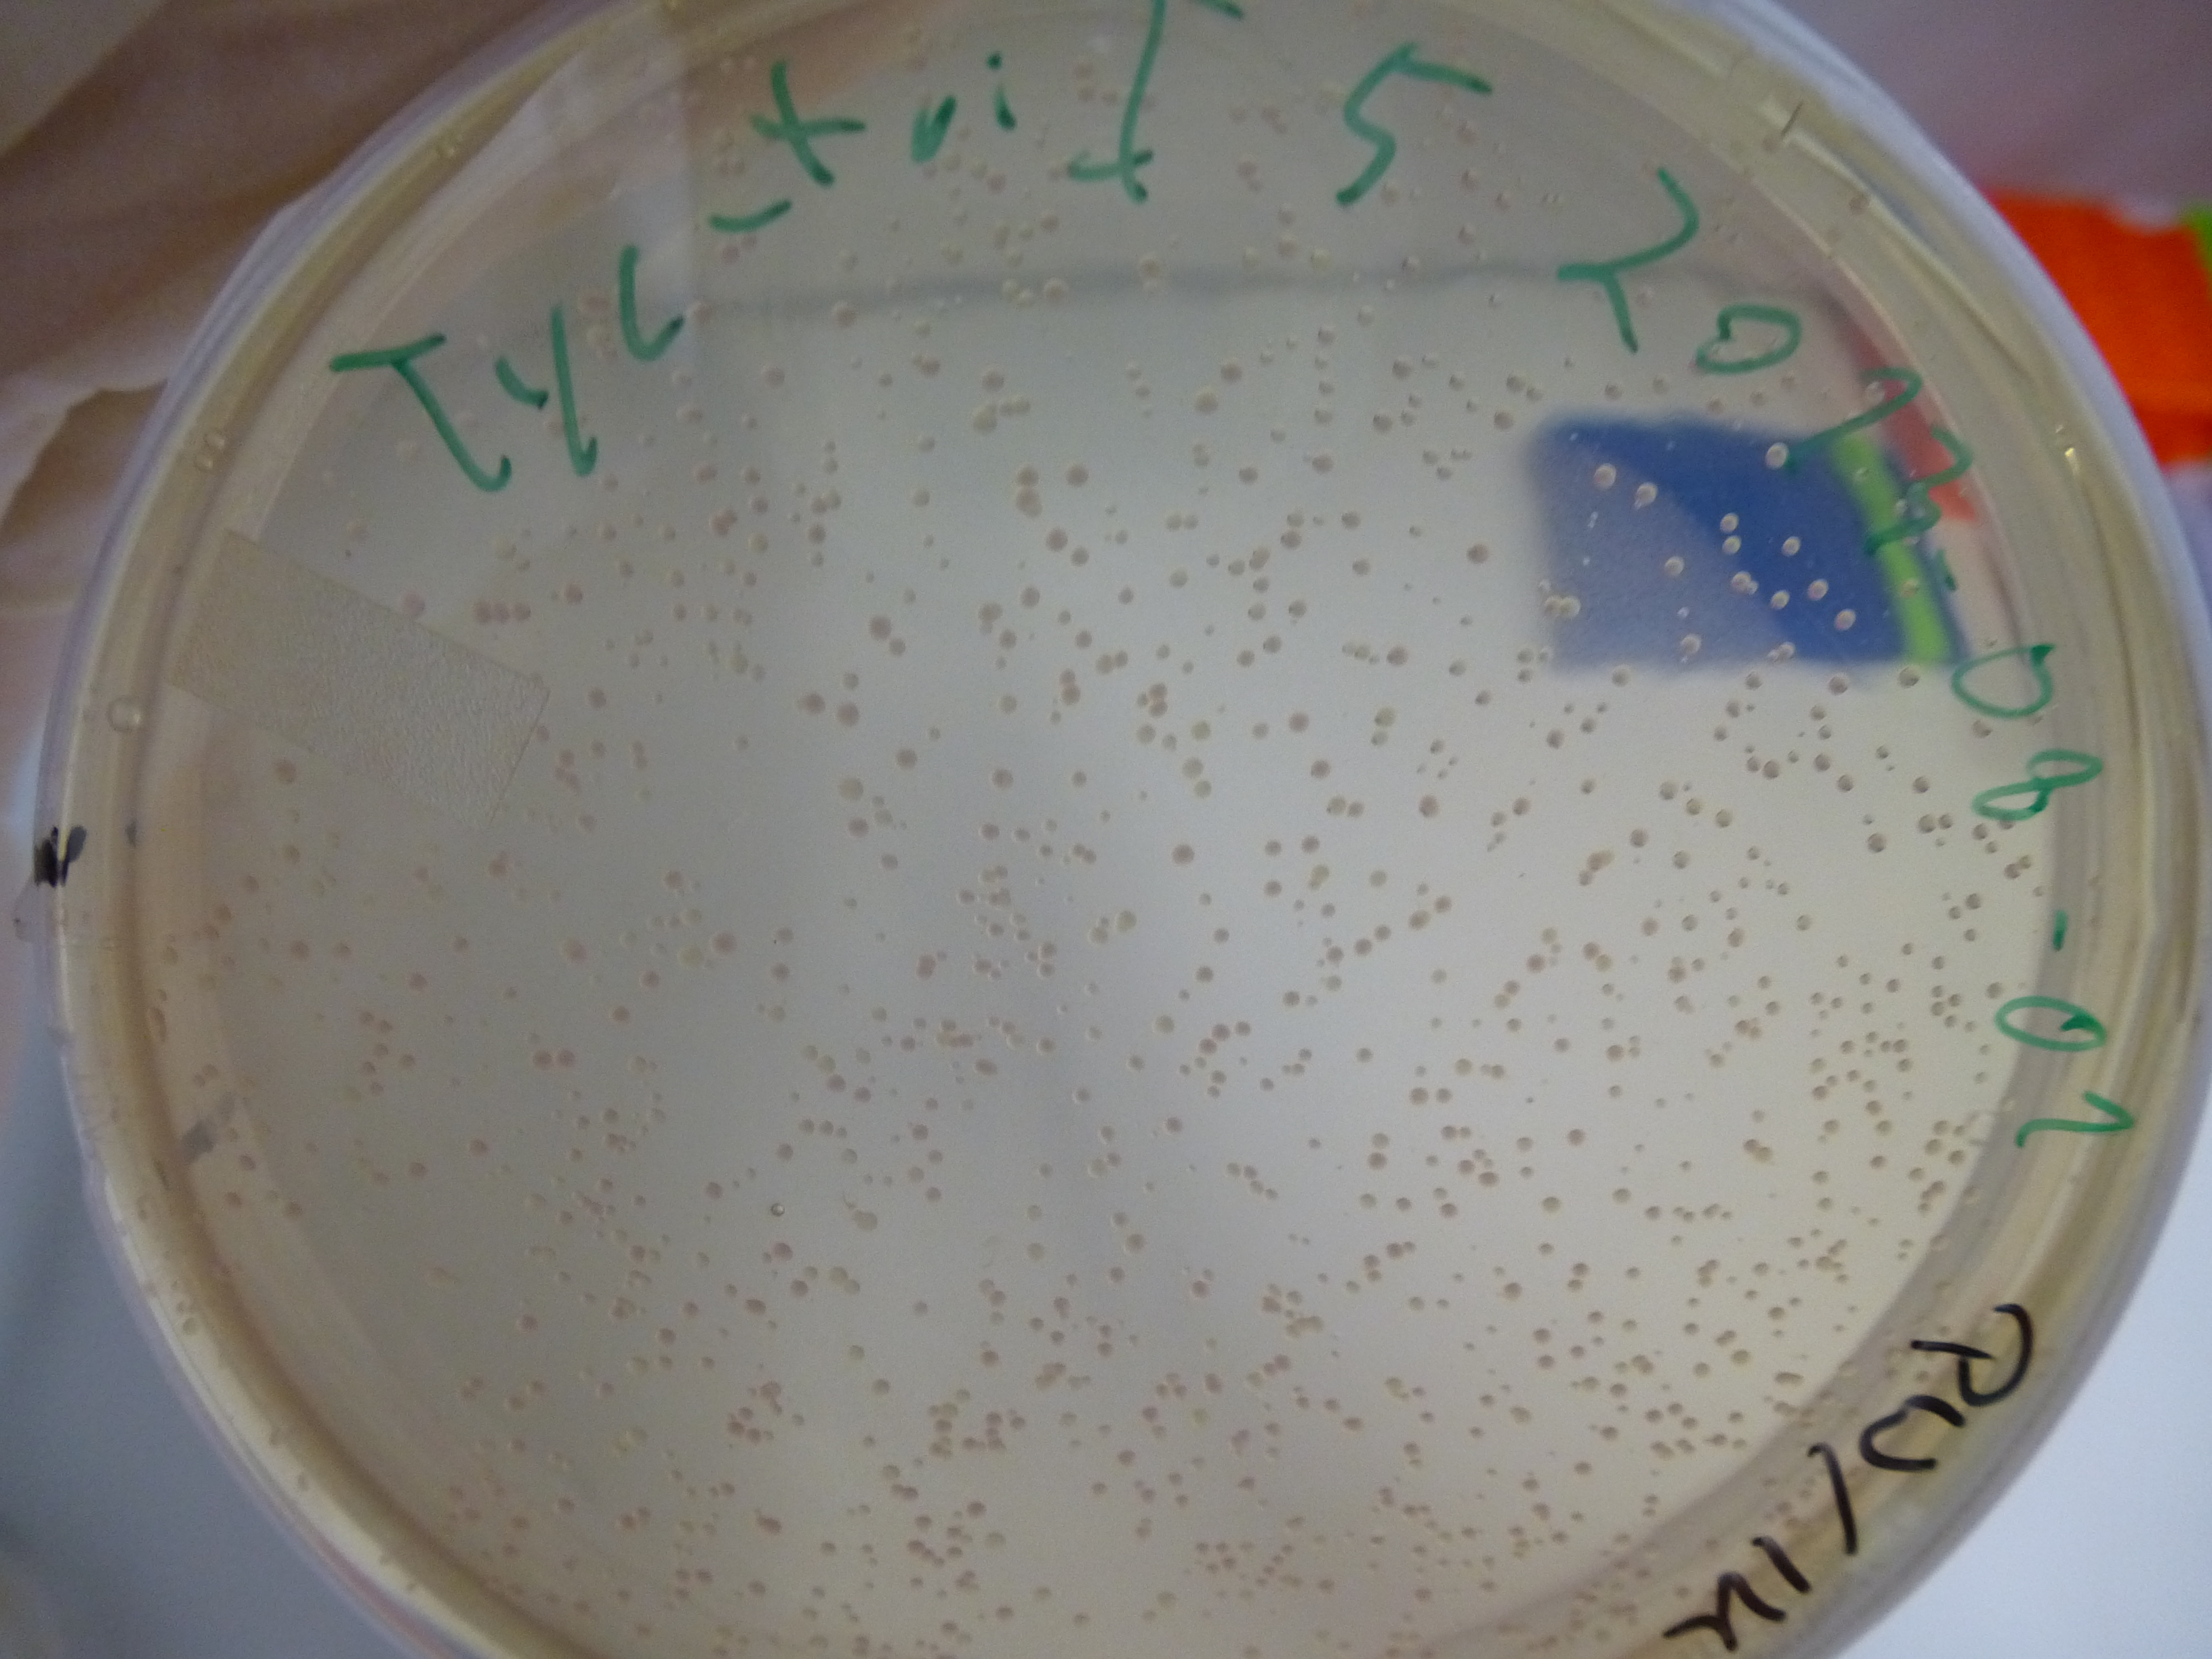
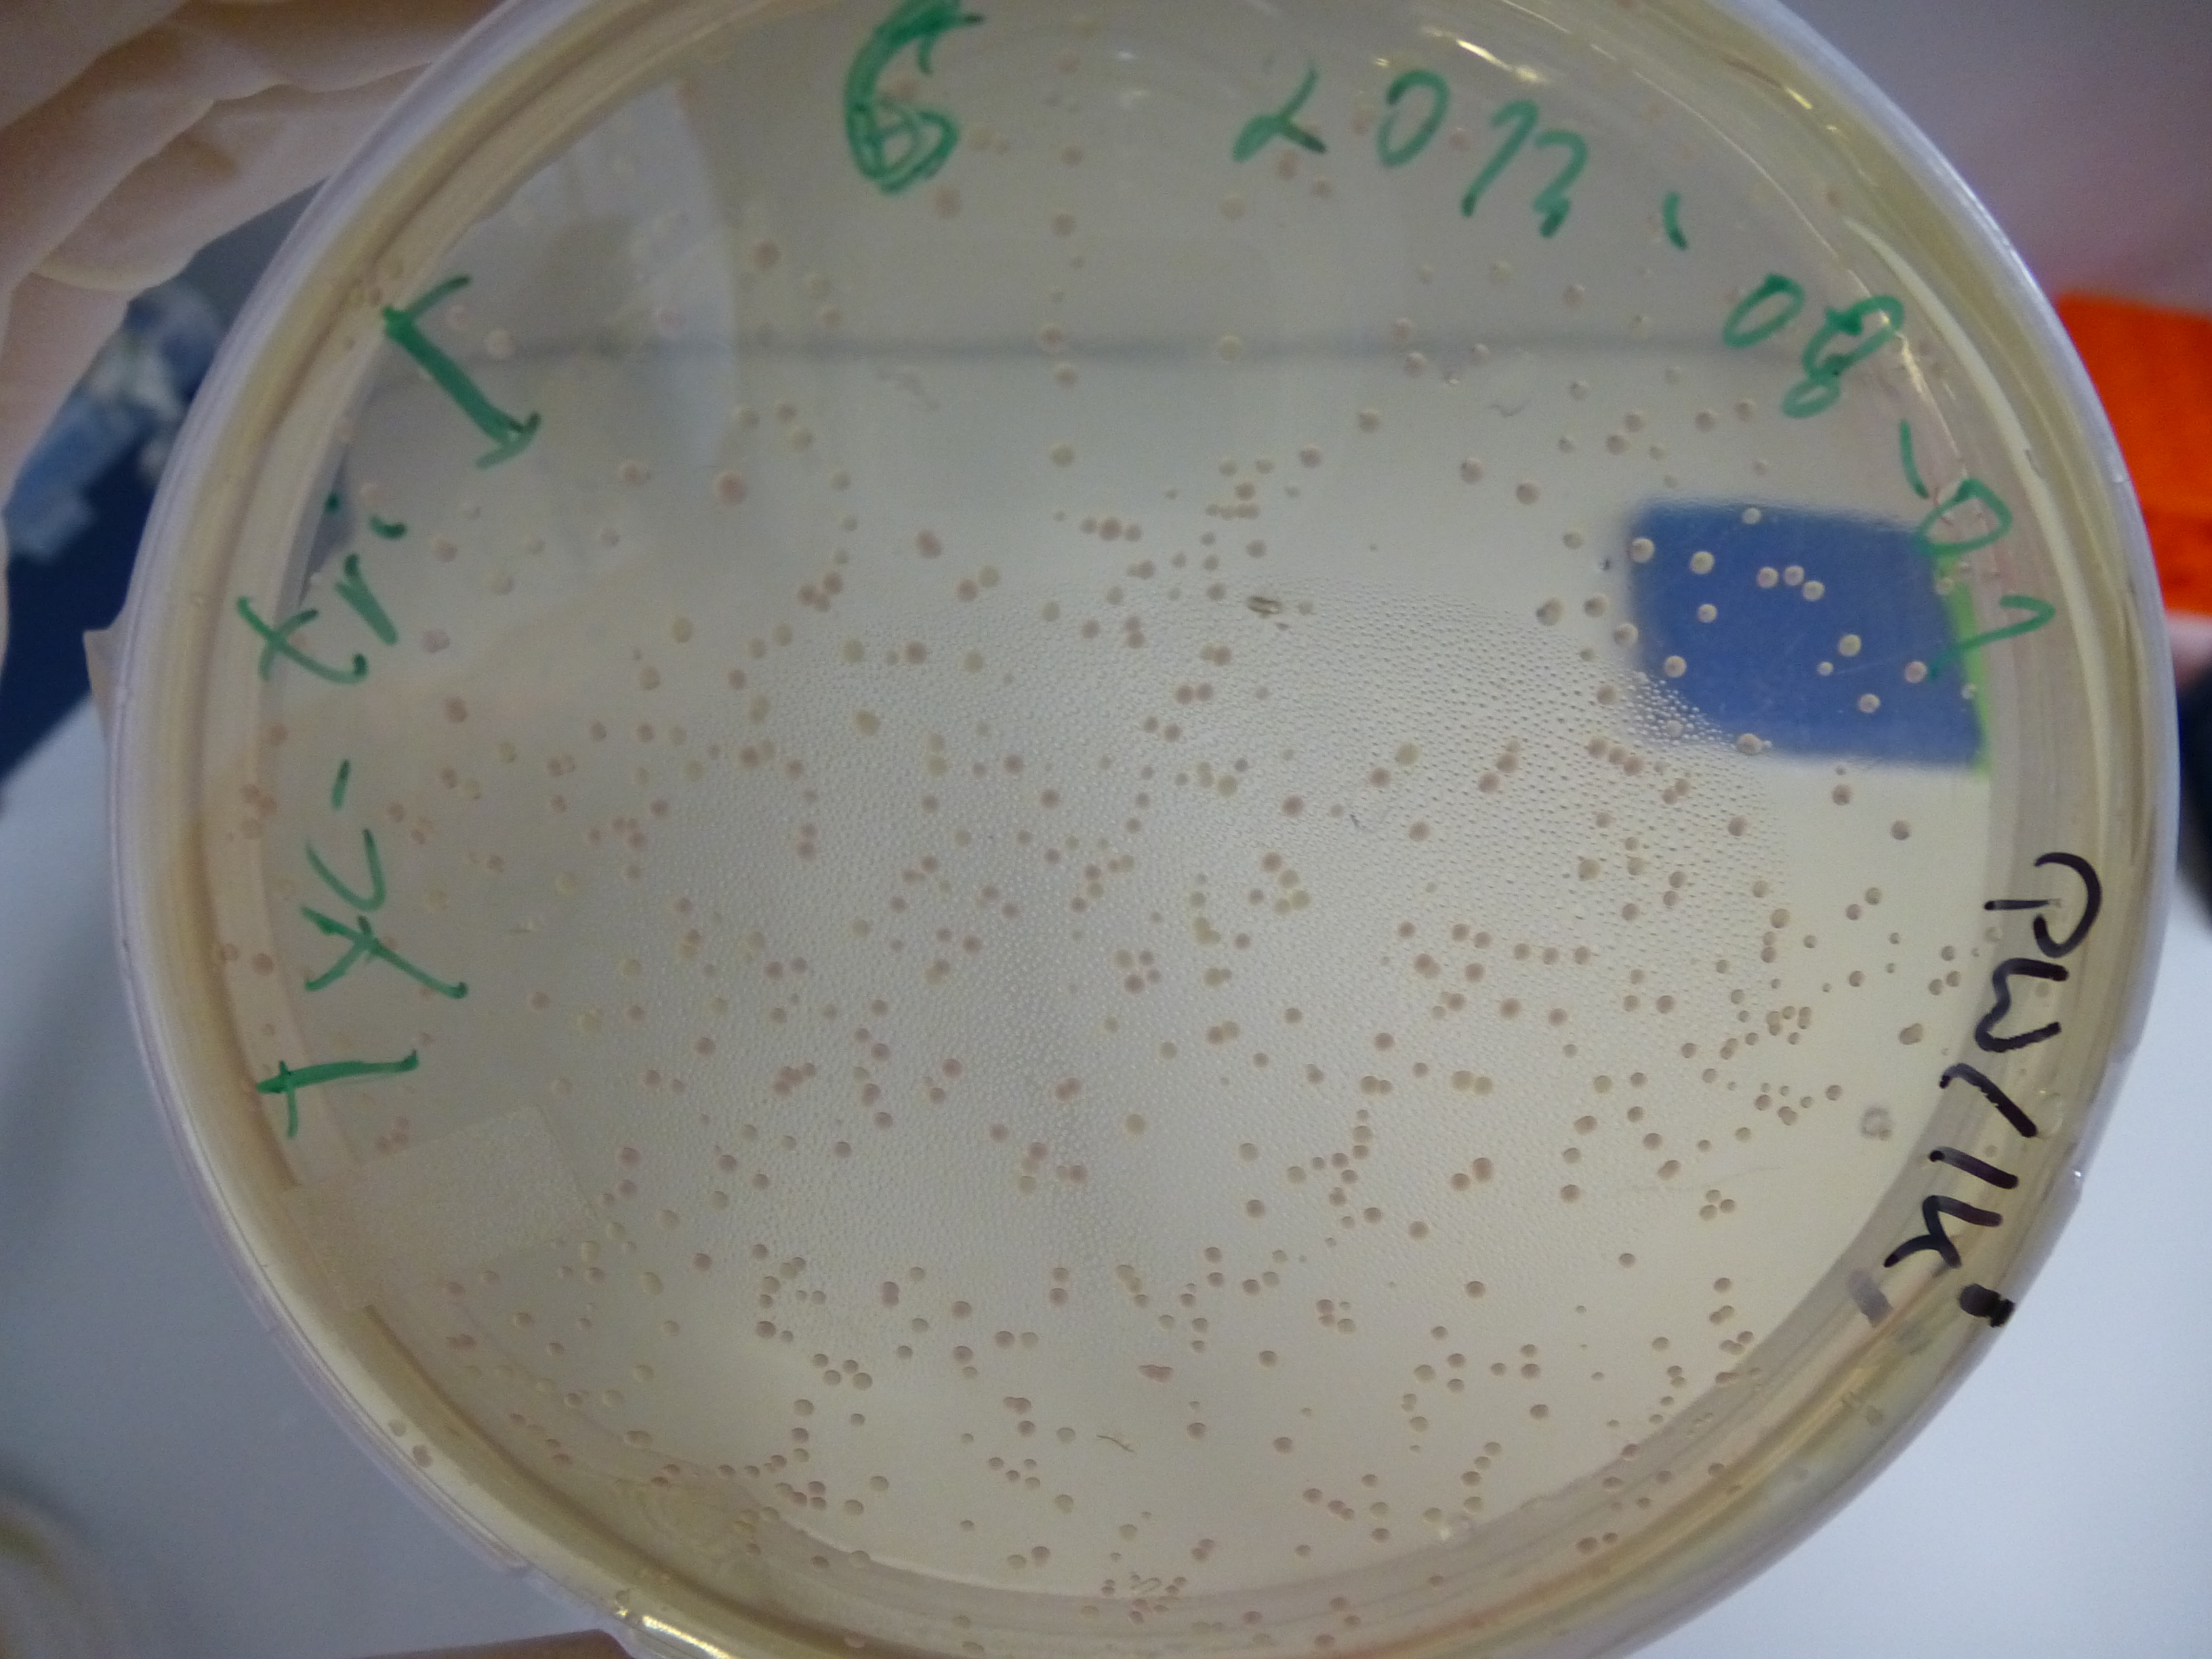
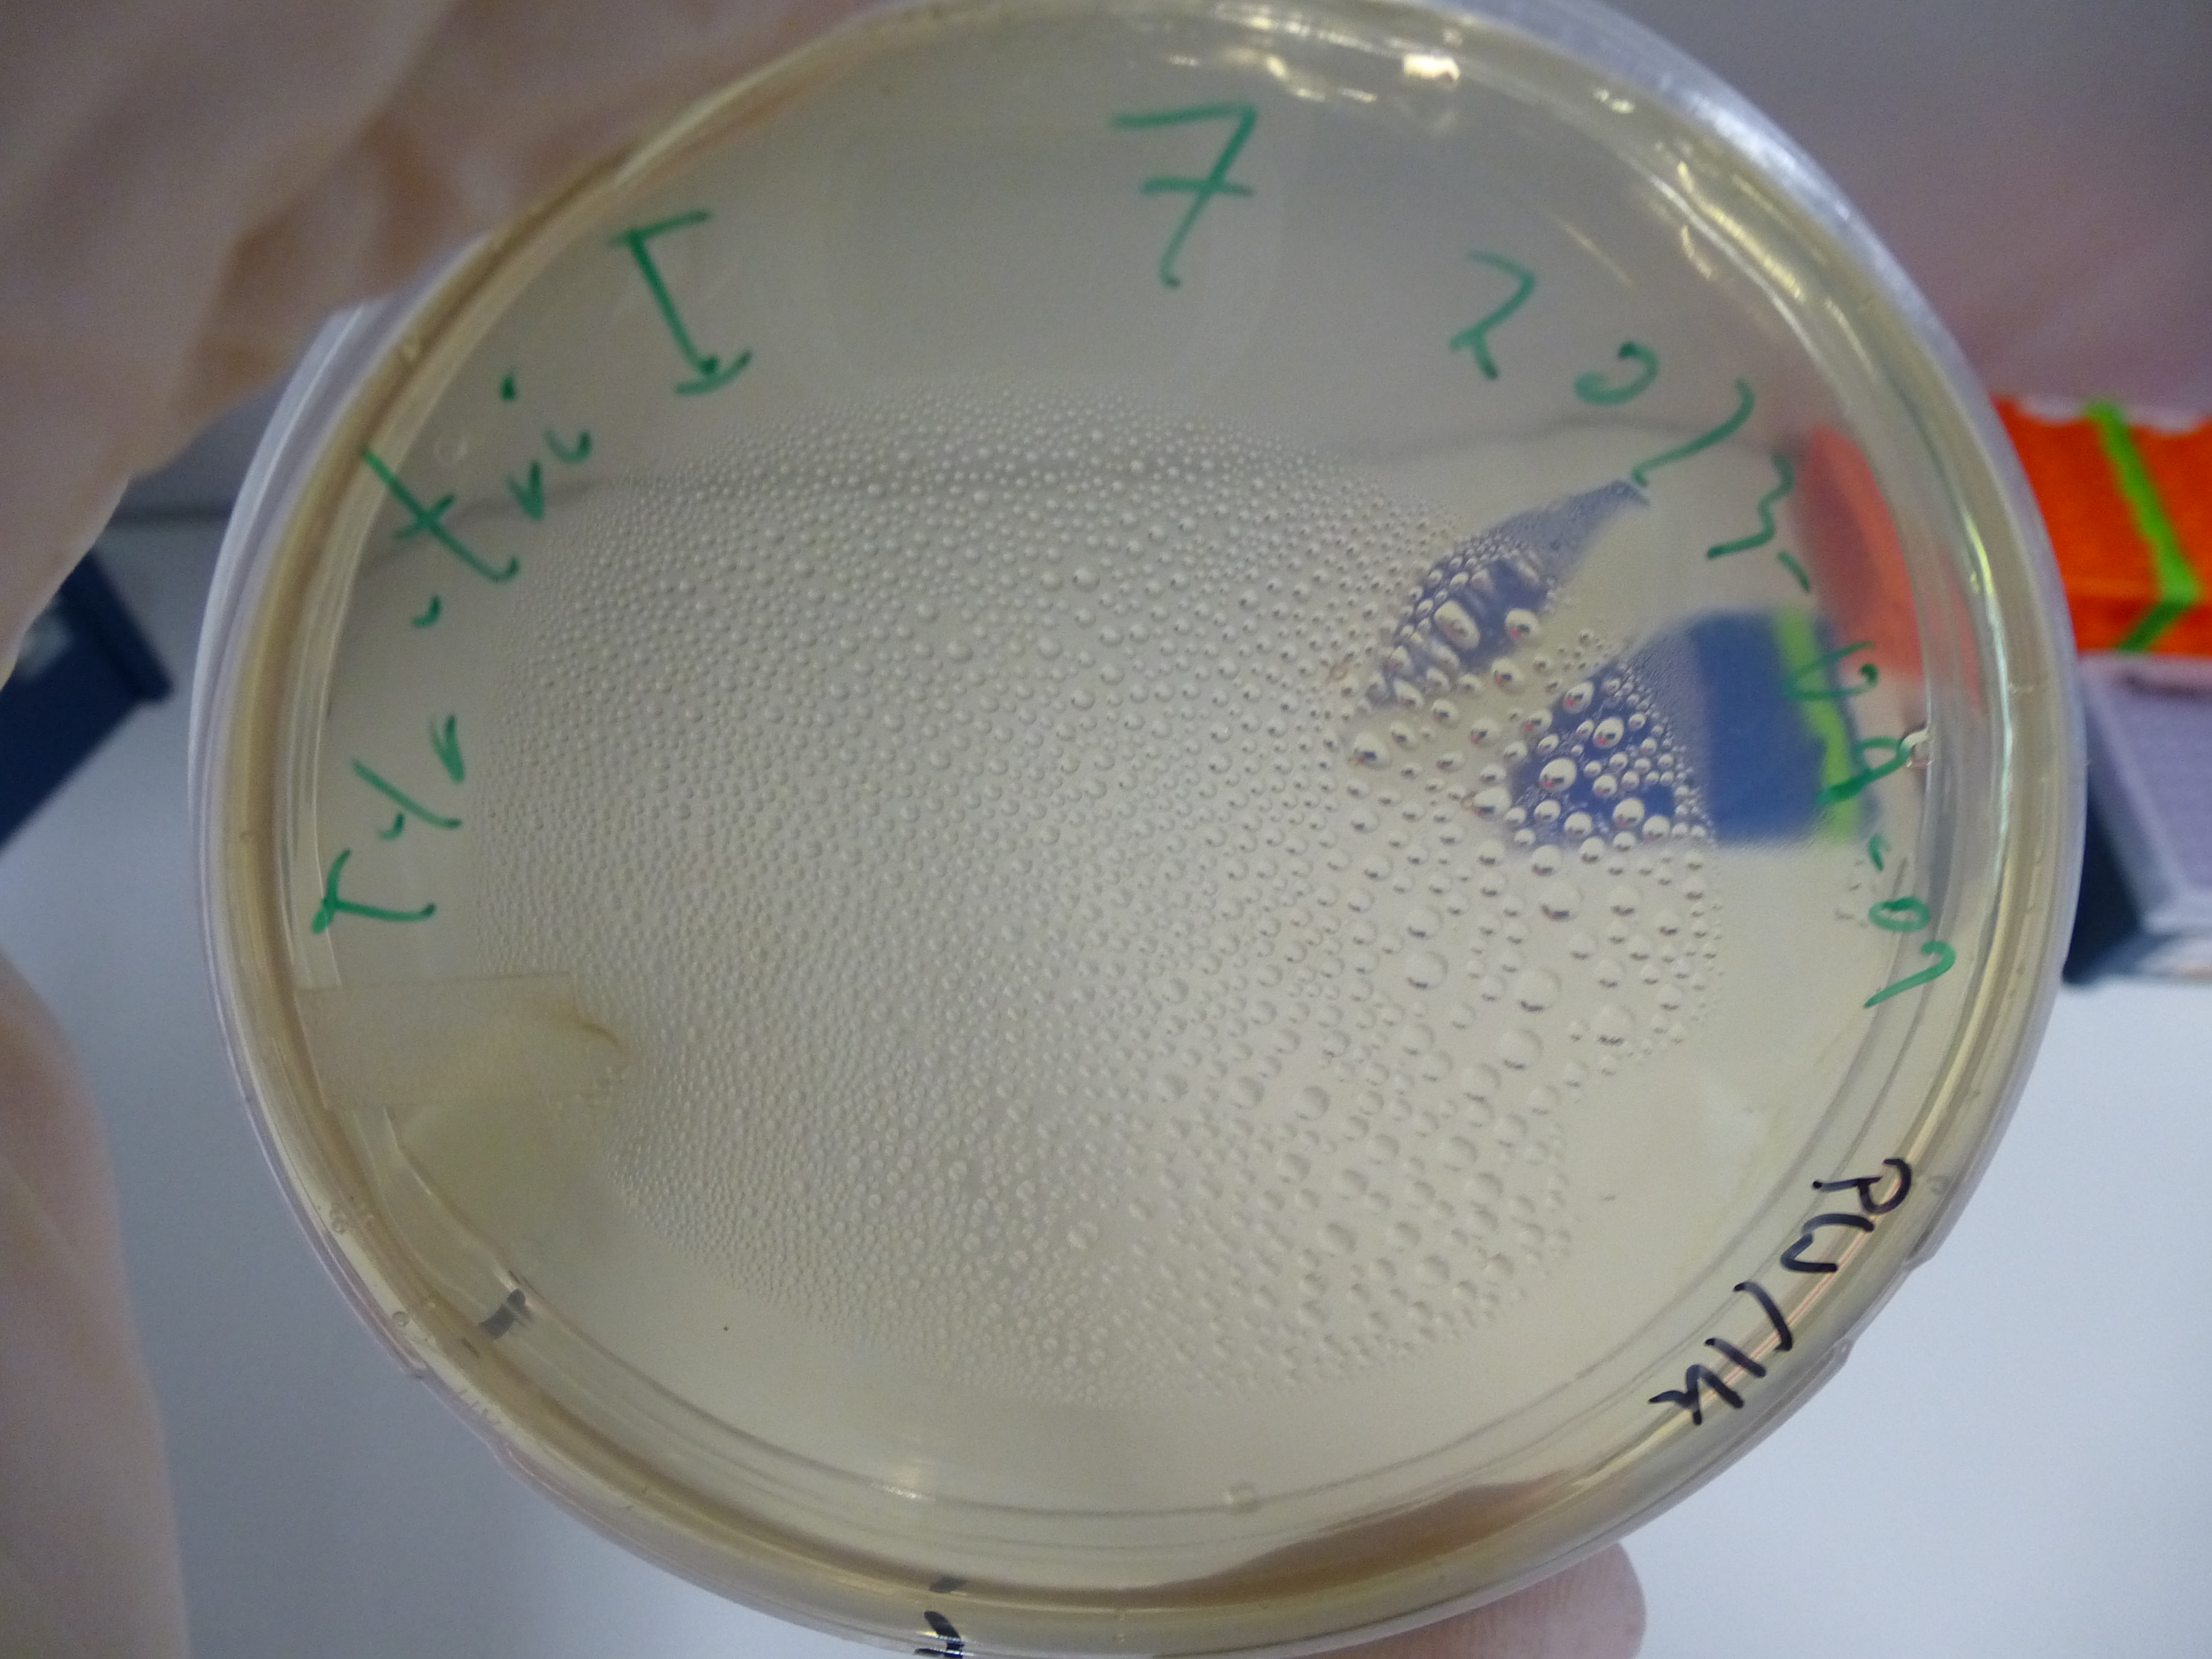
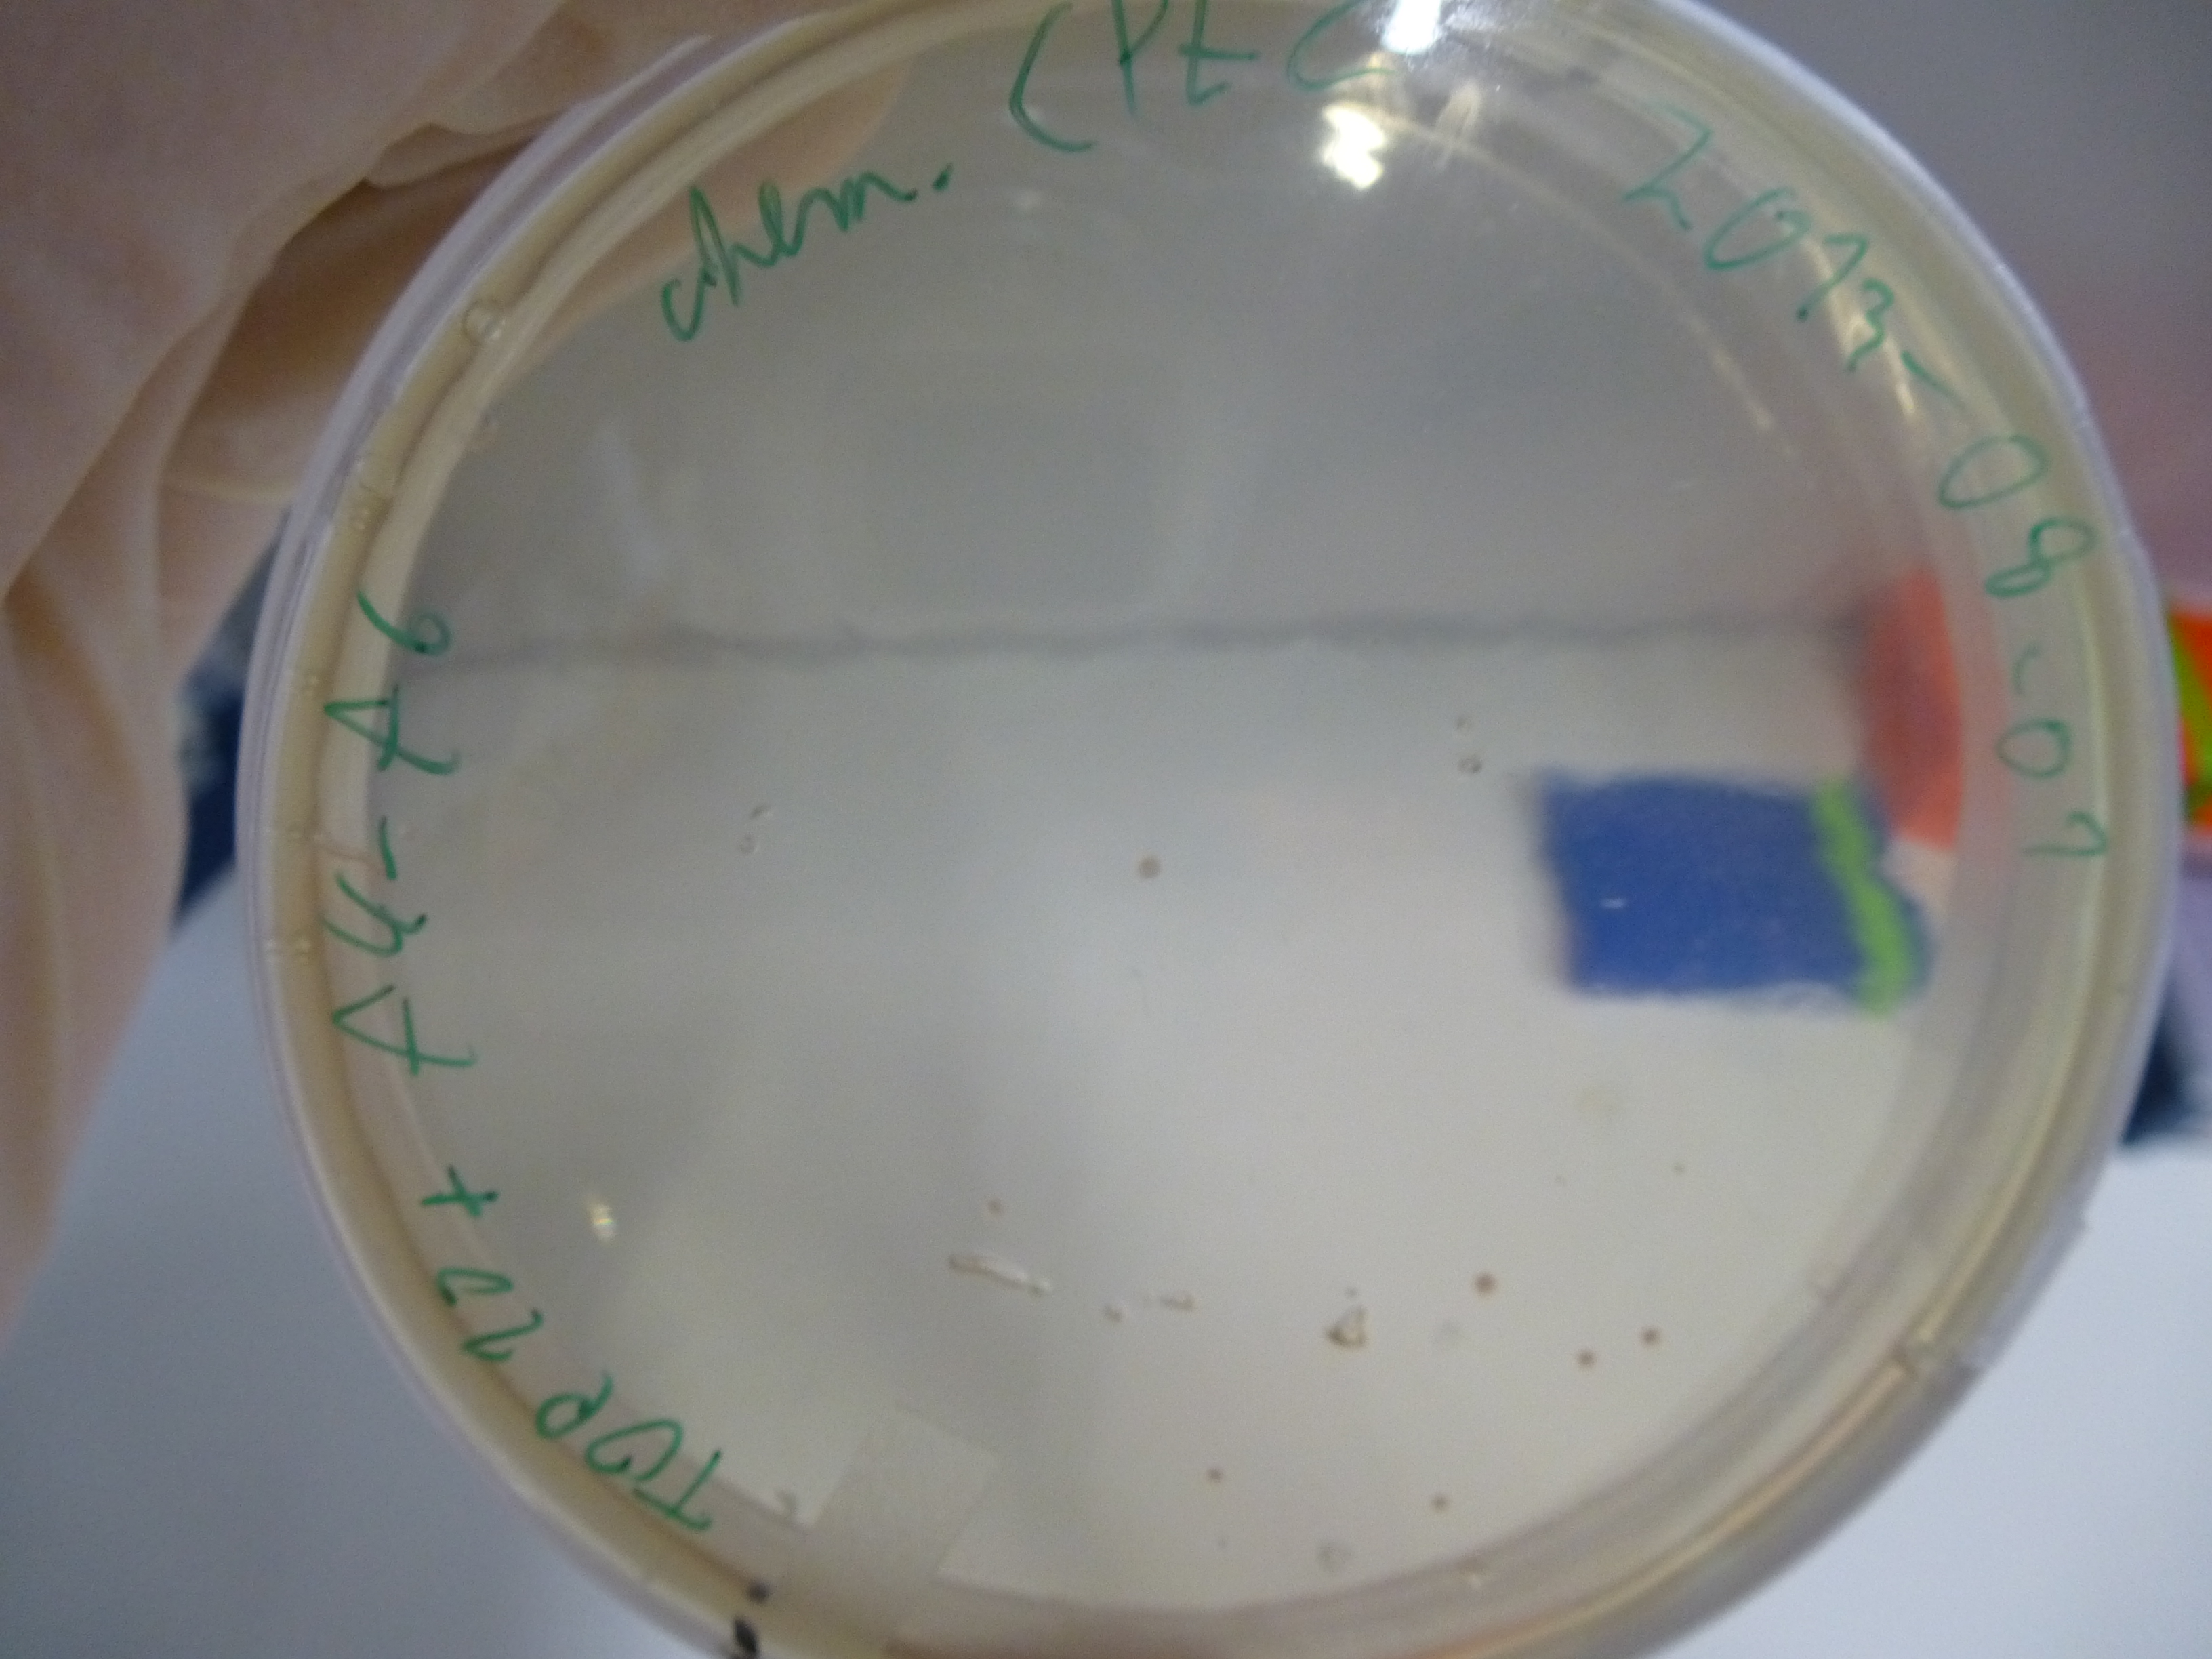
- evaluation of the plates obtained by electroporation our first assembly our first assembly
- picking of colonies from positive plates
- 6 colonies were picked: 3 from plate 5 and 3 from plate 6
- plates:
- 1: Cloning with CPEC - Electroporation with cleaned up DNA
- 2: Cloning with CPEC - Electroporation with 1µl DNA + H2O
- 3: Cloning with CPEC - Electroporation with 14µl DNA + H2O
- 4: Cloning with Gibson - Electroporation with cleaned up DNA
- 5: Cloning with Gibson - Electroporation with 1µl DNA + H2O
- 6: Cloning with Gibson - Electroporation with 14µl DNA + H2O
- 7: Negative Control - Electroporation with H2O
- 8: Cloning with CPEC - Chemical Transformation
We noticed that we mixed up fragments 1 and 4 thus neither the Gibson nor the CPEC could have worked. We are going to repeat this step next week
Amplifications Round II
Fragment 3
3 IK12,15
| what | µl |
|---|---|
| fw primer | 2 |
| rv primer | 2 |
| Bacillus | 1 |
| Phusion 2x Master mix | 10 |
| DMSO | 1 |
| ddH20 | 4 |
| Cycles | temperature [°C] | Time [min:s] |
|---|---|---|
| 1 | 98 | 2:00 |
| 35 | 98 | 0:01 |
| 65 | 0:05 | |
| 72 | 1:00 | |
| 1 | 72 | 3:00 |
| 1 | 12 | inf |
Fragment 6
primer: IK18 & IK12
| what | µl |
|---|---|
| fw primer | 2 |
| rv primer | 2 |
| Bacillus | 1 |
| Q5 2x Master mix | 10 |
| ddH20 | 5 |
| Cycles | temperature [°C] | Time [min:s] |
|---|---|---|
| 1 | 98 | 2:00 |
| 35 | 98 | 0:05 |
| 66 | 0:15 | |
| 72 | 3:00 | |
| 1 | 72 | 10:00 |
| 1 | 12 | inf |
Fragment 8
primer: IK20 & IK12
| what | µl |
|---|---|
| fw primer | 2 |
| rv primer | 2 |
| Bacillus | 1 |
| Q5 2x Master mix | 10 |
| ddH20 | 5 |
| Cycles | temperature [°C] | Time [min:s] |
|---|---|---|
| 1 | 98 | 2:00 |
| 35 | 98 | 0:05 |
| 66 | 0:15 | |
| 72 | 3:00 | |
| 1 | 72 | 10:00 |
| 1 | 12 | inf |
Fragment 12
12 PW09,10
| what | µl |
|---|---|
| fw primer | 2 |
| rv primer | 2 |
| Bacillus | 1 |
| Phusion Flash 2x Master mix | 10 |
| DMSO | 1 |
| ddH20 | 4 |
| Cycles | temperature [°C] | Time [min:s] |
|---|---|---|
| 1 | 98 | 2:00 |
| 35 | 98 | 0:01 |
| 65 | 0:05 | |
| 72 | 1:00 | |
| 1 | 72 | 3:00 |
| 1 | 12 | inf |
Amplifications Round III
- Reamplification of fragments 3, 6, 8, 11, 12, 13 & 15
- Primers used:
- fragment 3: IK15 & IK12
- fragment 6: IK18 & IK12
- fragment 8: IK20 & IK12
- fragment 11: PW07 & PW08
- fragment 12: PW09 & PW10
- fragment 13: PW11 & IK12
- fragment 15: PW13 & IK12
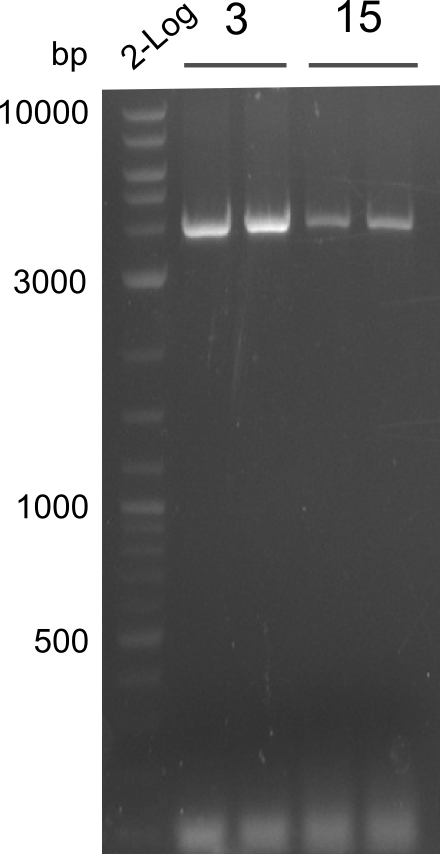
OPTIMIZATION FOR FRAGMENTS 3 & 15 NEEDED, all other fragments obtained
- PCRs of Fragments 3 and 15 with phusion flash. T100.
fragment 3: IK15+IK12 fragments 15: IK12+PW13
| what | µl |
|---|---|
| fw primer | 2 |
| rv primer | 2 |
| Bacillus | 1 |
| Phusion 2x Master mix | 10 |
| DMSO | 1 |
| ddH20 | 4 |
| Cycles | temperature [°C] | Time [s] |
|---|---|---|
| 1 | 98 | 2:00 |
| 12 | 98 | 0:05 |
| 66↓0.5°C | 0:05 | |
| 72 | 2:30 | |
| 23 | 98 | 0:05 |
| 64 | 0:10 | |
| 72 | 2:30 | |
| 1 | 72 | 10:00 |
| 1 | 10 | inf |
- gel-extraction of fragments 6, 8, 11, 12 & 13 using long fragment kit
DNA Concentration Measurement
- Quantification Gel of Gibson Assembly Colony Minipreps and fragments 6,8,11,12,13
| fragment | concentration [ng/µl] |
|---|---|
| 6 | 6.5 |
| 8 | 5 |
| 11 | 3 |
| 12 | 2 |
| 13 | 7 |
- Gel extraction of fragments 3, 15 and the two unknown samples in the freezer
- Quantification gel of those two fragments
- unfortunately the quantification gel did not show any usable concentrations
- --> reamplification of fragments 3 & 15 - and, as yield was low of fragments 11 & 12
Fragment 3
fragment 3: IK15+IK12 fragments 15: IK12+PW13
| what | µl |
|---|---|
| fw primer | 2 |
| rv primer | 2 |
| Bacillus | 1 |
| Phusion Flash 2x Master mix | 10 |
| DMSO | 1 |
| ddH20 | 4 |
| Cycles | temperature [°C] | Time [s] |
|---|---|---|
| 1 | 98 | 2:00 |
| 12 | 98 | 0:05 |
| 66↓0.5°C | 0:05 | |
| 72 | 2:30 | |
| 23 | 98 | 0:05 |
| 64 | 0:10 | |
| 72 | 2:30 | |
| 1 | 72 | 10:00 |
| 1 | 10 | inf |
Fragment 11
11 PW07,08
| what | µl |
|---|---|
| fw primer | 2 |
| rv primer | 2 |
| Bacillus | 1 |
| Q5 2x Master mix | 10 |
| ddH20 | 5 |
| Cycles | temperature [°C] | Time [min:s] |
|---|---|---|
| 1 | 98 | 2:00 |
| 35 | 98 | 0:05 |
| 69 | 0:15 | |
| 72 | 2:30 | |
| 1 | 72 | 10:00 |
| 1 | 12 | inf |
Fragment 12
12 PW09,10
| what | µl |
|---|---|
| fw primer | 2 |
| rv primer | 2 |
| Bacillus | 1 |
| Phusion Flash 2x Master mix | 10 |
| DMSO | 1 |
| ddH20 | 4 |
| Cycles | temperature [°C] | Time [min:s] |
|---|---|---|
| 1 | 98 | 2:00 |
| 35 | 98 | 0:01 |
| 65 | 0:05 | |
| 72 | 1:00 | |
| 1 | 72 | 3:00 |
| 1 | 12 | inf |
Fragment 15
fragments 15: IK12+PW13
| what | µl |
|---|---|
| fw primer | 2 |
| rv primer | 2 |
| Bacillus | 1 |
| Phusion Flash 2x Master mix | 10 |
| DMSO | 1 |
| ddH20 | 4 |
| Cycles | temperature [°C] | Time [s] |
|---|---|---|
| 1 | 98 | 2:00 |
| 12 | 98 | 0:05 |
| 66↓0.5°C | 0:05 | |
| 72 | 2:30 | |
| 23 | 98 | 0:05 |
| 64 | 0:10 | |
| 72 | 2:30 | |
| 1 | 72 | 10:00 |
| 1 | 10 | inf |
Results Amplification Round III
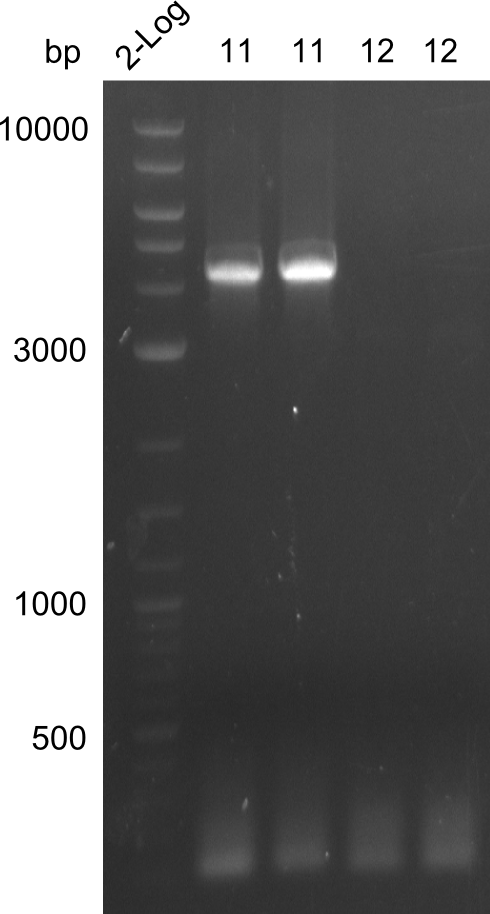
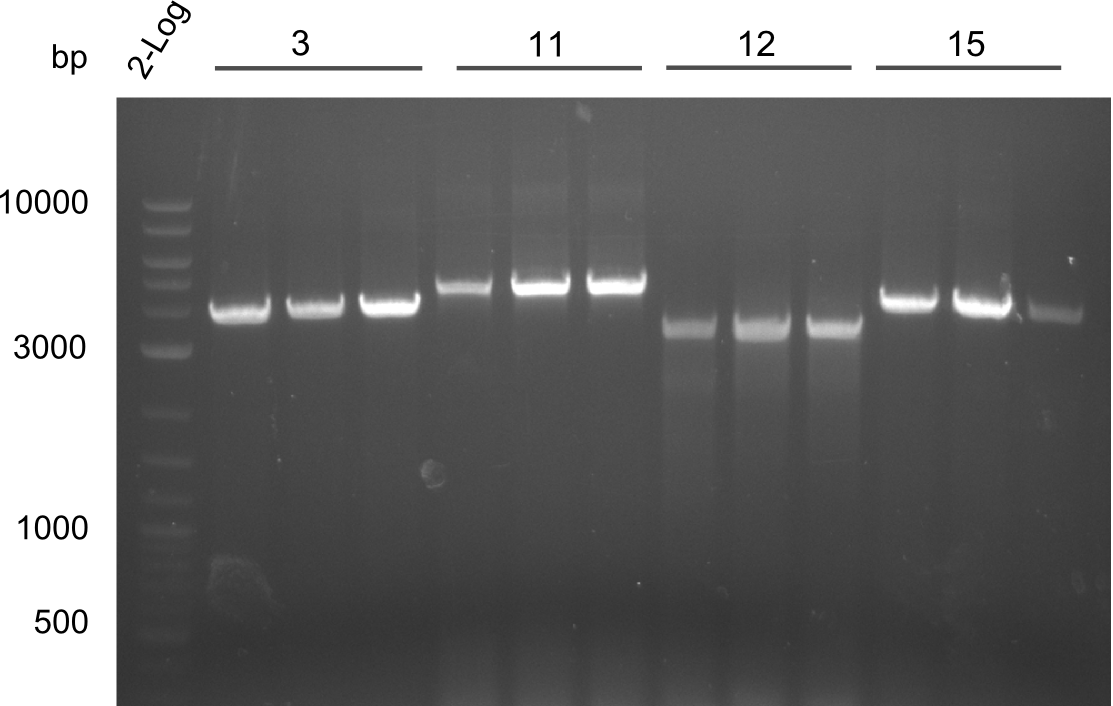
- Samples of Amplification Round III (fragments 3, 11, 12 & 13) were run on gel
- gelextraction
DNA concentrations of fragments
Analysis of DNA concentration
- Concentrations obtained through quantification gel. There are 20µl of all fragments.
| fragment | concentration [ng/µl] |
|---|---|
| 3 | 2 |
| 11 | 3 |
| 13 | 7 |
| 15 | -- |
| 3 | 35 |
| 11 | 10 |
| 12 | 10 |
| 15 | 20 |
Complete List of DNA concentrations of all fragments
| fragment | concentration [ng/µl] |
|---|---|
| 1 | 10 (25.7.), 30 (28.7.) |
| 2 | 16 (25.7.), 12 (31.7.) |
| 3 | 35 (04.8.) |
| 4 | 32 (24.7.), 30 (28.7.) |
| 5 | 12 (26.7.), 14 (31.7.) |
| 6 | 8 (26.7.) (empty), 6.5 (03.8.) |
| 7 | 12 (27.7.), 18 (31.7.) |
| 8 | 8 (26.7.), 5 (03.8.) |
| 9 | 30 (28.7.) |
| 10 | 40 (28.7.) |
| 11 | 5 (31.7.), 10 (04.8.) |
| 12 | 10 (04.8.) |
| 13 | 20 (31.7.), 7 (03.8.) |
| 14 | 40 (28.7.) |
| 15 | 11 (31.7.), 20 (04.8.) |
Gibson Assembly
| fragments (10µL) + 10 µL Gibson Mix |
fragment date length
- 29.7 2500
- 29.7 2000
- 5.8. 4000
- 29.7 2500
- 29.7 3000
- 29.7 7000
- 31.7 2000
- 29.7 7000
- 29.7 2500
- 29.7 2000
- 5.8. 5000
- 5.8. 3000
- 31.7 4000
- 29.7 2000
- 5.8. 4000
Dipeptide
| fragment | concentration [ng/µl] | volume for gibson assembly [µL] |
|---|---|---|
| 1 | 30 | 3.14 |
| 2 | 16 | 4.71 |
| 3 | 35 | 2.15 |
Tripeptide I
| fragment | concentration [ng/µl] | volume for gibson assembly [µL] |
|---|---|---|
| 4 | 32 | 1.02 |
| 5 | 12 | 3.27 |
| 6 | 8 | 5.71 |
Tripeptide II
| fragment | concentration [ng/µl] | volume for gibson assembly [µL] |
|---|---|---|
| 4 | 32 | 1.25 |
| 7 | 18 | 1.77 |
| 8 | 8 | 6.98 |
Tetrapeptide II
| fragment | concentration [ng/µl] | volume for gibson assembly [µL] |
|---|---|---|
| 9 | 30 | 1.32 |
| 10 | 40 | 0.79 |
| 11 | 10 | 3.95 |
| 14 | 10 | 0.79 |
| 15 | 20 | 3.16 |
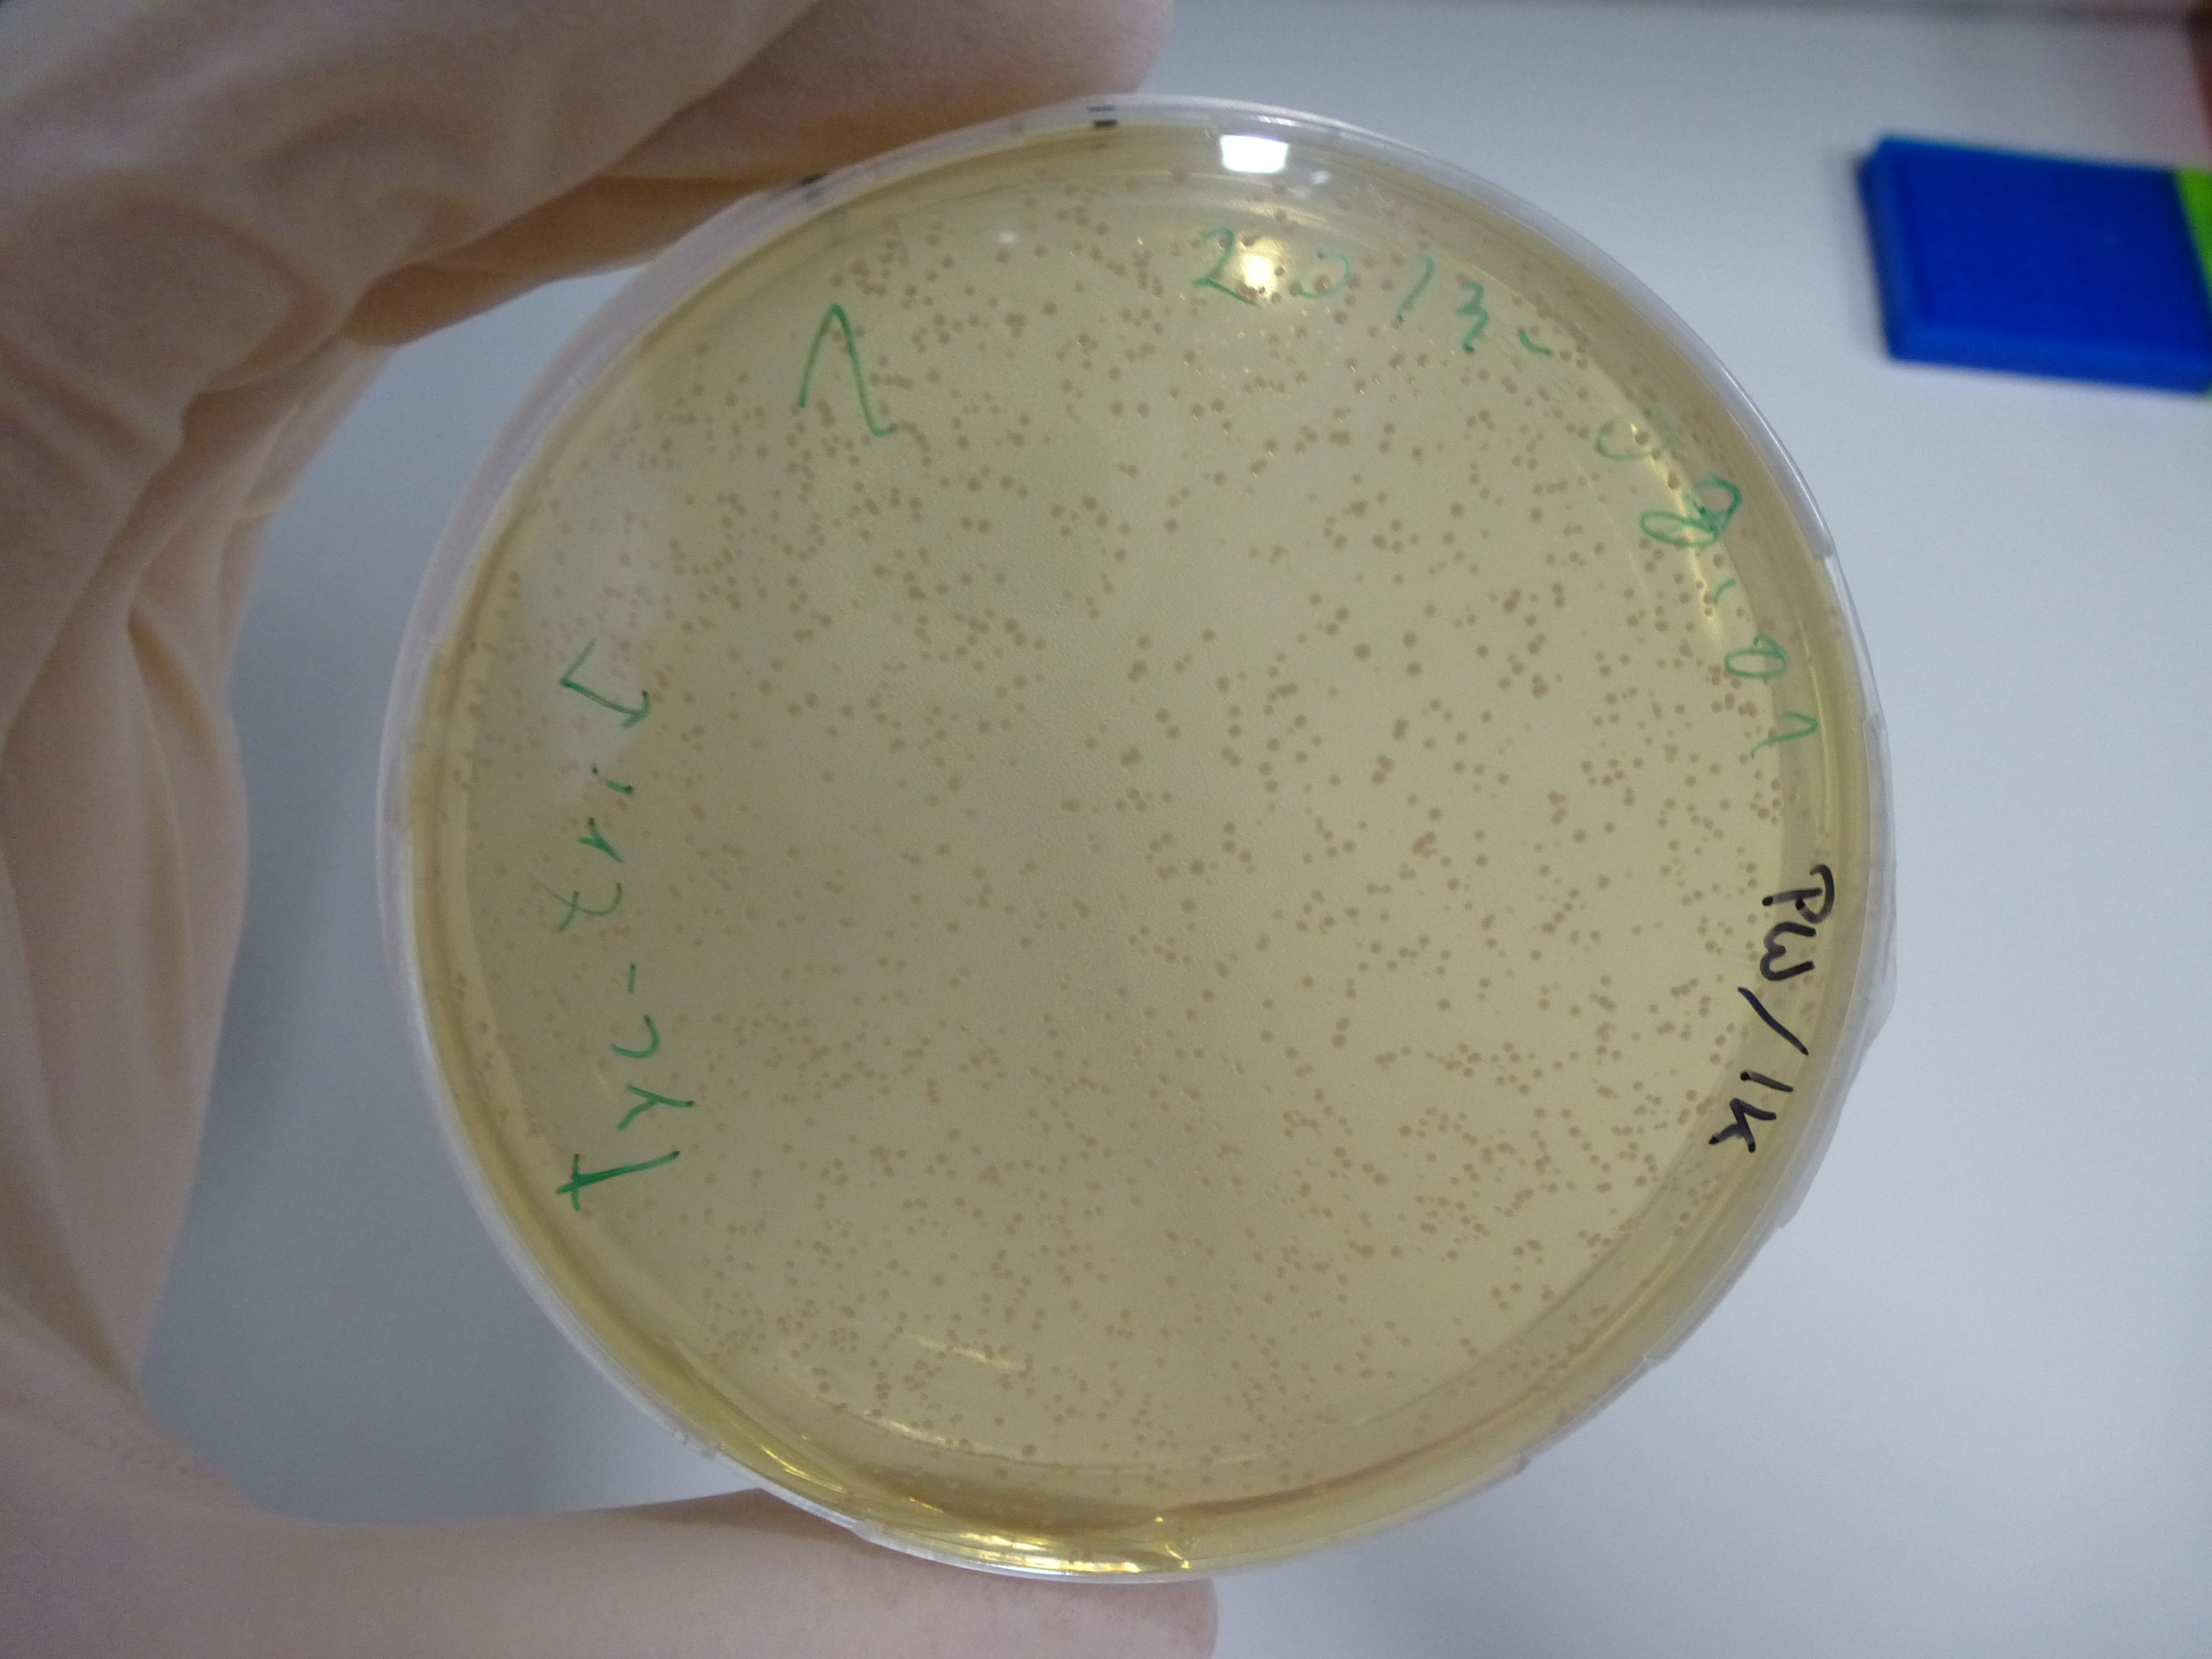
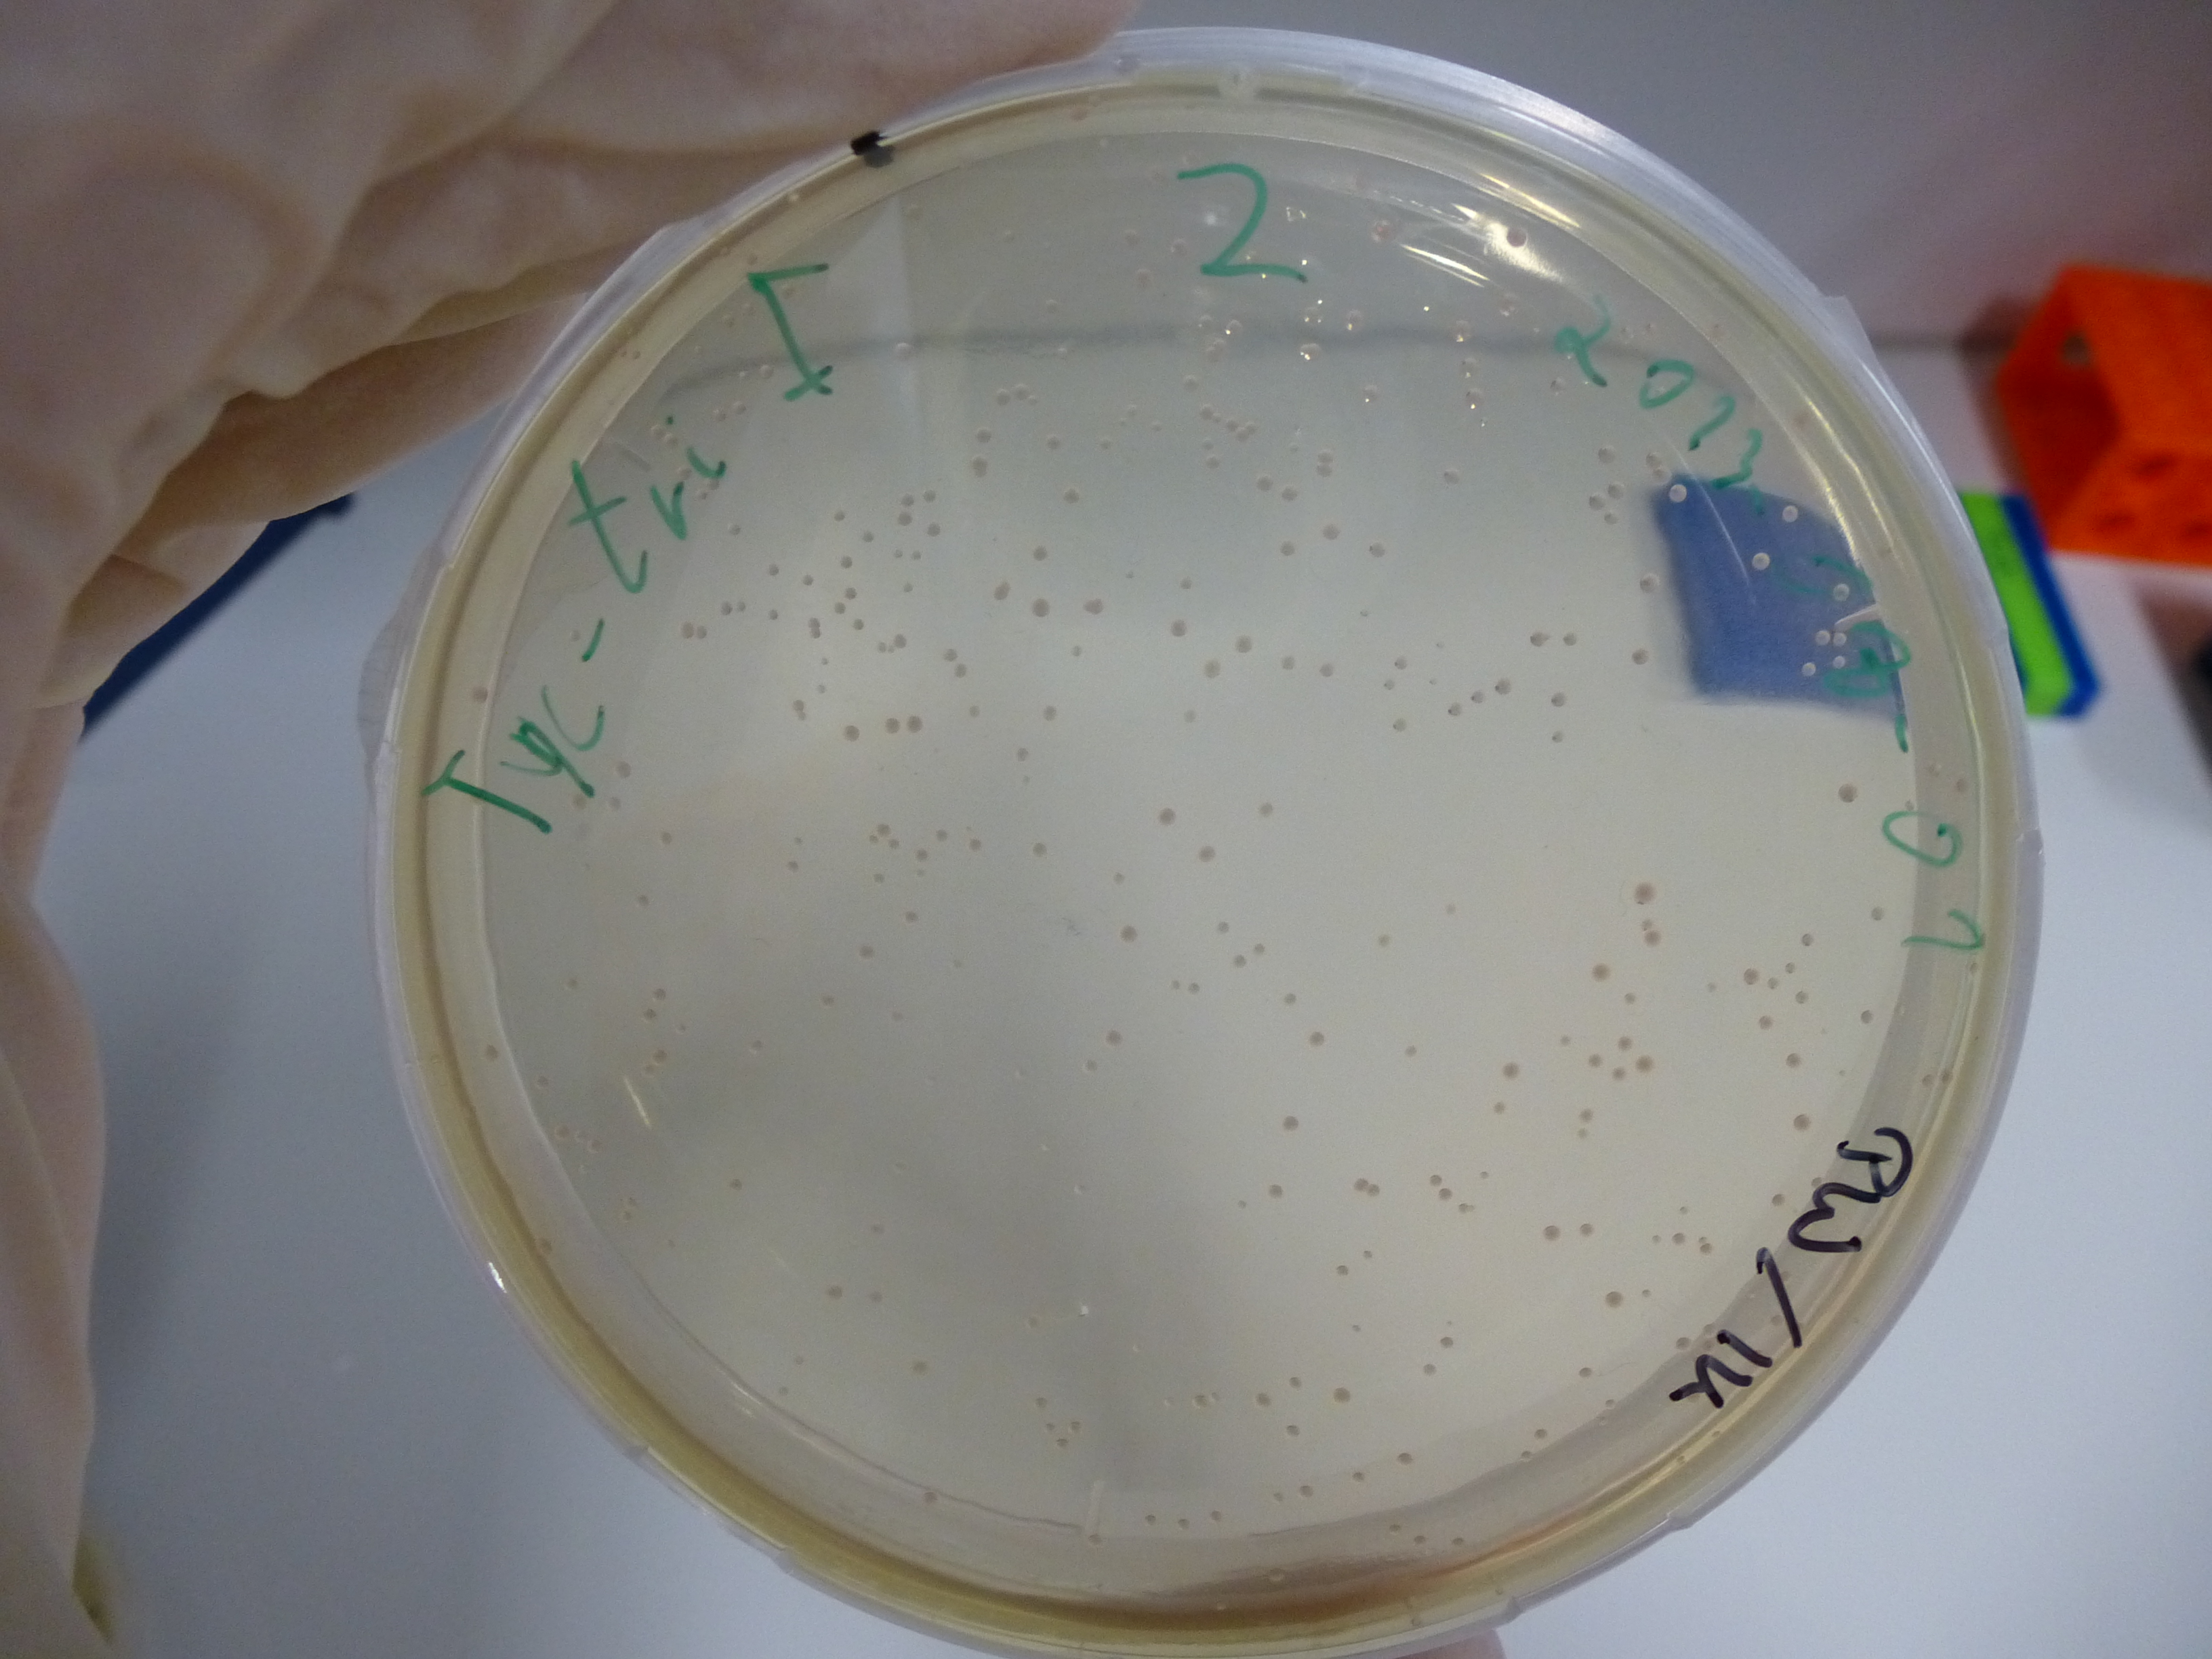
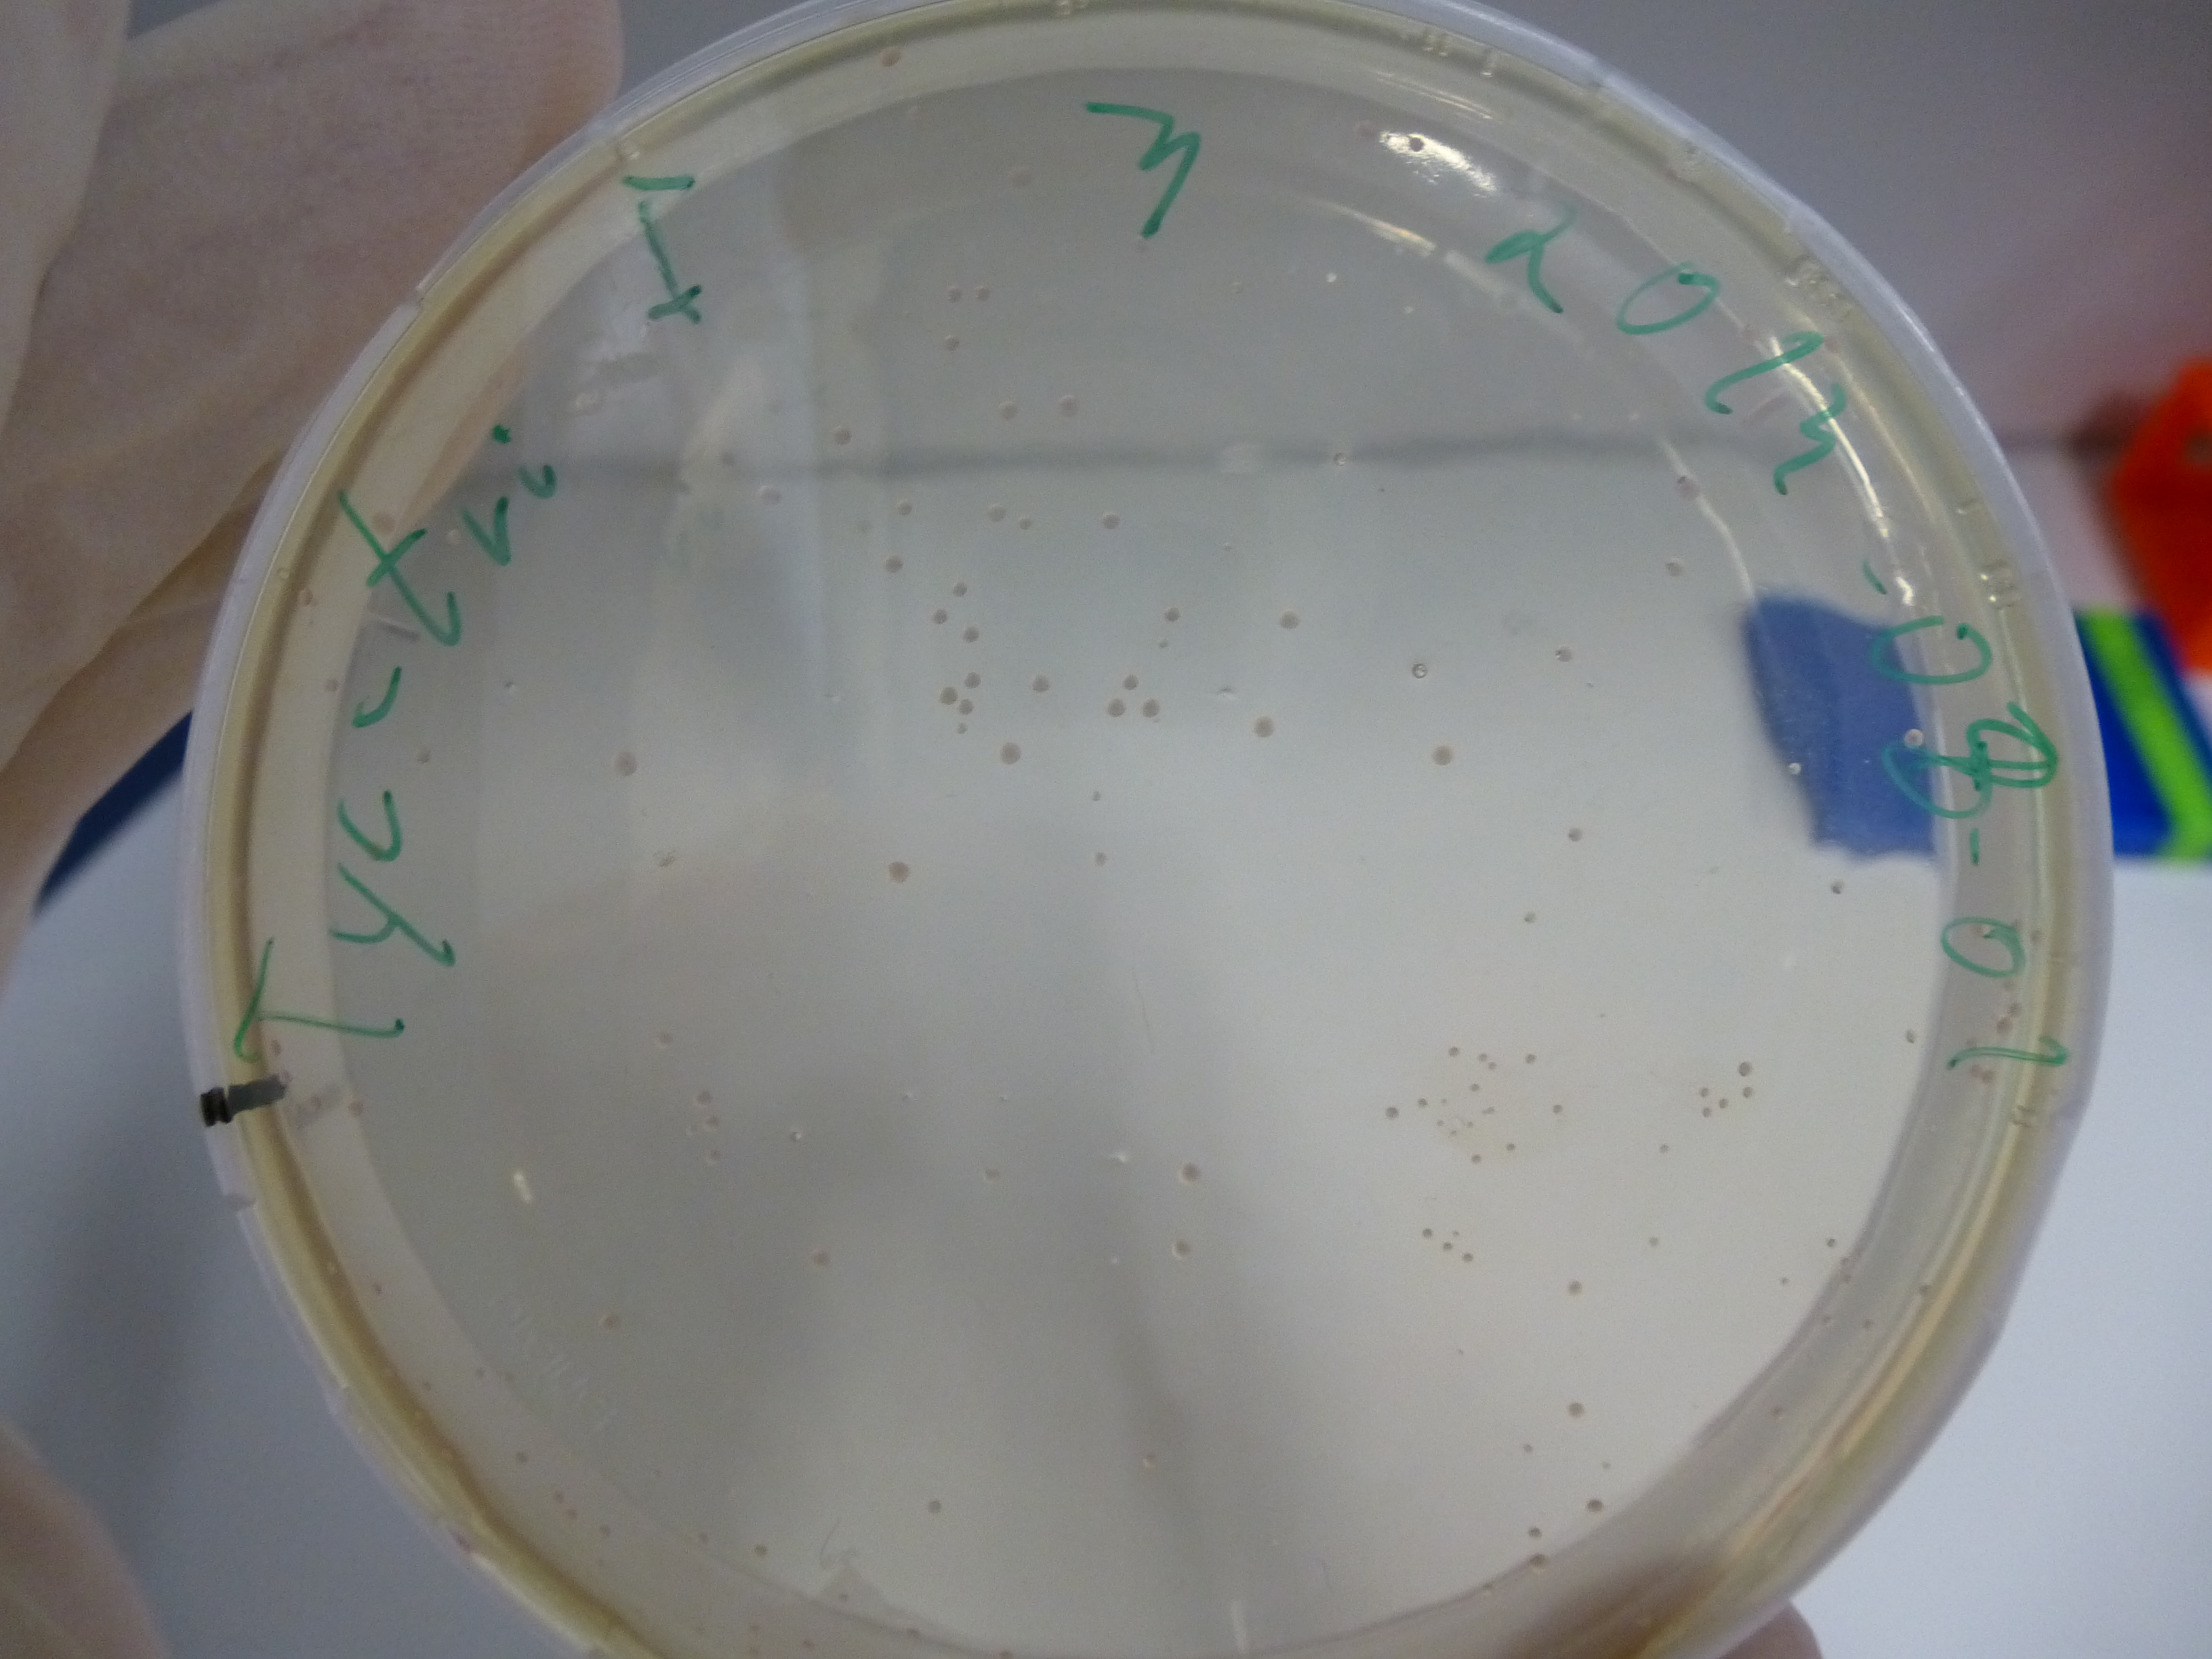
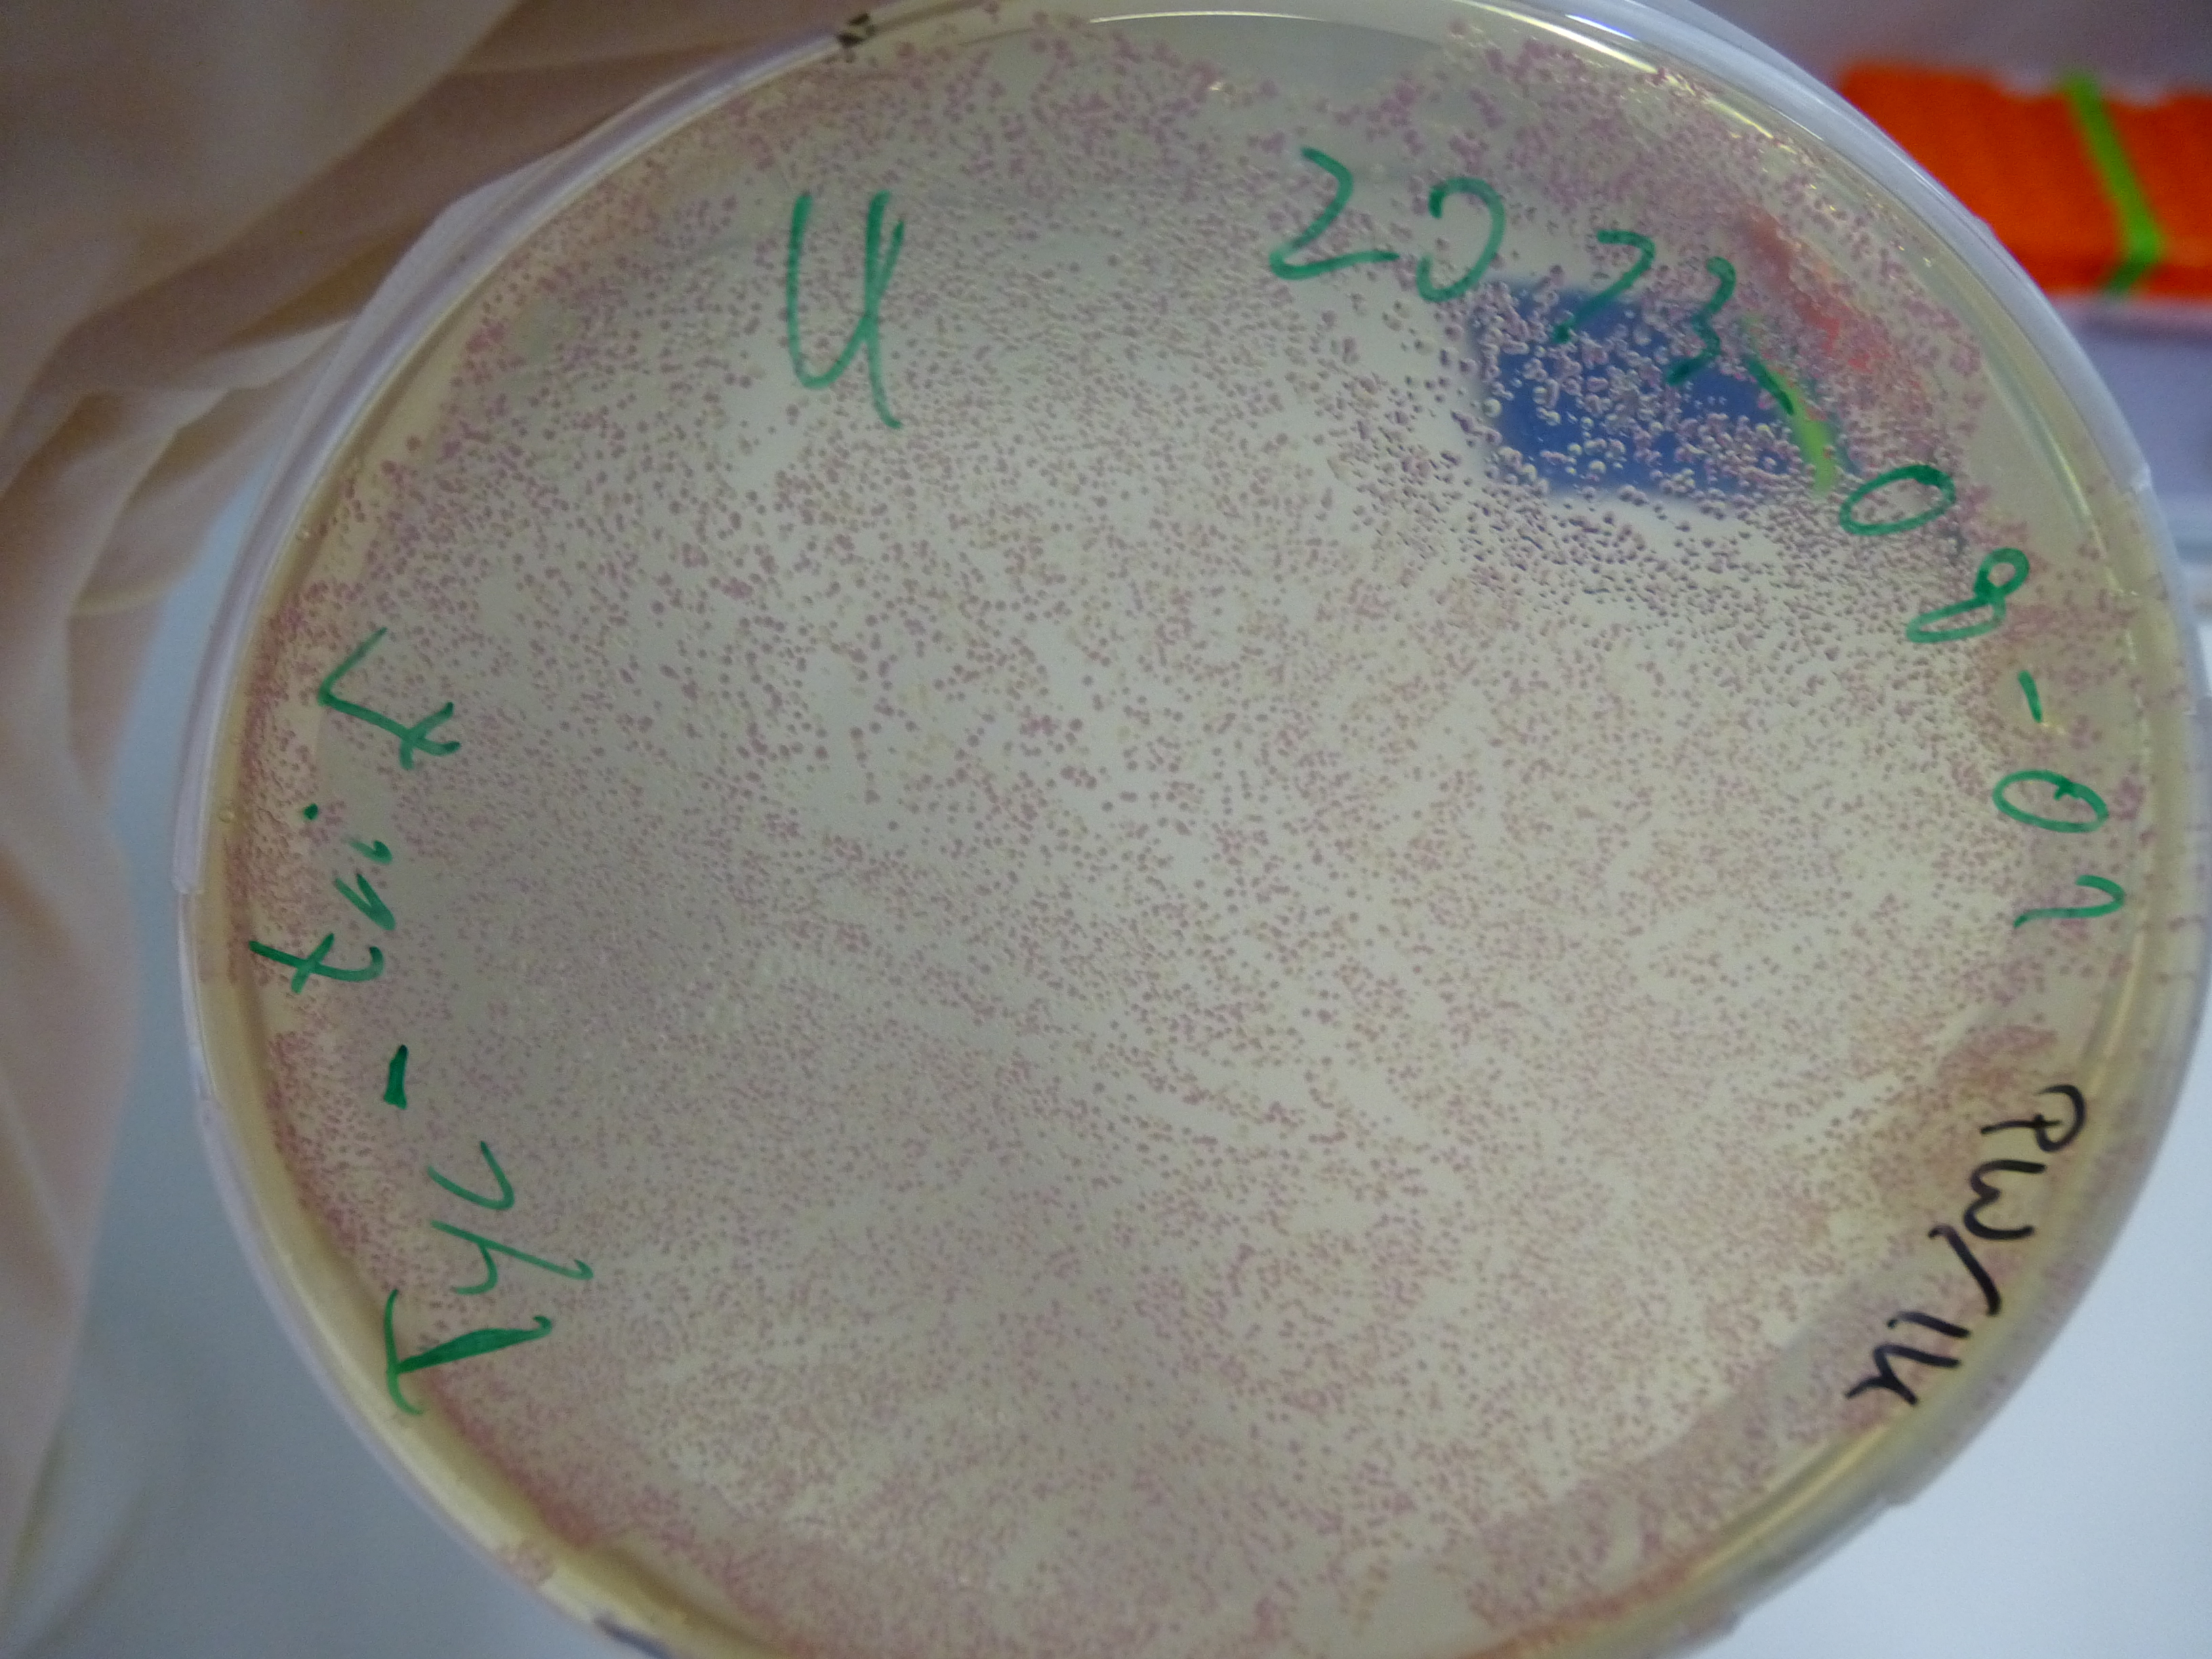
Pictures of plates
missing: Tetrapeptide I
| fragment | concentration [ng/µl] | volume for gibson assembly [µL] |
|---|---|---|
| 9 | 30 | 0.77 |
| 10 | 40 | 0.46 |
| 11 | 10 | 2.31 |
| 12 | 10 | 2.77 |
| 13 | 20 | 3.69 |
overview over Gibson constructs
Excel-Document with constructs, names, DNA-concentrations and important indications
Validation of Gibson Assembly
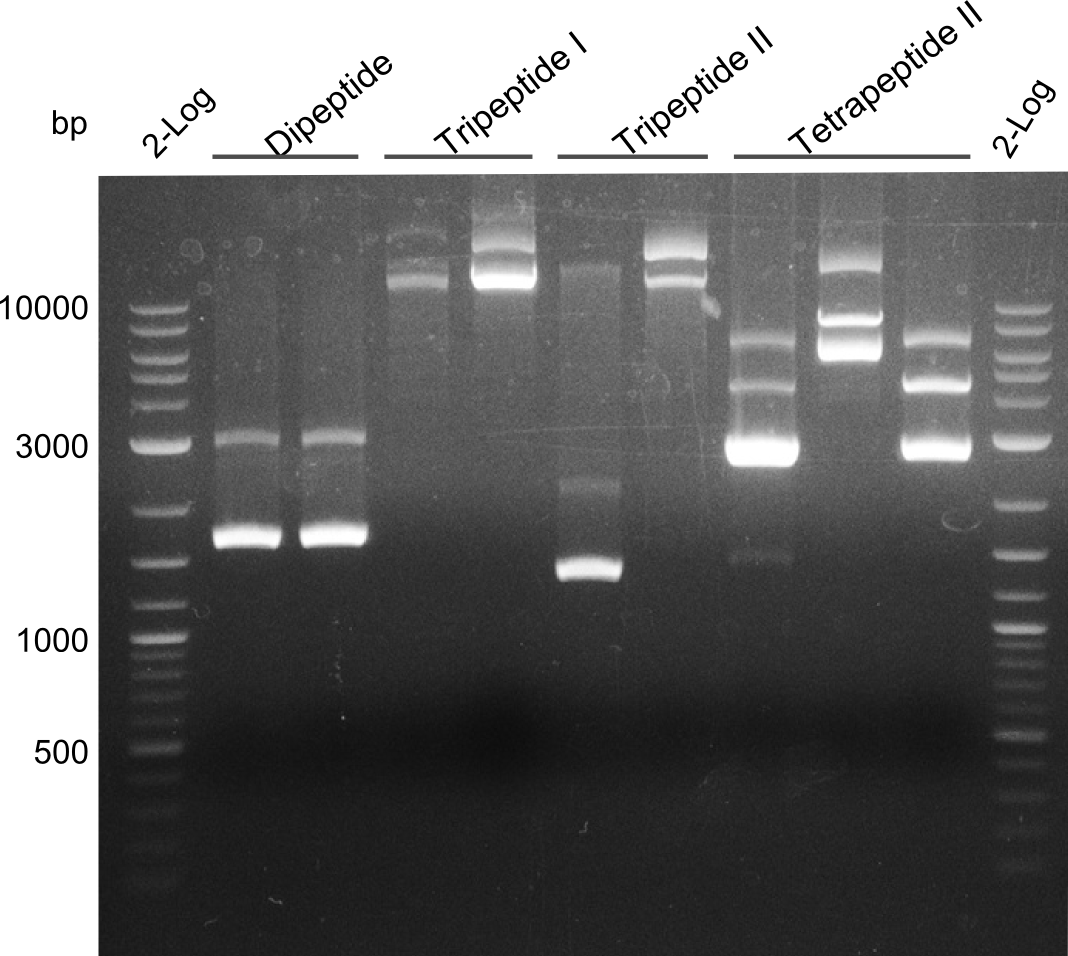
Restriction digest of Tripetide I, II and Tetrapeptide II
- Minipreps of colonies picked on 06.08.2013
- Restriction digest of DNA obtained by minipreps
- with NotI
- reamplifications of fragments 6 and 8 according to Protocol-page
- did not lead to any usable DNA-sample
| what | µl |
|---|---|
| DNA | 4 (~200-800ng) |
| Cutsmart Mix | 3 |
| Enzyme | 1 |
| ddH20 | ad 30 µl |
Results
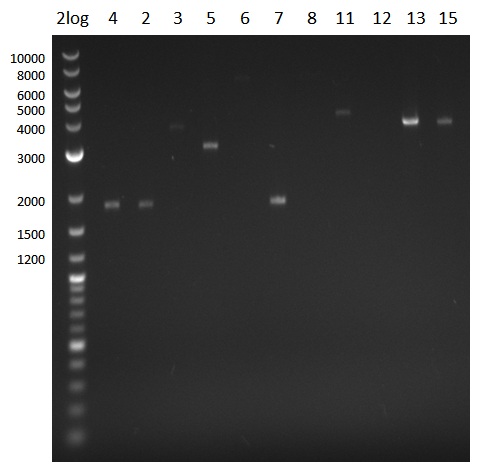
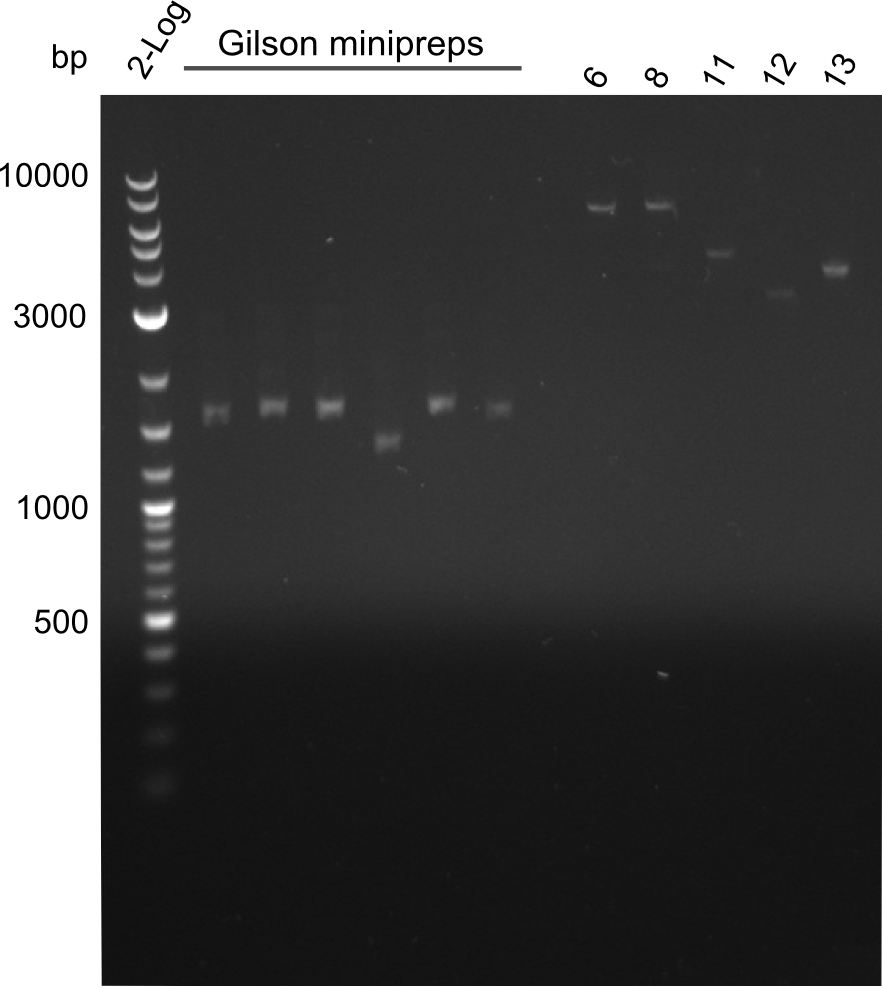
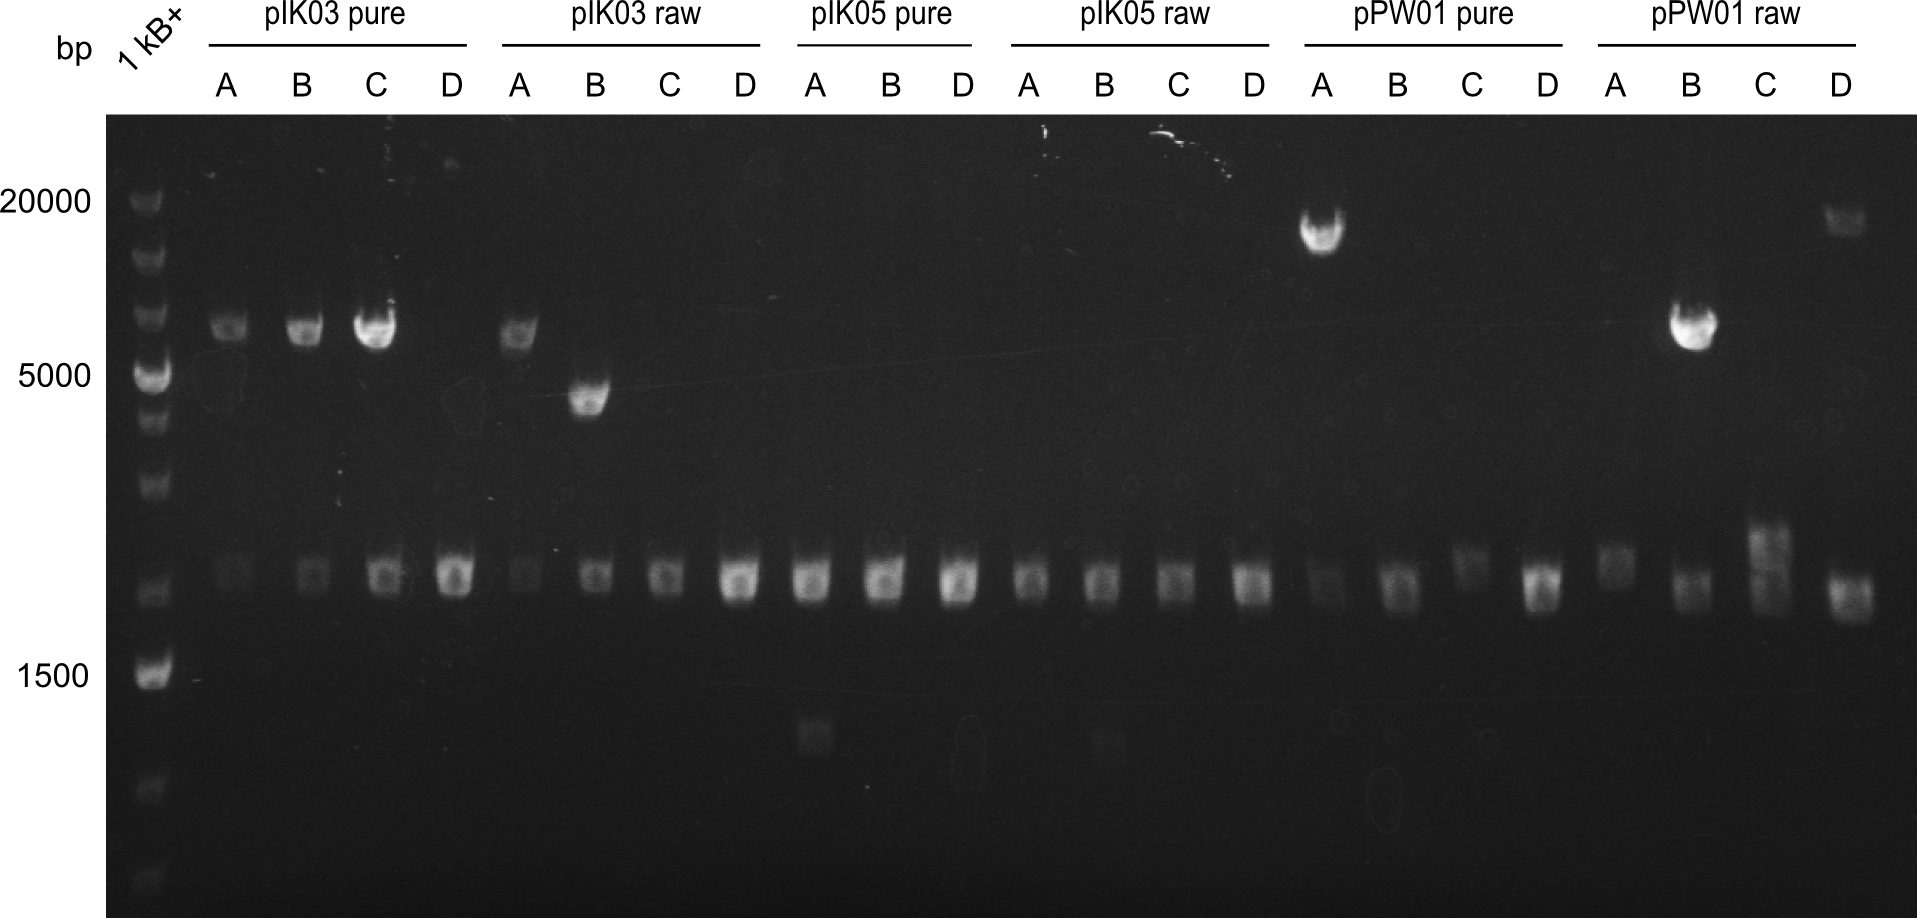
Gel-Picture taken on 07.08.2013. Different peptide constructs are annotated. For exact reference to picked colonies, see: our overview over our Gibson colonies
Restriction Digest of Tri- Di and Tetrapeptides
Restriction with MfeI and NotI was performed with samples from miniprep on 07.08.2013 that appeared positive:
| what | µl |
|---|---|
| DNA | 1200ng |
| Cutsmart Mix | 2 |
| Enzyme | 1 |
| ddH20 | ad 20 µl |
Gibson Assembly was performed with fragments needed for Tetrapeptide I according to the protocol described above.
| fragment | concentration [ng/µl] | volume for gibson assembly [µL] |
|---|---|---|
| 9 | 30 | 0.77 |
| 10 | 40 | 0.46 |
| 11 | 10 | 2.31 |
| 12 | 10 | 2.77 |
| 13 | 20 | 3.69 |
Results
As the observed bands were not expected, other colonies (Tripeptide I and II) were picked for further analysis. Samples will be send to sequencing (which????xxxxxxxxx).
Proving the results of Gibson Assembly
- Colonies from Gibson-Assembly were picked and grown in 3 ml 2x YT medium
- Minipreps from Tripeptide-Colonies picked the day before that were grown in 2x YT medium
- Restriction digests:
- NotI (~0.8µl per sample)
- SphI (~0.5µl per sample) (enzyme 2 years over due-date)
Results
- ==> Tripeptide I shows a good band for the insert and the backbone, Tripeptide II doesn't show any positive bands
- ==> the SphI-digest was not successful - maybe because enzyme was not working
- for reference, see the overview Excel-document
- samples were sent to sequencing:
- Dipeptide 1 (lane 2) --> from plate Dipeptide 1 (colony B) (picked on 05.08.)
- Dipeptide 2 (lane 8) --> from plate Dipeptide 3 (colony B) (picked on 05.08.)
- Tripeptide I 1 (lane 10) --> from plate Tripeptide I 1 (colony A) (picked on 05.08.)
- Tripeptide I 2 (lane 11) --> from plate Tripeptide I 1 (colony B) (picked on 05.08.)
- Tripeptide II 1 (lane 20) --> from plate Tripeptide II 1 (colony B) (picked on 05.08.)
- Tripeptide II 2 (lane 25) --> from plate Tripeptide II 3 (colony A) (picked on 05.08.)
- Tetrapeptide II 1 (lane 37) --> from plate Tetrapeptide II' 1 (colony A) (picked on 05.08.)
- Tetrapeptide II 2 (lane 40) --> from plate Tetrapeptide II' 2 (colony A) (picked on 05.08.)
- Tripeptide I new 1 (lane 5 on gel image 09.08.2013) --> from plate Tripeptide I 3 (colony C) (picked on 08.08.)
- Tripeptide I new 2 (lane 6 on gel image 09.08.2013) --> from plate Tripeptide I 3 (colony D) (picked on 08.08.)
Glycerol Stock
Glycerol Stocks of all colonies that were sent to sequencing
Glycerol Stocks of newest Di-, Tri- and Tetrapeptide - colonies ->the Gibson construct overview table for reference
Restriction Digest of Tetrapeptide-I-NRPSs
- Minipreps of Tetrapeptide I colonies and new Di-, Tri- & Tetrapeptide colonies
- --> see the Gibson construct overview table for reference
| Probe name | Available volume |
|---|---|
| Tet I 1a | 1,3 ml |
| Tet I 1b | 1,3 ml |
| Tet I 1c | 1,3 ml |
| Tet I 2a | 1,3 ml |
| Tet I 2b | 1,3 ml |
| Tet I 2c | 1,3 ml |
| Tet I 3a | 0,845 ml |
| Tet I 3b | 0,975 ml |
| Tet I 4a | 1,3 ml |
| Tet I 4b | 0,75 ml |
| Tet I 4c | 0,845 ml |
| Tet II 2 11 | 0,750 ml |
| Tet II 2 14 | 0,975 ml |
| Tet II 3 15 | 0,750 ml |
| Tet II 2 12 | 0,975 ml |
| Di 1 | 0,975 ml |
| Tri II 1 | 0,975 ml |
| Di 2 | 1,075 ml |
| Tri II 2 | 0,975 ml |
| Di 3A | 0,975 ml |
| Tri II 3 | 0,975 ml |
| Di 3b | 0,975 ml |
Results
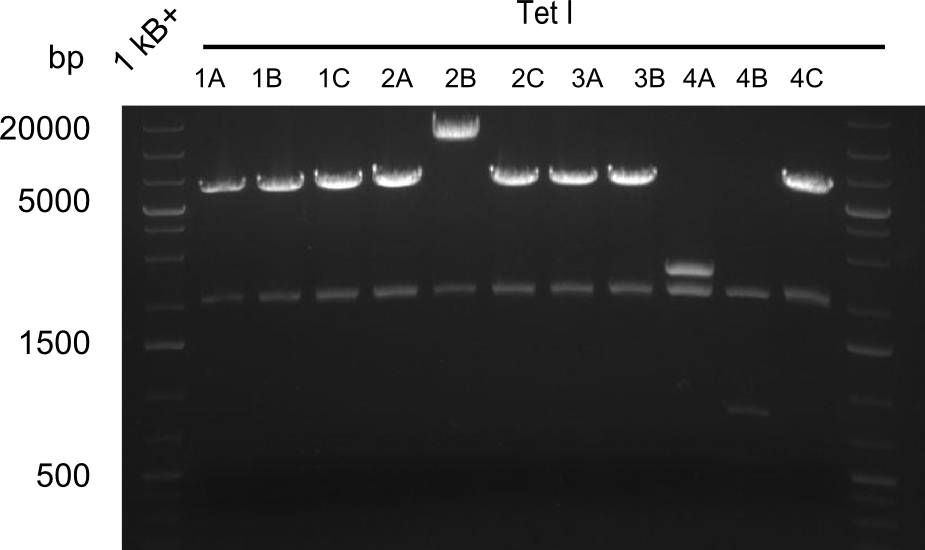
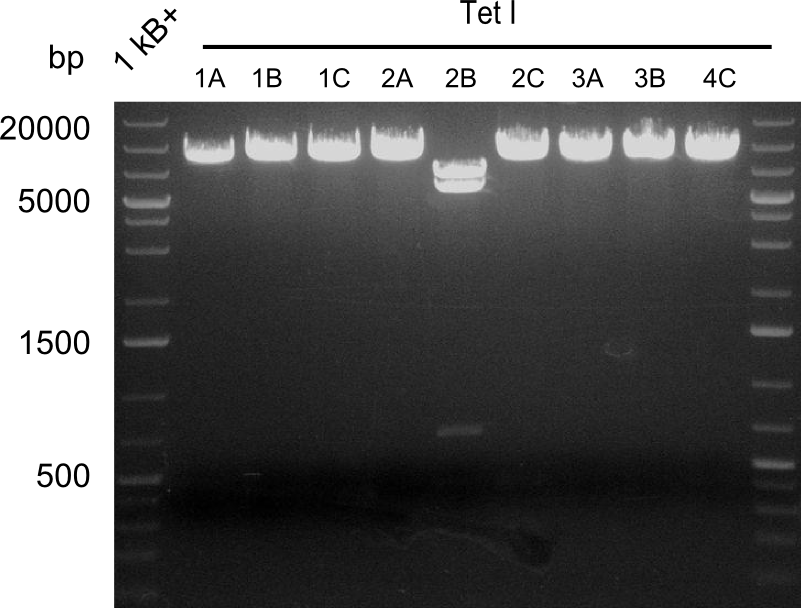
Restriction digest I of Tetrapeptide I with PstI and EcoR1-HF was probably positive for probe 2b,so we drove another Restriction digest with MfeI for Validation. The result was not clear, perhaps because of the extremely high DNA concentration of our Miniprep or because of the old enzyme.
We decided to sent this probe to sequencing to be sure.
Second Restriction digest with MFE 1 for validation of 2B.
Validation of constructs by sequencing
- The sequences of for our NRPSs arrived: The alignments for the Di-, TriI-, TriII- and TetII - constructs and the new TriI - constructs.
- We also have positive Alignments, you can find them here
- So far, we have positive alignments for:
- Tripeptide I
- Tetrapeptide II
- one direction for Tripeptide II (the other direction - with IK13 - is not yet finished)
Restriction Digest of Dipeptide-NRPS from Minipreps
Enzymes used
- PstI
- EcoRI
- expected fragments: ~6000 & ~2000 bp
Protocol
| what | µl |
|---|---|
| DNA | 6 |
| Cutsmart Mix | 2 |
| EcoRI | 0.75 |
| PstI | 0.75 |
| ddH20 | 10.5 |
Results
- the obtained band does not match the expected size
- => optimize Gibson Assembly for Dipeptide
Gibson Assembly of missing short-peptide NRPS
Protocols
- According to the problems detected by sequencing, the following changes were performed
- Dipeptide: lower backbone-to-insert-ratio (less backbone used), as most cells were transformed with religated backbone-constructs
- Tripeptide II: lower backbone-to-insert-ratio, as religations or false ligations occured
- Tetrapeptide I: fragment 12 was given in excess, as it was missing in the sequenced plasmid
- The protocols used were the following:
Dipeptide
| fragment | concentration [ng/µl] | volume for gibson assembly [µL] |
|---|---|---|
| 1 | 30 | 0.80 |
| 2 | 16 | 4.81 |
| 3 | 35 | 4.39 |
Tripeptide II
| fragment | concentration [ng/µl] | volume for gibson assembly [µL] |
|---|---|---|
| 4 | 32 | 0.38 |
| 7 | 18 | 1.08 |
| 8 | 8 | 8.54 |
Tetrapeptide I
| fragment | concentration [ng/µl] | volume for gibson assembly [µL] |
|---|---|---|
| 9 | 30 | 0.35 |
| 10 | 40 | 0.42 |
| 11 | 10 | 4.20 |
| 12 | 10 | 3.36 |
| 13 | 20 | 1.68 |
Tetrapeptide II
| fragment | concentration [ng/µl] | volume for gibson assembly [µL] |
|---|---|---|
| 9 | 30 | 0.25 |
| 10 | 40 | 0.61 |
| 11 | 10 | 6.09 |
| 14 | 40 | 0.61 |
| 15 | 20 | 2.44 |
Transformation
- DH10β cells were transformed with electroporation:
- Dipeptide: purified DNA (15µl Gibson Mix purified with Isopropanol and EtOH, eluted in 10µl water)
- Dipeptide: raw Gibson mix (5µl Gibson Mix diluted in 10µl water)
- Tripeptide II: purified DNA (15µl Gibson Mix purified with Isopropanol and EtOH, eluted in 10µl water)
- Tripeptide II: raw Gibson mix (5µl Gibson Mix diluted in 10µl water)
- Tetrapeptide I: purified DNA (15µl Gibson Mix purified with Isopropanol and EtOH, eluted in 10µl water)
- Tetrapeptide I: raw Gibson mix (5µl Gibson Mix diluted in 10µl water)
- Tetrapeptide II: 1 µl of 5 µl raw Gibson Mix diluted in 10 µl water
- Tetrapeptide II: 14 µl of 5 µl raw Gibson Mix diluted in 10 µl water
- negative control: 10 µl water
Results
- white colonies were picked and grown overnight in 2x YT-medium with Chloramphenicol
Verification of correct constructs
Procedure
- 2 ml of overnight culture were used for miniprep and obtained DNA was quantified on Nano-drop
- Restriction digests with Not I
| what | µl |
|---|---|
| DNA | 600ng, alternatively 4 µl |
| Cutsmart Mix | 2 |
| Enzyme | 0.5 |
| ddH20 | ad 20 µl |
- Sequencing of positive samples
Results
Heidelberg pPW02 DH10β ACD.png
Restriction digest with PstI & EcoRI. All lanes: Tetrapeptide-II-NRPS |
Heidelberg pPW02 DH10β B.png
Restriction digest with PstI & EcoRI. All lanes: Tetrapeptide-II-NRPS |
- 2 samples for the Dipeptide-NRPS (lane 3 and lane 5) and 2 samples for the Tetrapeptide I-construct (lane 16 and lane 23) were sent to sequencing.
- Positive alignments -> linkout
- All colonies that were transformed with Tripeptide II were negative, hence three additional colonies were picked
Tetrapeptide II was abandoned
Transformation of BAP I cells
Protocol
- thaw chemically competent BAP I cells on ice
- add ~50-100 ng of DNA
- let incubate for 20-30 minutes
- heat-shock at 42°C for 40 seconds
- let cool down on ice for 2 minutes
- add 1 ml 2x YT-medium
- let incubate for 60 minutes at 37°C
- centrifuge at 6000 rpm for 2:30 minutes
- decant medium and resuspend cells in remaining medium
- plate cells on agar plates with Chloramphenicol
Tripeptide I
Results
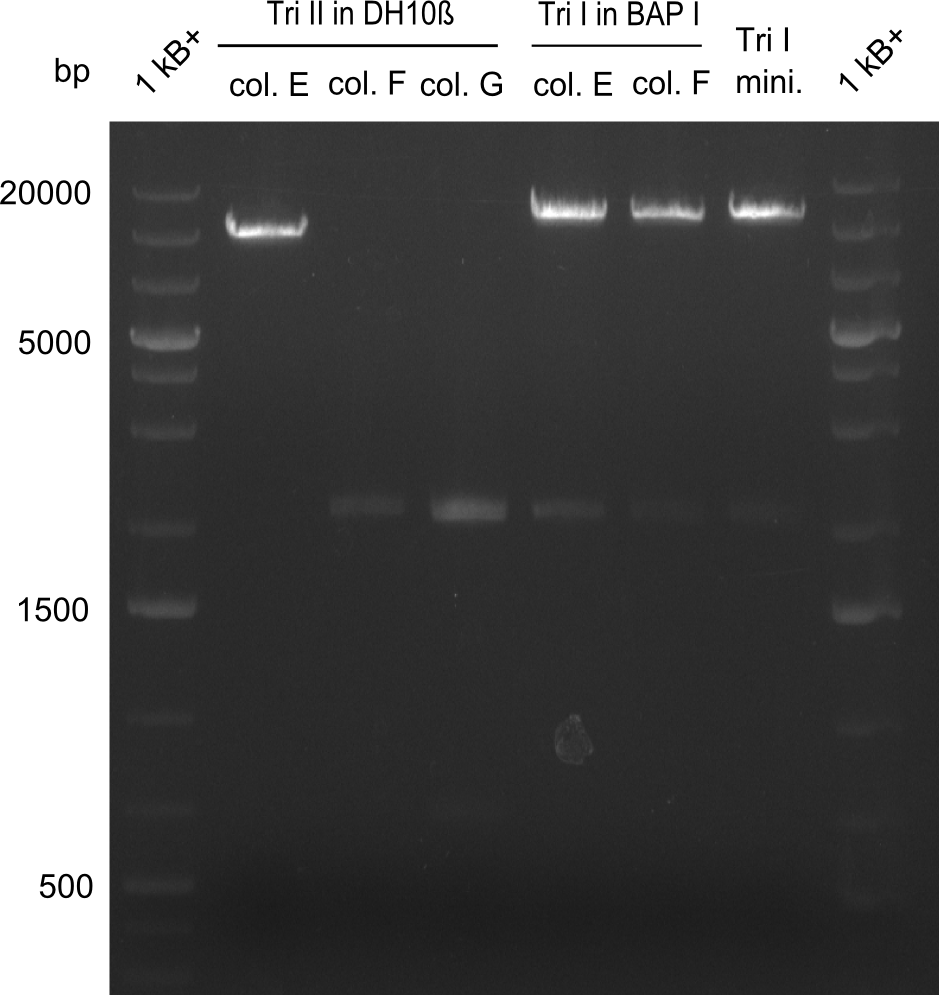
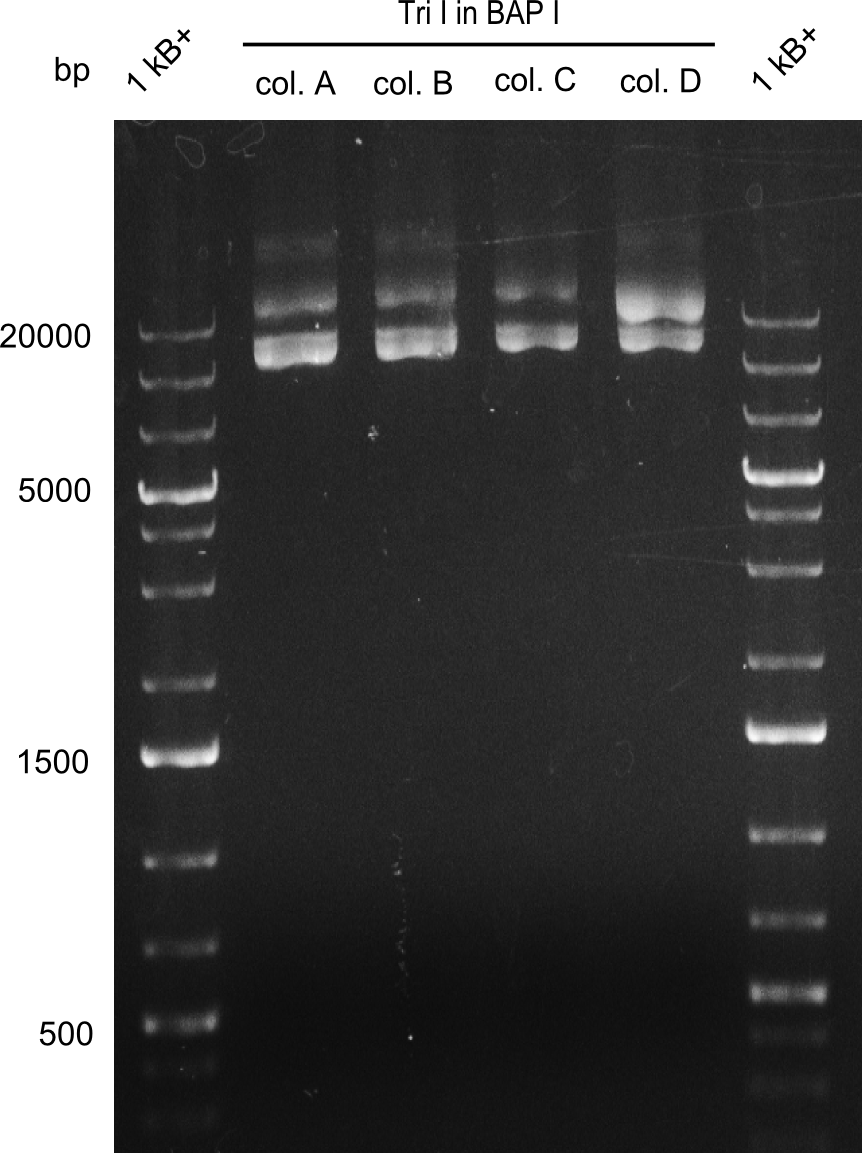
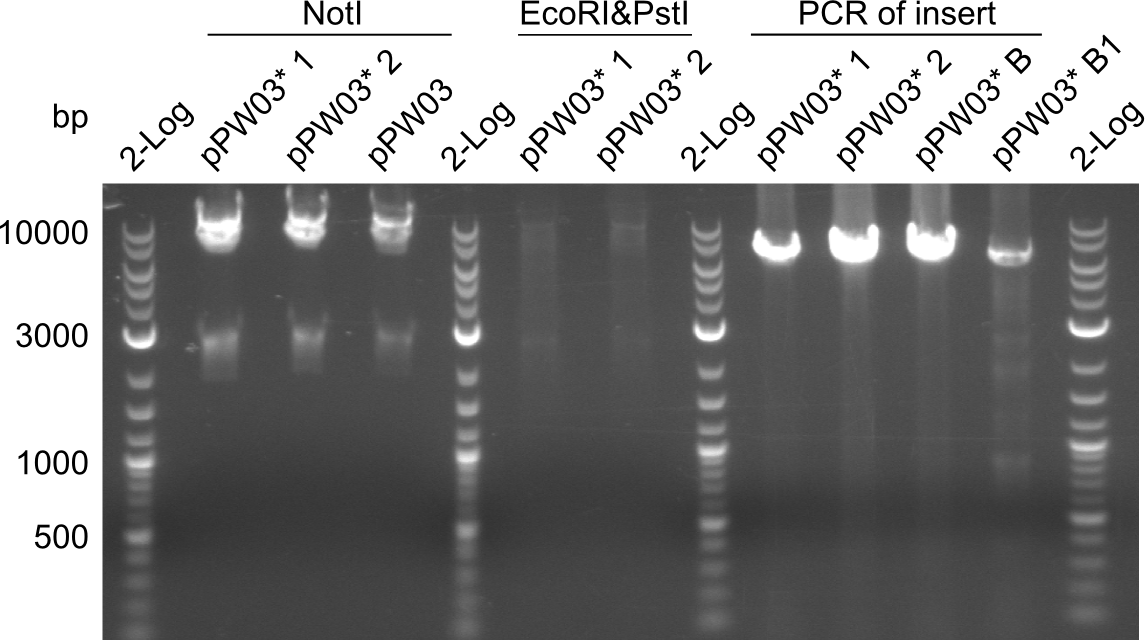
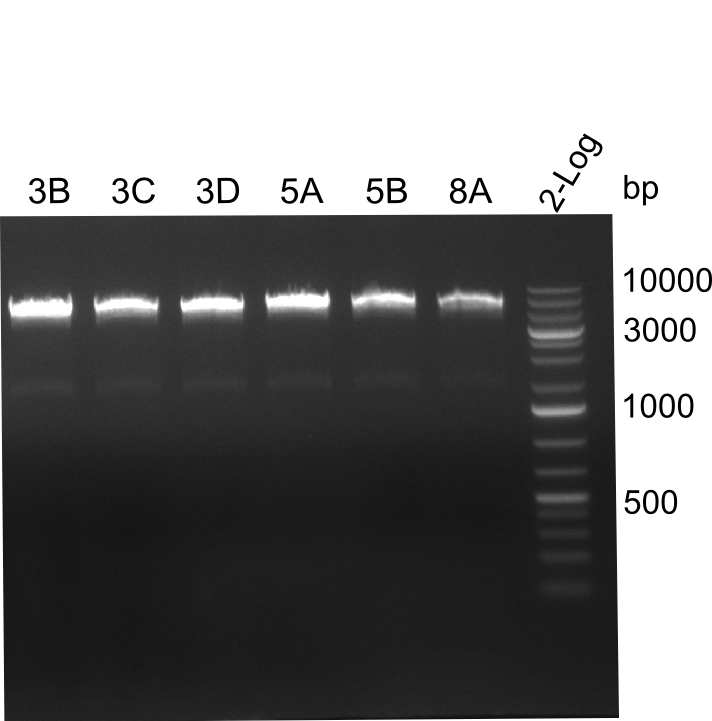
As the first digest with NotI (figure XY) did not give any positive results - in fact the bands lead to the conclusion that the digest did not work, as one can see the bands that are characteristic for coiled-coil, knicked and linearized plasmid - further colonies were picked and grown as an overnight-culture. Miniprep and restriction digest with NotI on the next day lead to a positive result (figure XY). In this case, the validated plasmid that was used for transformation was used as a positive control. We use Glycerol stocks of both BAP I cultures that were transformed with the NRPS for Tripeptide I for conservation.
Dipeptide
Results
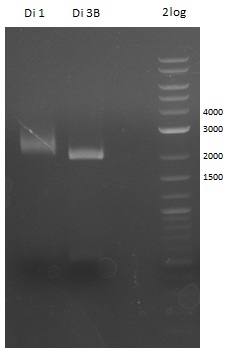
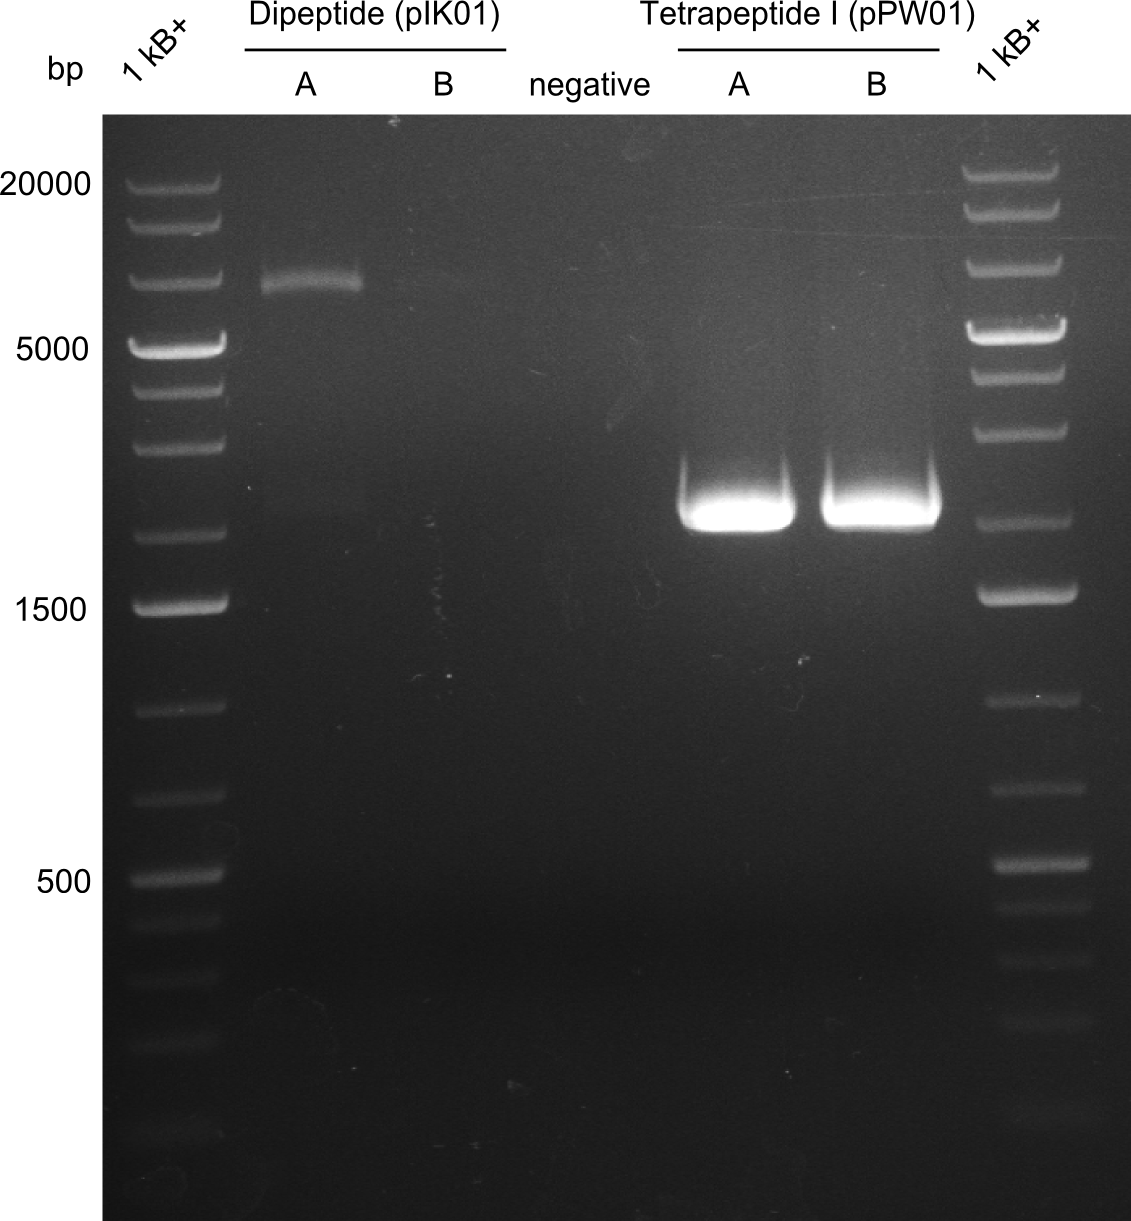
A first restriction digest with PstI & EcoRI only lead to faint positive bands (figure XY), hence further colonies were picked and grown as an overnight culture. After miniprep and restriction digest - again with PstI & EcoRI - a clearer validation was obtained (figure XY). We created Glycerol Stocks of the cells containing the validated plasmid for the Dipeptide-NRPS.
Tetrapeptide I
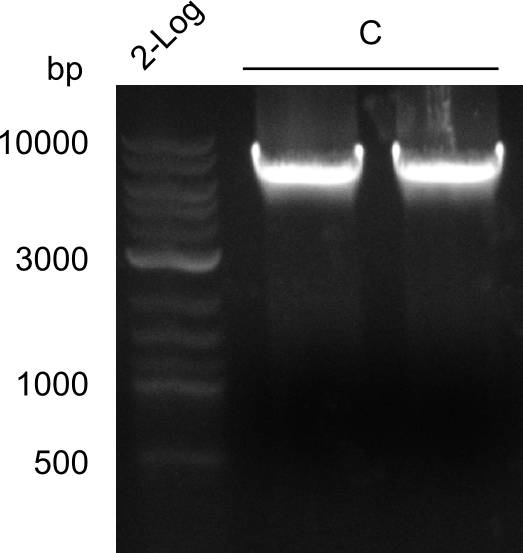
After a first, negative PstI-EcoRI-restriction digest from minipreps of BAPI-cells that were transformed with the validated plasmid for the Tetrapeptide-I-NRPS (figure XY), further colonies from the same plate were picked and tested, following the same procedure. This time the plasmid that was validated by sequencing and used for transformation was added as a positive contol (figure XY). However, the expected bands were not visible on the gel. Hence, the transformation was done once again, following the protocol described in the section above.
RFC10 Standardization of Tyc Modules
Primer Design
Amplification of Tyc A
| TycA | µl |
|---|---|
| Bacillus | 1 |
| AT01 | 2 |
| AT02 | 2 |
| Q5 2x Master mix | 10 |
| ddH20 | 5 |
| Cycles | temperature [°C] | Time [min:s] |
|---|---|---|
| 1 | 98 | 2:00 |
| 35 | 98 | 0:10 |
| 59 | 0:30 | |
| 72 | 1:30 | |
| 1 | 72 | 2:00 |
| 1 | 10 | inf |
Result There was a band at the right length but we were not able to cut.
Amplification of Tyc B1
A
| TycB1 | µl |
|---|---|
| Bacillus | 1 |
| AT03 | 2 |
| AT04 | 2 |
| Q5 2x Master mix | 10 |
| ddH20 | 5 |
| Cycles | temperature [°C] | Time [min:s] |
|---|---|---|
| 1 | 98 | 2:00 |
| 35 | 98 | 0:10 |
| 56 | 0:30 | |
| 72 | 1:30 | |
| 1 | 72 | 2:00 |
| 1 | 10 | inf |
Result no band in gel, empty lane; optimization
Final validation of BAP-I-cells transformed with pIK03 and pIK04
Restriction Digests
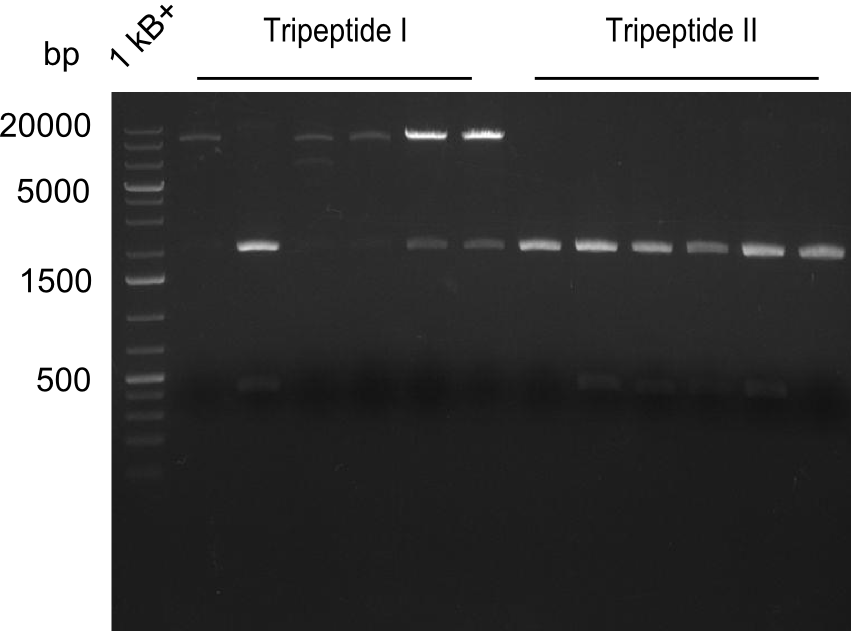
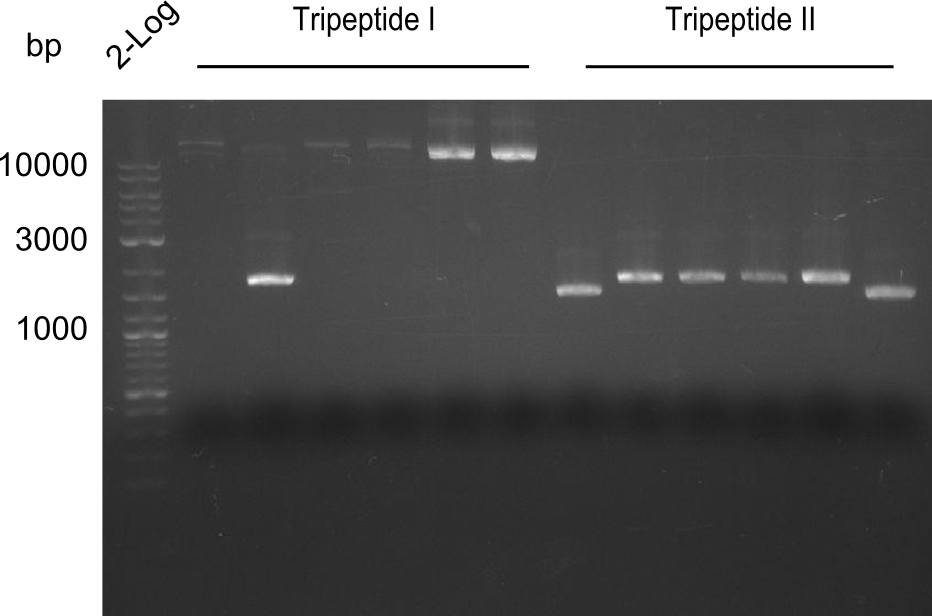
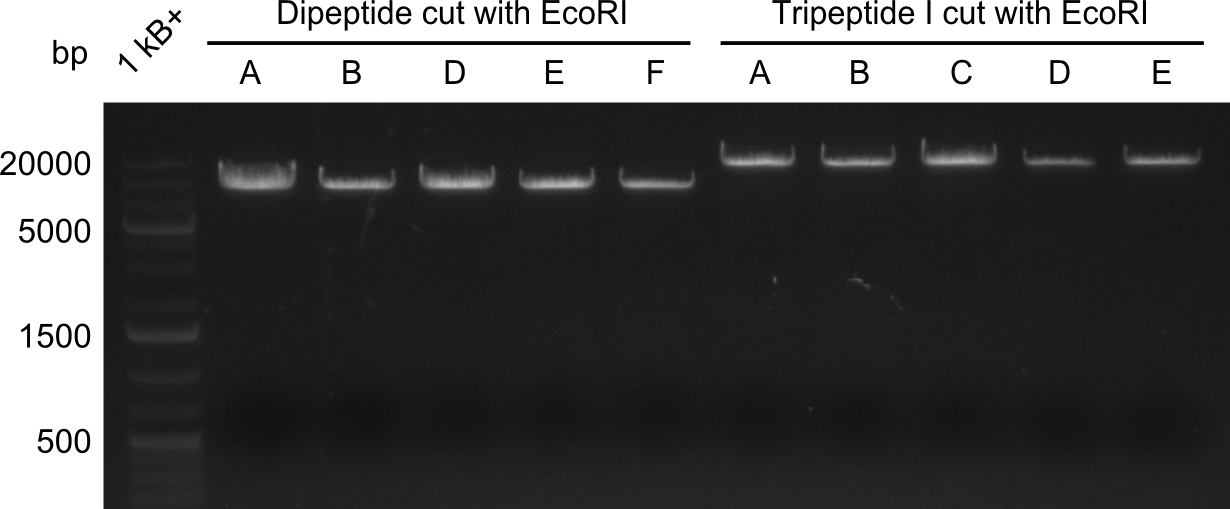
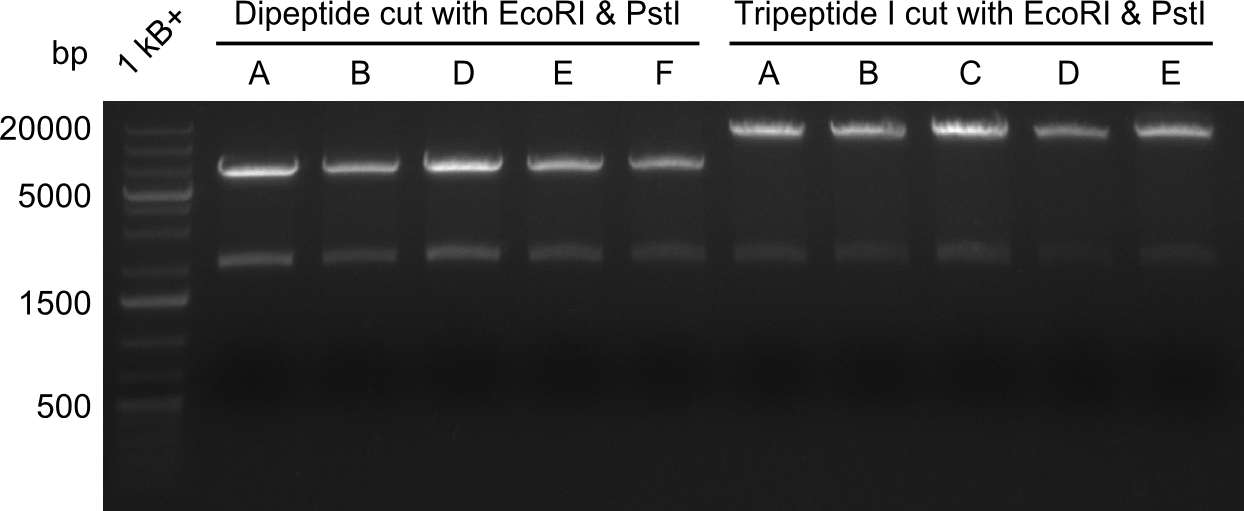
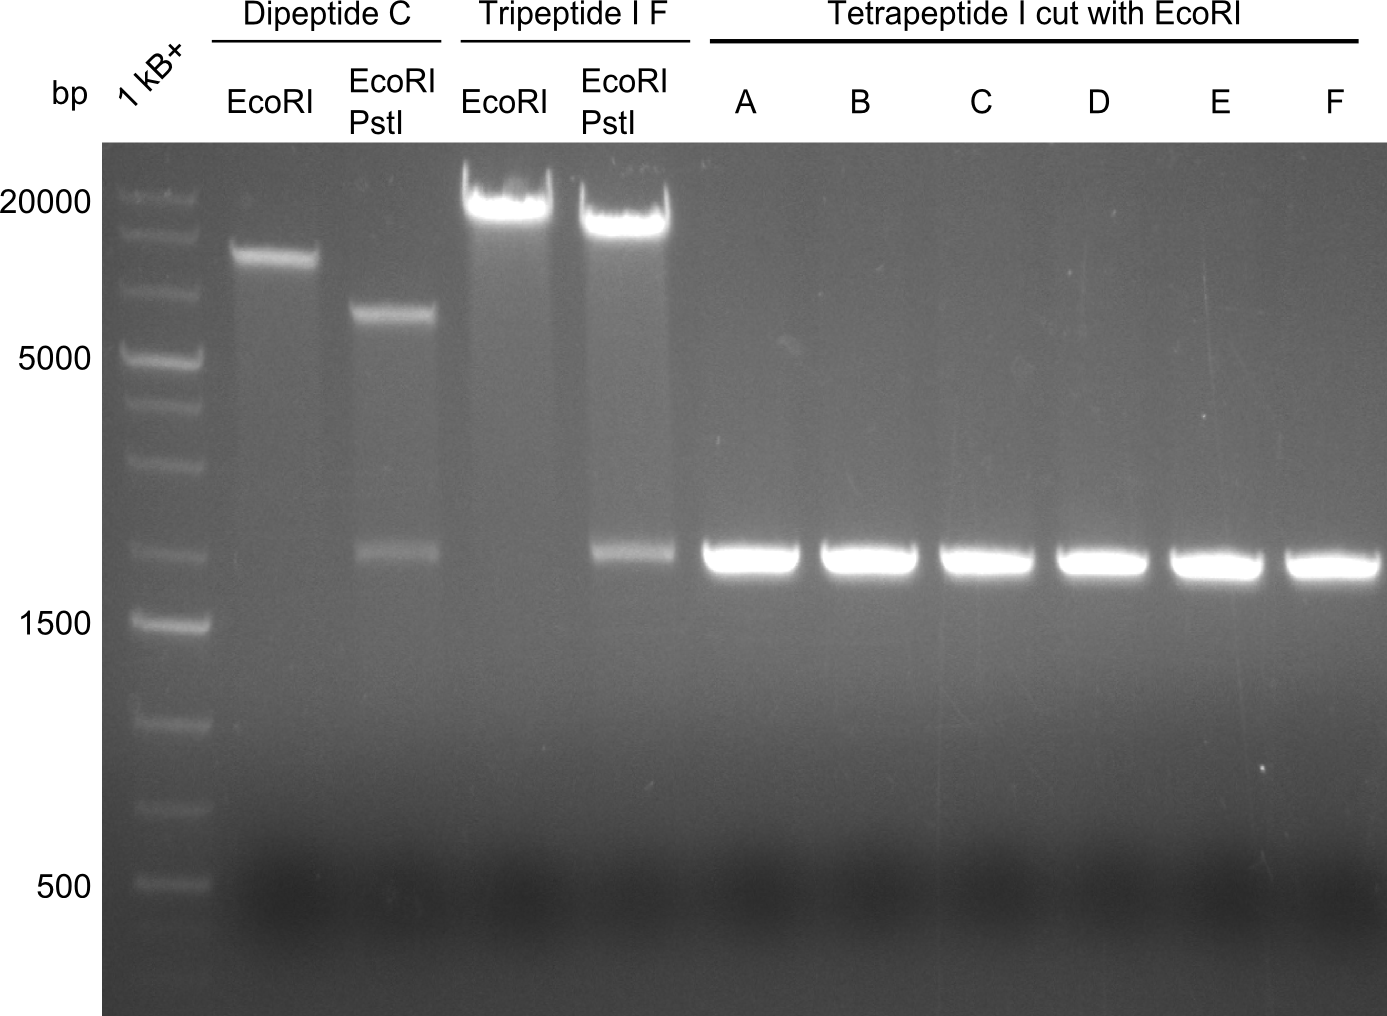
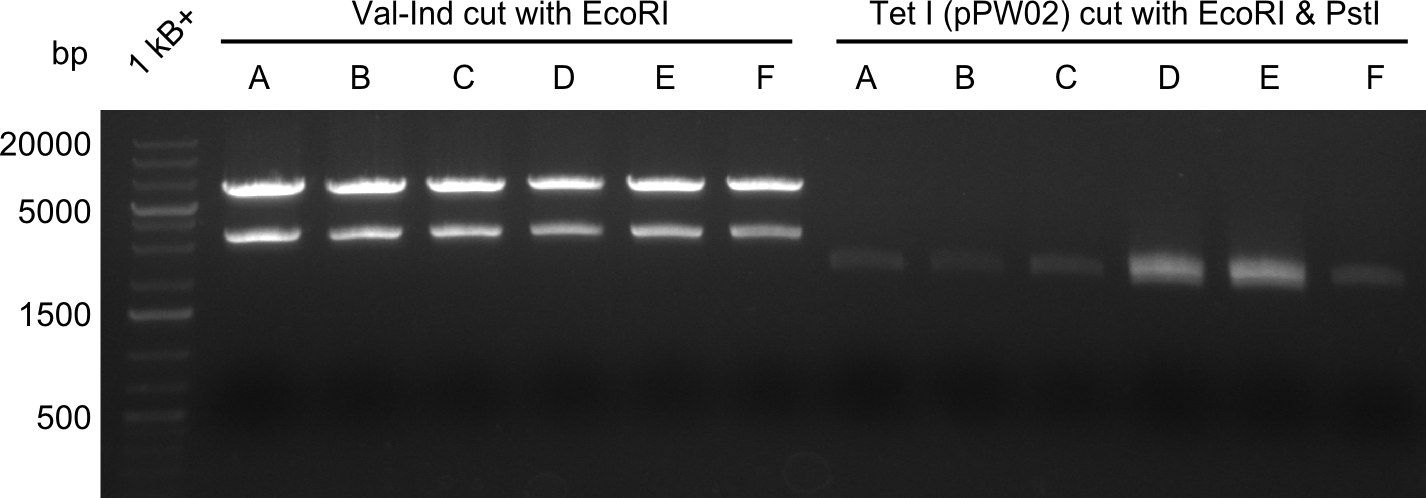
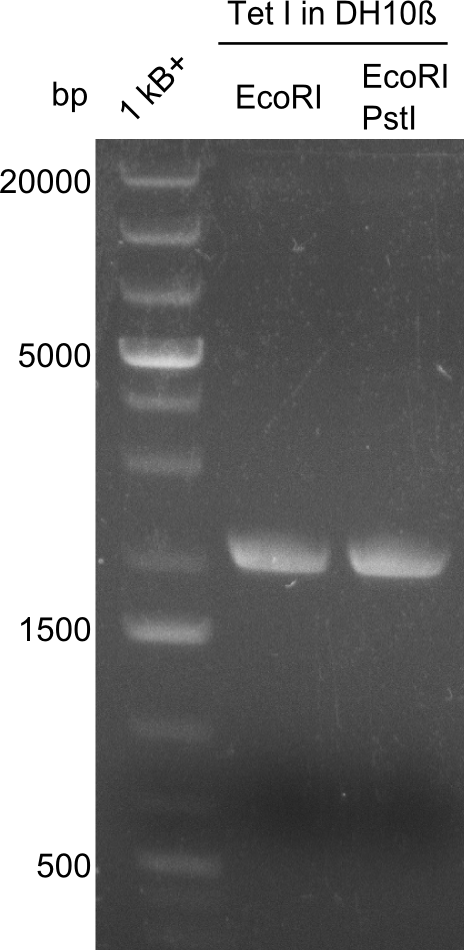
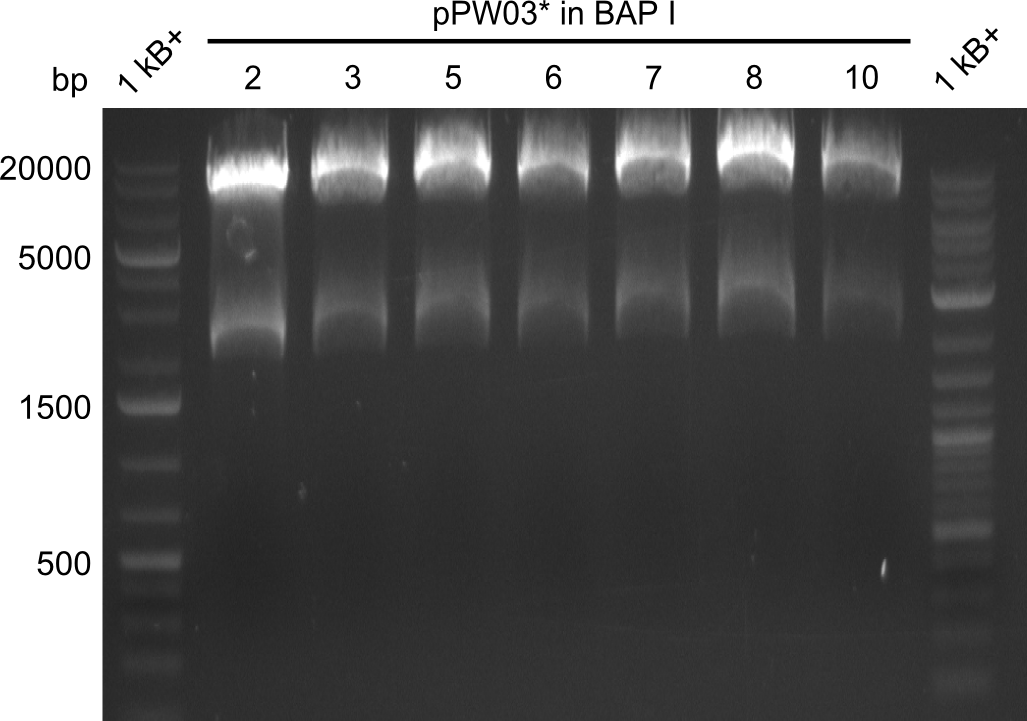
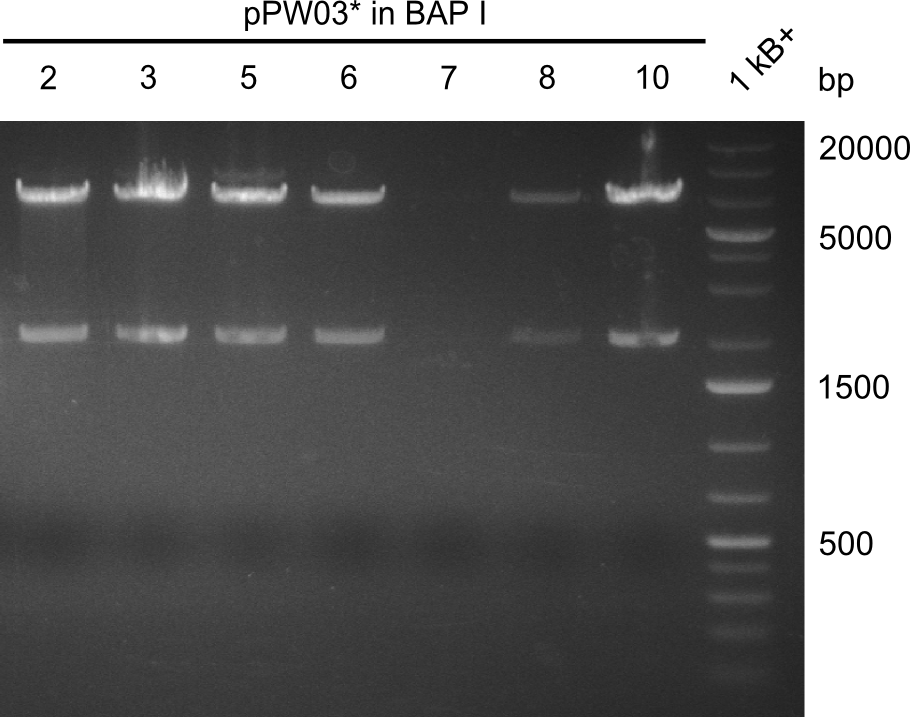
In order to select the samples that we will test on SDS-PAGE and in Mass-Spec, we decided to perform restriction digests and to send the positive samples to sequencing. Restriction digest was performed in a 20µl volume, using 2µl 10x CutSmart buffer, 1µl enzyme(s) and ~500ng DNA per reaction. In order to see both, the purity of the sample, as well as the correct sizes of insert and backbone, we digested every sample twice, once with EcoRI and PstI (in order to see, if the insert has the appropriate size) and once more with EcoRI alone (to see, if there is only one single band). At this stage, all plasmids were already transformed into our expression strain BAP-I.
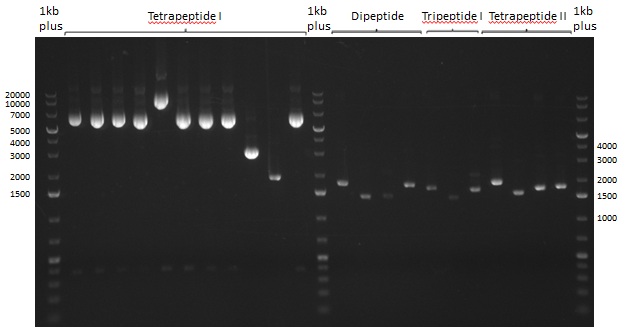
The restriction digests look very promising for the samples of the Dipeptide- and the Tripeptide-I-NRPS. We hence decided to use all of them on an SDS-PAGE. On the first two images, one can nicely see the expected cutting patterns. The third image was thought as comparison between the positive Di- and Tripeptide-NRPS samples and the Tetrapeptide-I-NRPS samples that we wanted to use.
SDS-PAGE
Recipe for Running Buffer:
- 100 mM Tris-HCl
- 4% SDS
- 0.2% bromophenol-blue
- 20% glycerol
- 200 mM DTT
Unfortunately there were no bands showing up on the gel, which is most probably due to a wrong pH of the loading buffer. Hence this was changed for further optimization.
Tetrapeptide I
Unfortunately, the restriction digest described above did not reveal the expected and desired fragment sizes:
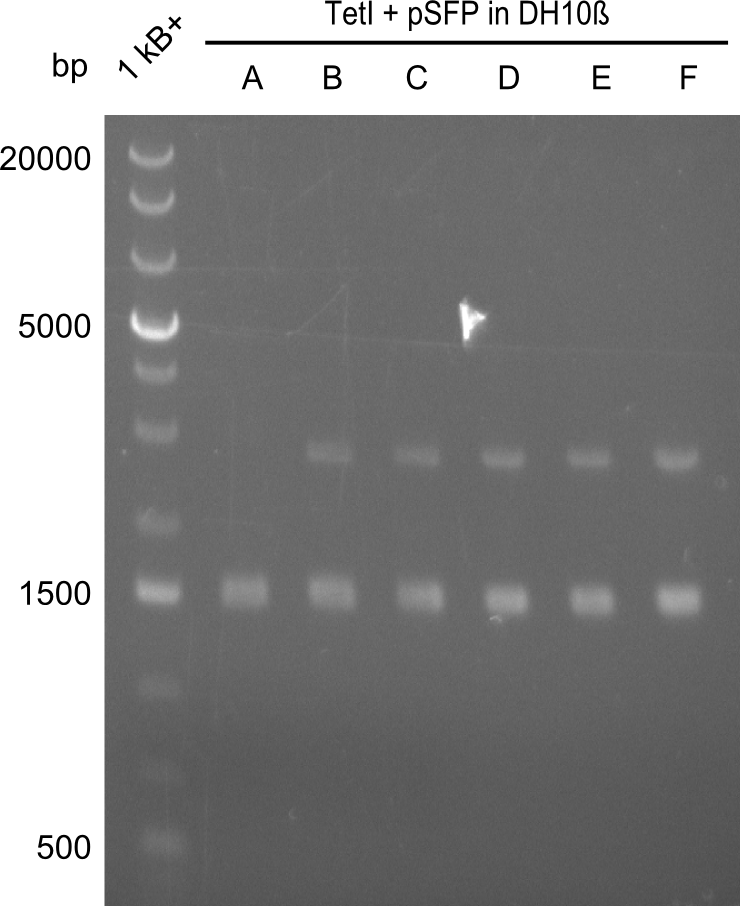
At first, we believed that the chemically competent cells could not incorporate the 16kb plasmid in a heat-shock transformation, therefore we started a Co-transformation of pPW01 (Tetrapeptide I) and the PPTase sfp so that we could "stay" in DH10β-cells where we had electrocompetent cells available.
Even though screening by restriction digest is not that easy when two plasmids are present, it is clear that the approach did not work and that there has to be another problem.
Amplifications
In the course of this project, we'll have to amplify the following fragments: Fragments for Tyrocidine-Indigoidine-Fusion
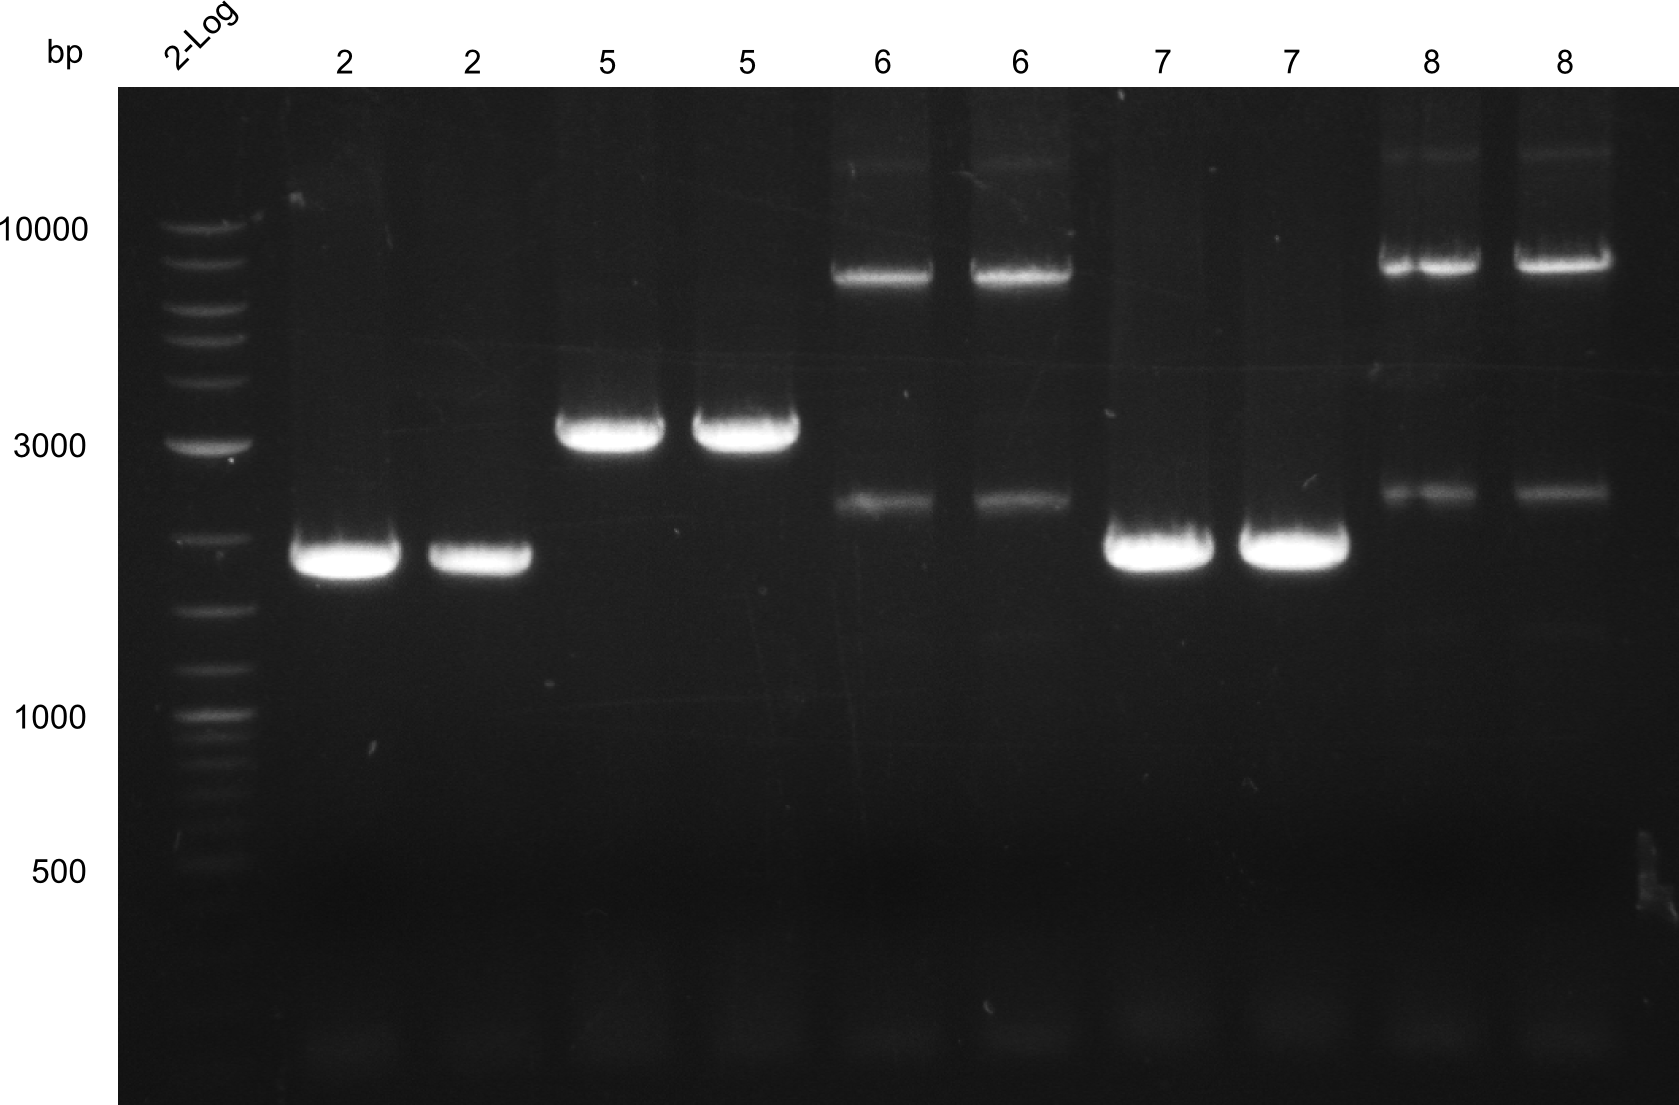
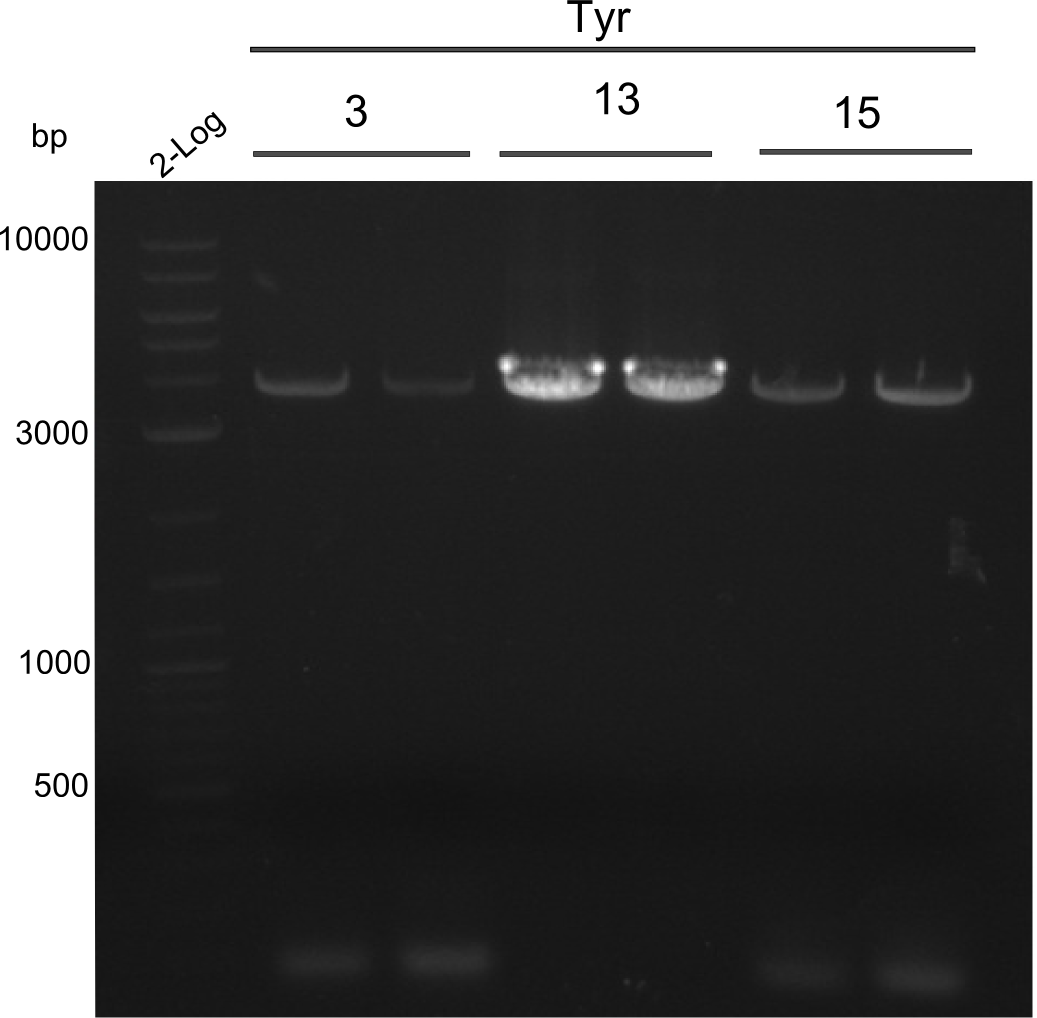
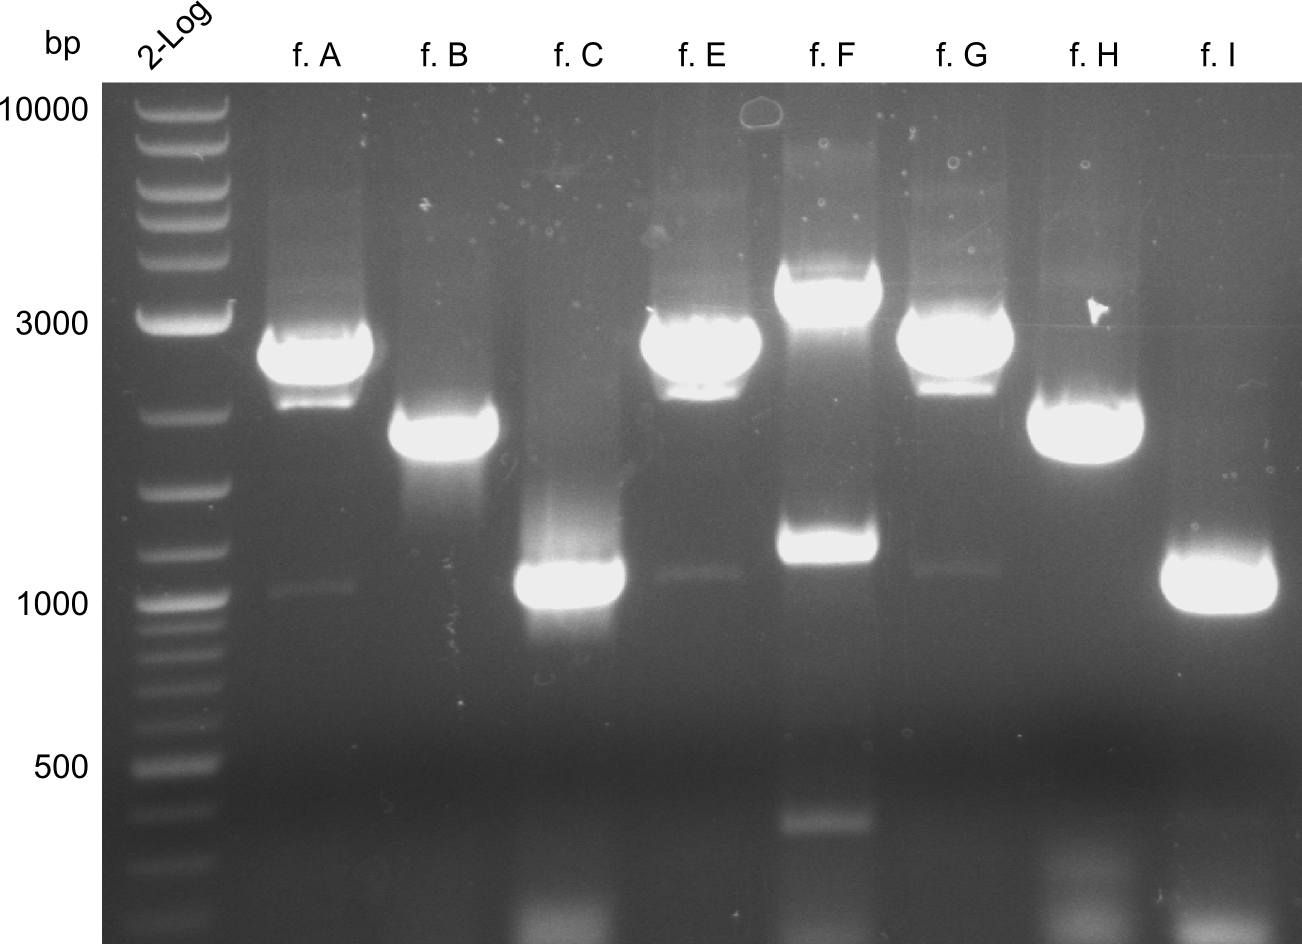
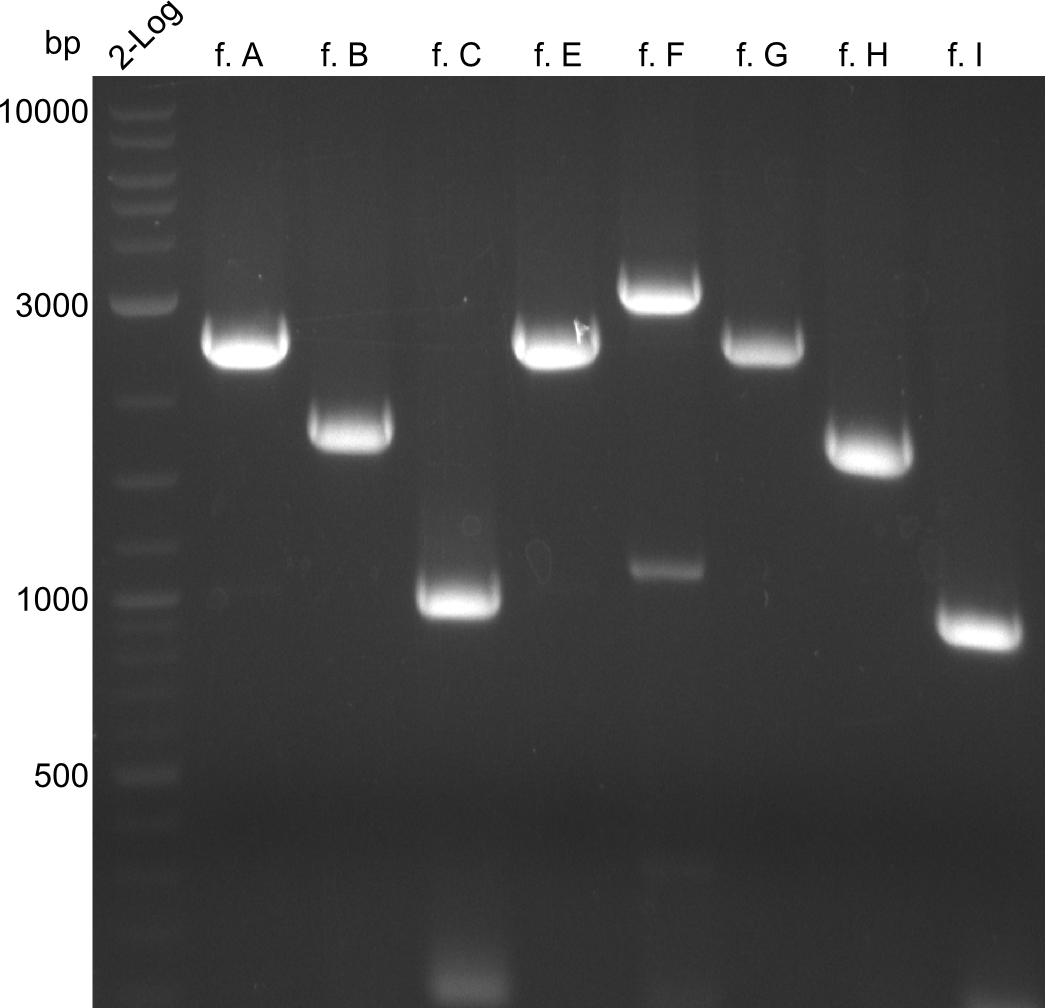
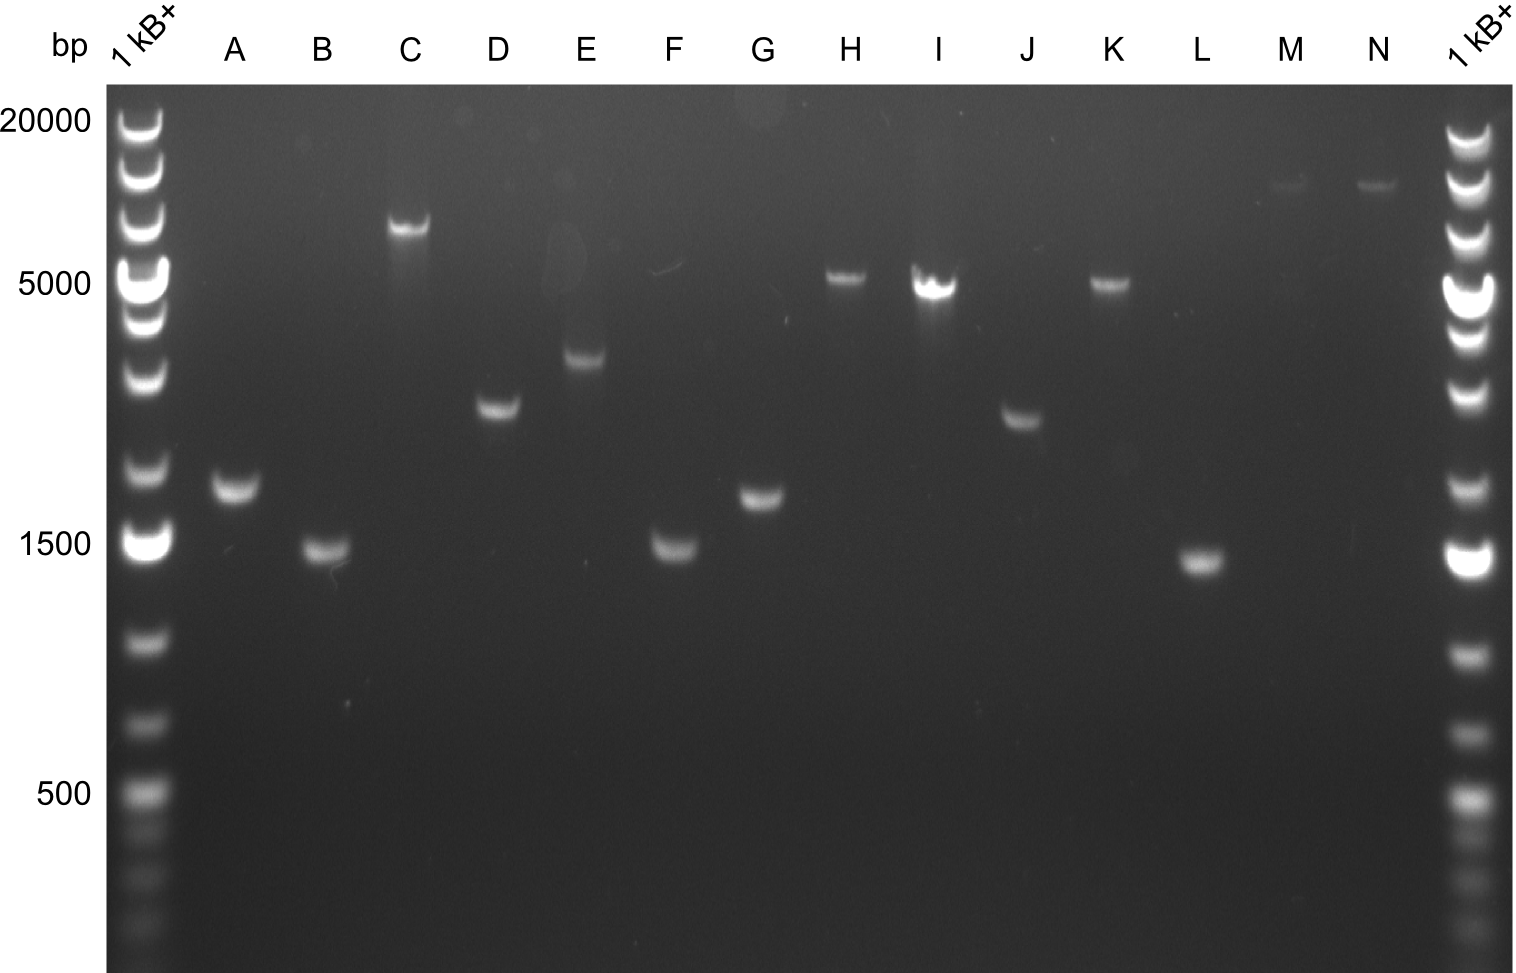
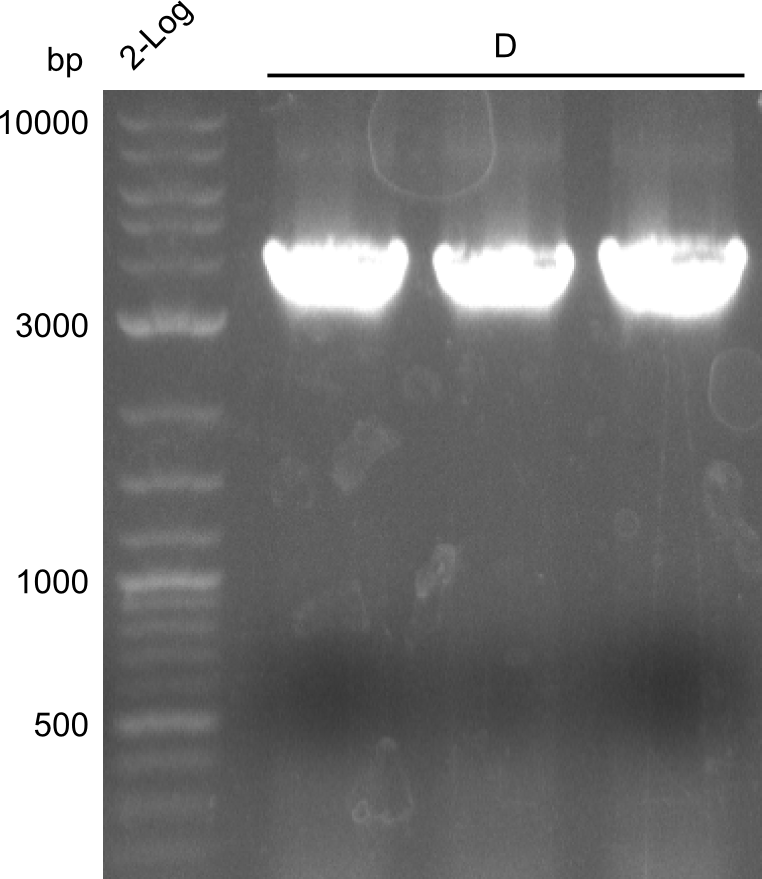
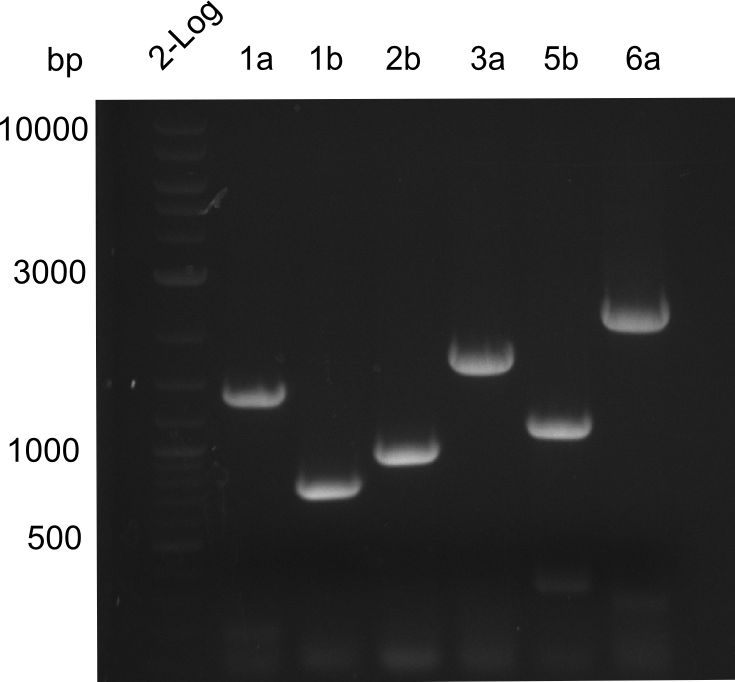
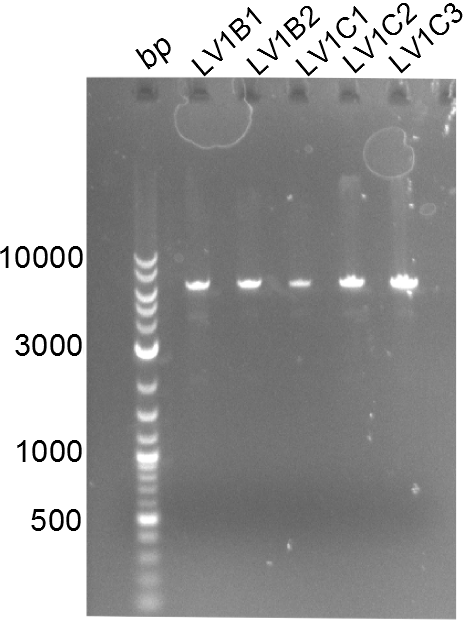
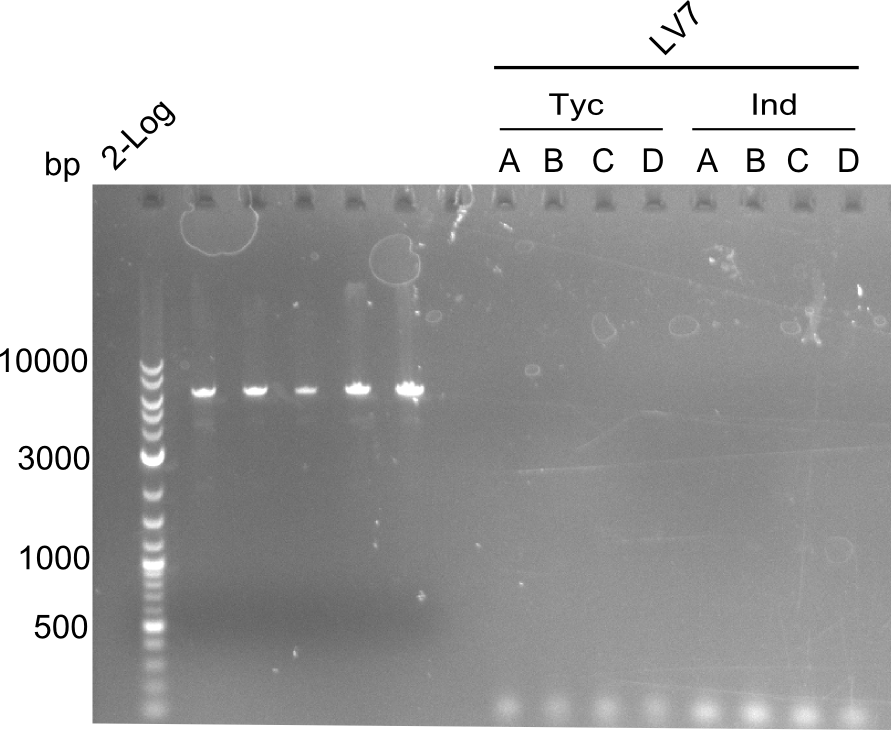
For reasons of clarity, the gel-pictures obtained by PCR are shown here in this gallery:
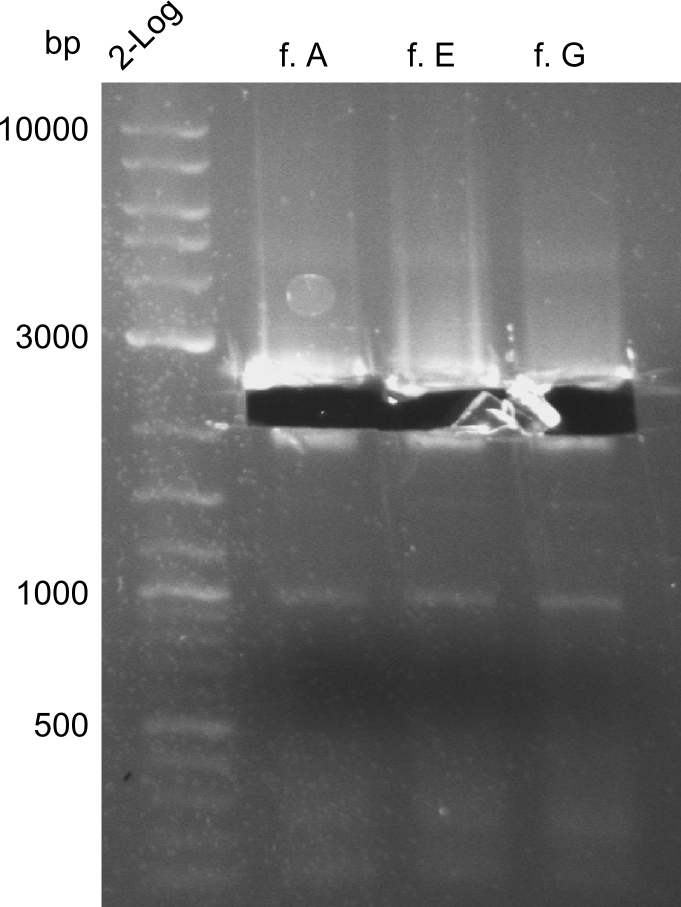
Comment on the second File:Heidelberg_
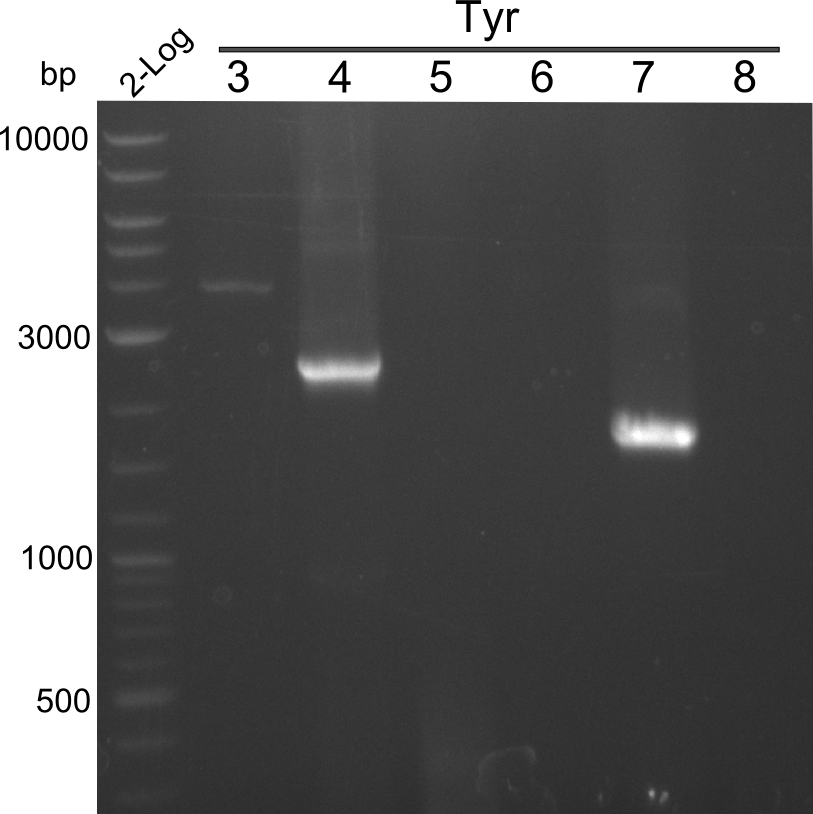
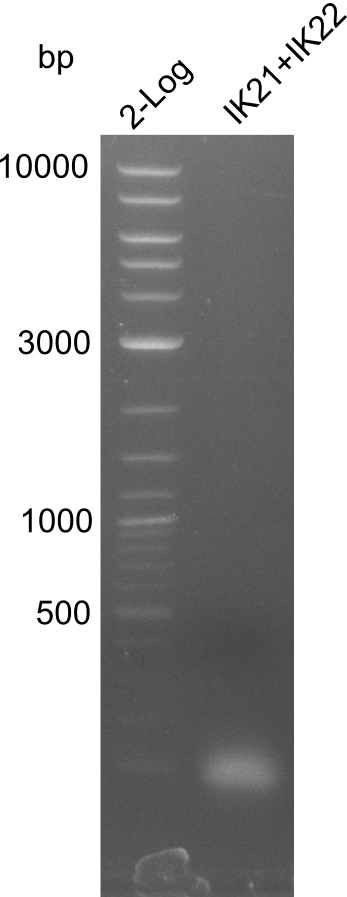
The normal gel-image before the cut out was not properly saved on the PC that is connected to the camera. The bands that were visible (one can estimate them by the cut-out) were at about 2.4 to 2.5 kbp, which is the expected size of the backbone
Fragment A
A
| what | µl |
|---|---|
| pSB1C3 | 1 |
| IK21 | 2 |
| PW23 | 2 |
| Phusion Flash 2x Master mix | 10 |
| ddH20 | 5 |
| Cycles | temperature [°C] | Time [s] |
|---|---|---|
| 1 | 98 | 5 |
| 35 | 98 | 1 |
| 66 | 5 | |
| 72 | 40 | |
| 1 | 72 | 300 |
| 1 | 10 | inf |
Results
The gel was overloaded, which might be due to a too low dilution of Medi-Prep and hence too much template. For optimization use less template and take it from a more diluted sample.
B
| what | µl |
|---|---|
| pSB1C3 | 0.5 |
| IK21 | 2 |
| PW23 | 2 |
| Phusion Flash 2x Master mix | 10 |
| ddH20 | 5.5 |
| Cycles | temperature [°C] | Time [s] |
|---|---|---|
| 1 | 98 | 5 |
| 35 | 98 | 1 |
| 66 | 5 | |
| 72 | 40 | |
| 1 | 72 | 300 |
| 1 | 10 | inf |
Results
Still the gel is overloaded, though less template was used. For the next time, reduce cycle repetitin from 35 to 30 and increase annealing temperature by 1°C
C
| what | µl |
|---|---|
| pSB1C3 | 0.5 |
| IK21 | 2 |
| PW23 | 2 |
| Phusion Flash 2x Master mix | 10 |
| ddH20 | 5.5 |
| Cycles | temperature [°C] | Time [s] |
|---|---|---|
| 1 | 98 | 5 |
| 30 | 98 | 1 |
| 67 | 5 | |
| 72 | 40 | |
| 1 | 72 | 300 |
| 1 | 10 | inf |
Results
Fragment B
A
| what | µl |
|---|---|
| B. parabrevis | 1 |
| IK16 | 2 |
| PW17 | 2 |
| Phusion Flash 2x Master mix | 10 |
| ddH20 | 5 |
| Cycles | temperature [°C] | Time [s] |
|---|---|---|
| 1 | 98 | 120 |
| 35 | 98 | 1 |
| 65 | 5 | |
| 72 | 40 | |
| 1 | 72 | 300 |
| 1 | 10 | inf |
Results
The gel was overloaded, which might be due to the polymerase, as Q5 was usually used in previous samples and bright bands are visible for all fragments. For optimization, the annealing-temperature could be increased by 1 - 2°C and cycle repetition may be reduced to 30 cycles.
B
| what | µl |
|---|---|
| B. parabrevis | 1 |
| IK16 | 2 |
| PW17 | 2 |
| Phusion Flash 2x Master mix | 10 |
| ddH20 | 5 |
| Cycles | temperature [°C] | Time [s] |
|---|---|---|
| 1 | 98 | 120 |
| 30 | 98 | 1 |
| 66 | 5 | |
| 72 | 40 | |
| 1 | 72 | 300 |
| 1 | 10 | inf |
Results
Fragment C
A
| what | µl |
|---|---|
| B. parabrevis | 1 |
| PW18 | 2 |
| PW14 | 2 |
| Phusion Flash 2x Master mix | 10 |
| ddH20 | 5 |
| Cycles | temperature [°C] | Time [s] |
|---|---|---|
| 1 | 98 | 120 |
| 35 | 98 | 1 |
| 65 | 5 | |
| 72 | 40 | |
| 1 | 72 | 300 |
| 1 | 10 | inf |
Results
The gel was overloaded, which might be due to the polymerase, as Q5 was usually used in previous samples and bright bands are visible for all fragments. For optimization, the annealing-temperature could be increased by 1 - 2°C and cycle repetition may be reduced to 30 cycles.
B
| what | µl |
|---|---|
| B. parabrevis | 1 |
| PW18 | 2 |
| PW14 | 2 |
| Phusion Flash 2x Master mix | 10 |
| ddH20 | 5 |
| Cycles | temperature [°C] | Time [s] |
|---|---|---|
| 1 | 98 | 120 |
| 30 | 98 | 1 |
| 66 | 5 | |
| 72 | 40 | |
| 1 | 72 | 300 |
| 1 | 10 | inf |
Results
Fragment D
A
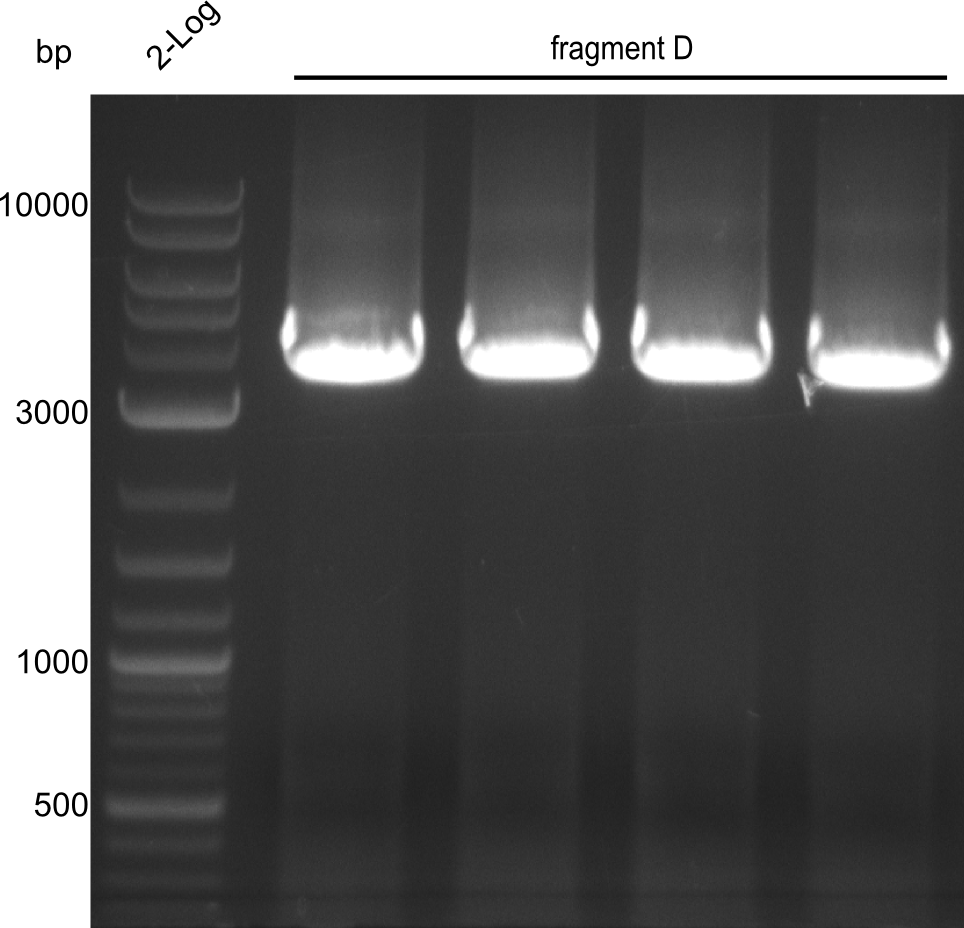
For obtaining more product and optimizing the conditions simultaneously, a gradient PCR with touch-down was carried out. 4 wells were used at 62°C, 61.4°C, 60.6°C and 60°C for touchdown, with steady temperatures at 59°C, 58.4°C, 57.6°C and 57°C.
| what | µl |
|---|---|
| indC (RB37, RB38) | 0.5 |
| PW15 | 2 |
| PW16 | 2 |
| Phusion Flash 2x Master mix | 10 |
| ddH20 | 5.5 |
| Cycles | temperature [°C] | Time [s] |
|---|---|---|
| 1 | 98 | 5 |
| 12 | 98 | 5 |
| 62 ↓ 0.5 to 60 ↓ 0.5 | 5 | |
| 72 | 100 | |
| 23 | 98 | 5 |
| 59 to 57 | 10 | |
| 72 | 100 | |
| 1 | 72 | 600 |
| 1 | 10 | inf |
Results
Fragment E
A
| what | µl |
|---|---|
| pSB1C3 | 1 |
| PW25 | 2 |
| PW23 | 2 |
| Phusion Flash 2x Master mix | 10 |
| ddH20 | 5 |
| Cycles | temperature [°C] | Time [s] |
|---|---|---|
| 1 | 98 | 5 |
| 35 | 98 | 1 |
| 66 | 5 | |
| 72 | 40 | |
| 1 | 72 | 300 |
| 1 | 10 | inf |
Results
The gel was overloaded, which might be due to a too low dilution of Medi-Prep and hence too much template. For optimization use less template and take it from a more diluted sample.
B
| what | µl |
|---|---|
| pSB1C3 | 0.5 |
| PW25 | 2 |
| PW23 | 2 |
| Phusion Flash 2x Master mix | 10 |
| ddH20 | 5.5 |
| Cycles | temperature [°C] | Time [s] |
|---|---|---|
| 1 | 98 | 5 |
| 35 | 98 | 1 |
| 66 | 5 | |
| 72 | 40 | |
| 1 | 72 | 300 |
| 1 | 10 | inf |
Result
Still the gel is overloaded, though less template was used. For the next time, reduce cycle repetitin from 35 to 30 and increase annealing temperature by 1°C
C
| what | µl |
|---|---|
| pSB1C3 | 0.5 |
| PW25 | 2 |
| PW23 | 2 |
| Phusion Flash 2x Master mix | 10 |
| ddH20 | 5.5 |
| Cycles | temperature [°C] | Time [s] |
|---|---|---|
| 1 | 98 | 5 |
| 30 | 98 | 1 |
| 67 | 5 | |
| 72 | 40 | |
| 1 | 72 | 300 |
| 1 | 10 | inf |
Results
Fragment F
A
| what | µl |
|---|---|
| B. parabrevis | 1 |
| PW24 | 2 |
| PW14 | 2 |
| Phusion Flash 2x Master mix | 10 |
| ddH20 | 5 |
| Cycles | temperature [°C] | Time [s] |
|---|---|---|
| 1 | 98 | 120 |
| 35 | 98 | 1 |
| 59 | 5 | |
| 72 | 60 | |
| 1 | 72 | 300 |
| 1 | 10 | inf |
Results
The gel was overloaded, which might be due to the polymerase, as Q5 was usually used in previous samples and bright bands are visible for all fragments. For optimization, the annealing-temperature could be increased by 1 - 2°C and cycle repetition may be reduced to 30 cycles.
B
| what | µl |
|---|---|
| B. parabrevis | 1 |
| PW24 | 2 |
| PW14 | 2 |
| Phusion Flash 2x Master mix | 10 |
| ddH20 | 5 |
| Cycles | temperature [°C] | Time [s] |
|---|---|---|
| 1 | 98 | 120 |
| 30 | 98 | 1 |
| 61 | 5 | |
| 72 | 60 | |
| 1 | 72 | 300 |
| 1 | 10 | inf |
Results
Fragment G
A
| what | µl |
|---|---|
| pSB1C3 | 1 |
| PW22 | 2 |
| PW23 | 2 |
| Phusion Flash 2x Master mix | 10 |
| ddH20 | 5 |
| Cycles | temperature [°C] | Time [s] |
|---|---|---|
| 1 | 98 | 5 |
| 35 | 98 | 1 |
| 66 | 5 | |
| 72 | 40 | |
| 1 | 72 | 300 |
| 1 | 10 | inf |
Results
The gel was overloaded, which might be due to a too low dilution of Medi-Prep and hence too much template. For optimization use less template and take it from a more diluted sample.
B
| what | µl |
|---|---|
| pSB1C3 | 0.5 |
| PW22 | 2 |
| PW23 | 2 |
| Phusion Flash 2x Master mix | 10 |
| ddH20 | 5.5 |
| Cycles | temperature [°C] | Time [s] |
|---|---|---|
| 1 | 98 | 5 |
| 35 | 98 | 1 |
| 66 | 5 | |
| 72 | 40 | |
| 1 | 72 | 300 |
| 1 | 10 | inf |
Results
Still the gel is overloaded, though less template was used. For the next time, reduce cycle repetitin from 35 to 30 and increase annealing temperature by 1°C
C
| what | µl |
|---|---|
| pSB1C3 | 0.5 |
| PW22 | 2 |
| PW23 | 2 |
| Phusion Flash 2x Master mix | 10 |
| ddH20 | 5.5 |
| Cycles | temperature [°C] | Time [s] |
|---|---|---|
| 1 | 98 | 5 |
| 30 | 98 | 1 |
| 67 | 5 | |
| 72 | 40 | |
| 1 | 72 | 300 |
| 1 | 10 | inf |
Results
Fragment H
A
| what | µl |
|---|---|
| B. parabrevis | 1 |
| PW19 | 2 |
| PW20 | 2 |
| Phusion Flash 2x Master mix | 10 |
| ddH20 | 5 |
| Cycles | temperature [°C] | Time [s] |
|---|---|---|
| 1 | 98 | 120 |
| 35 | 98 | 1 |
| 59 | 5 | |
| 72 | 60 | |
| 1 | 72 | 300 |
| 1 | 10 | inf |
Results
The gel was overloaded, which might be due to the polymerase, as Q5 was usually used in previous samples and bright bands are visible for all fragments. For optimization, the annealing-temperature could be increased by 1 - 2°C and cycle repetition may be reduced to 30 cycles.
B
| what | µl |
|---|---|
| B. parabrevis | 1 |
| PW19 | 2 |
| PW20 | 2 |
| Phusion Flash 2x Master mix | 10 |
| ddH20 | 5 |
| Cycles | temperature [°C] | Time [s] |
|---|---|---|
| 1 | 98 | 120 |
| 30 | 98 | 1 |
| 61 | 5 | |
| 72 | 60 | |
| 1 | 72 | 300 |
| 1 | 10 | inf |
Results
Fragment I
A
| what | µl |
|---|---|
| B. parabrevis | 1 |
| PW21 | 2 |
| PW14 | 2 |
| Phusion Flash 2x Master mix | 10 |
| ddH20 | 5 |
| Cycles | temperature [°C] | Time [s] |
|---|---|---|
| 1 | 98 | 120 |
| 35 | 98 | 1 |
| 59 | 5 | |
| 72 | 60 | |
| 1 | 72 | 300 |
| 1 | 10 | inf |
Results
The gel was overloaded, which might be due to the polymerase, as Q5 was usually used in previous samples and bright bands are visible for all fragments. For optimization, the annealing-temperature could be increased by 1 - 2°C and cycle repetition may be reduced to 30 cycles.
B
| what | µl |
|---|---|
| B. parabrevis | 1 |
| PW21 | 2 |
| PW14 | 2 |
| Phusion Flash 2x Master mix | 10 |
| ddH20 | 5 |
| Cycles | temperature [°C] | Time [s] |
|---|---|---|
| 1 | 98 | 120 |
| 30 | 98 | 1 |
| 61 | 5 | |
| 72 | 60 | |
| 1 | 72 | 300 |
| 1 | 10 | inf |
Results
Quantification-gels
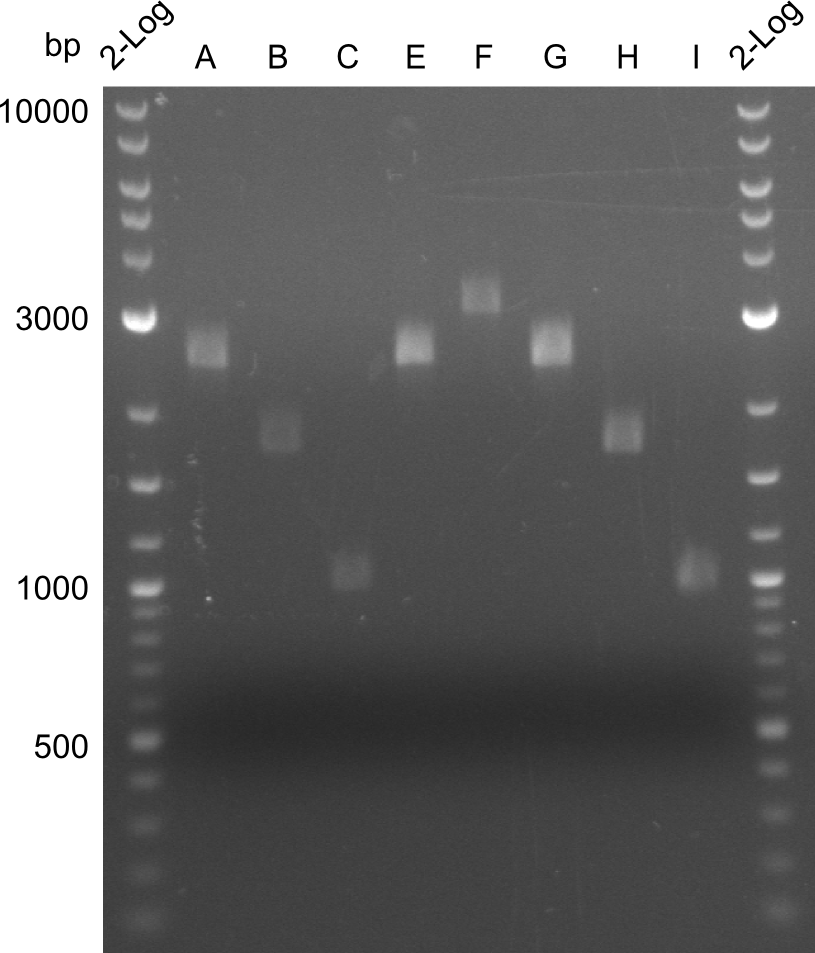
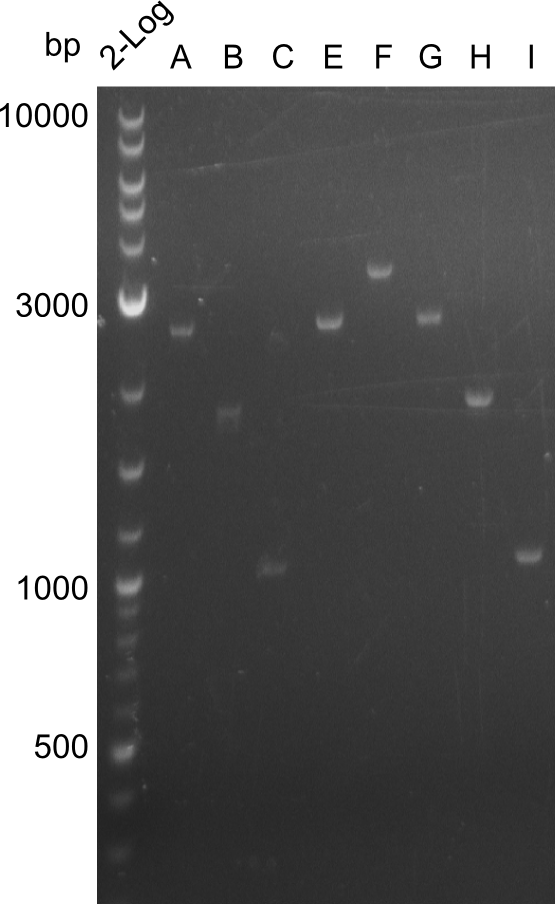
For the further work, the amount of DNA available has to be quantified. We decided to do this by a quantification gel in order to check the right sizes of the constructs. The fragments A, E and G from the first PCR were not used due to the big smear and the double-bands, instead the bands obtained in the second PCR were taken for the quantification.
The bands did not have a definite size, hence they are not useful to work with due to unwanted byproducts that are obviously present. After the optimizations regarding annealing-temperature and cycle-repetition, the following bands were obtained during quantification
Here, the bands have a definded size and a sufficient quantity to work with. The quantification for fragment D was carried out later, as the amplification of those fragments happened later.
RFC10 Standardization of Tyc Modules
Tyc C5
| what | µl |
|---|---|
| Bacillus | 1 |
| AT05 | 2 |
| AT06 | 2 |
| Q5 2x Master mix | 10 |
| ddH20 | 5 |
| Cycles | temperature [°C] | Time [s] |
|---|---|---|
| 1 | 98 | 2:00 |
| 35 | 98 | 10 |
| 61 | 0:30 | |
| 72 | 1:00 | |
| 1 | 72 | 2:00 |
| 1 | 10 | inf |
Tyc C6
| what | µl |
|---|---|
| Bacillus | 1 |
| AT07 | 2 |
| AT08 | 2 |
| Q5 2x Master mix | 10 |
| ddH20 | 5 |
| Cycles | temperature [°C] | Time [s] |
|---|---|---|
| 1 | 98 | 2:00 |
| 35 | 98 | 10 |
| 56 | 0:30 | |
| 72 | 1:00 | |
| 1 | 72 | 2:00 |
| 1 | 10 | inf |
Tyc A 2013-08-20
Since neither Tyc B1, C5, C6 where succesfully amplified and Tyc A was rather a light band we decided to first find the optimal protocol for Tyc A. Also the Q5 Polymerase was contaminated we decided to use Phusion Flash which is faster and cheaper than the Q5.
Optimiziation A
- Reaction
| what | µl |
|---|---|
| Bacillus | 1 |
| AT01 | 2 |
| AT02 | 2 |
| Phusion Flash 2x Master Mix | 10 |
| DMSO | 1 |
| ddH20 | 5 |
- Condition I
| Cycles | temperature [°C] | Time [min:s] |
|---|---|---|
| 1 | 98 | 2:00 |
| 35 | 98 | 0:01 |
| 56 | 0:05 | |
| 72 | 0:55 | |
| 1 | 72 | 5:00 |
| 1 | 10 | inf |
- Conditions II
| Cycles | temperature [°C] | Time [min:s] |
|---|---|---|
| 1 | 98 | 2:00 |
| 14 | 98 | 0:01 |
| 59 ↓0.5 | 0:05 | |
| 72 | 0:55 | |
| 16 | 98 | 0:01 |
| 56 | 0:05 | |
| 72 | 0:55 | |
| 1 | 72 | 5:00 |
| 1 | 10 | inf |
- Conditions III
| Cycles | temperature [°C] | Time [min:s] |
|---|---|---|
| 1 | 98 | 2:00 |
| 30 | 98 | 0:01 |
| 72 | 0:55 | |
| 1 | 72 | 5:00 |
| 1 | 10 | inf |
Tyc B1 2013-08-21
- Reaction
| what | µl |
|---|---|
| Bacillus | 1 |
| AT03 | 2 |
| AT04 | 2 |
| Phusion Flash 2x Master Mix | 10 |
| DMSO | 1 |
| ddH20 | 5 |
- Condition
| Cycles | temperature [°C] | Time [min:s] |
|---|---|---|
| 1 | 98 | 2:00 |
| 35 | 98 | 0:01 |
| 56 | 0:05 | |
| 72 | 0:55 | |
| 1 | 72 | 5:00 |
| 1 | 10 | inf |
Tyc C5 2013-08-21
| what | µl |
|---|---|
| Bacillus | 1 |
| AT05 | 2 |
| AT06 | 2 |
| Phusion Flash 2x Master Mix | 10 |
| DMSO | 1 |
| ddH20 | 5 |
- Condition
| Cycles | temperature [°C] | Time [min:s] |
|---|---|---|
| 1 | 98 | 2:00 |
| 35 | 98 | 0:01 |
| 61 | 0:05 | |
| 72 | 0:55 | |
| 1 | 72 | 5:00 |
| 1 | 10 | inf |
Tyc C6 2013-08-21
| what | µl |
|---|---|
| Bacillus | 1 |
| AT07 | 2 |
| AT08 | 2 |
| Phusion Flash 2x Master Mix | 10 |
| DMSO | 1 |
| ddH20 | 5 |
- Condition
| Cycles | temperature [°C] | Time [min:s] |
|---|---|---|
| 1 | 98 | 2:00 |
| 35 | 98 | 0:01 |
| 56 | 0:05 | |
| 72 | 0:55 | |
| 1 | 72 | 5:00 |
| 1 | 10 | inf |
Tyc B1 2013-08-22
- Reaction
| what | µl |
|---|---|
| Bacillus | 1 |
| AT03 | 2 |
| AT04 | 2 |
| Phusion Flash 2x Master Mix | 10 |
| DMSO | 1 |
| ddH20 | 5 |
- Conditions II
| Cycles | temperature [°C] | Time [min:s] |
|---|---|---|
| 1 | 98 | 2:00 |
| 14 | 98 | 0:01 |
| 63 ↓0.5 | 0:05 | |
| 72 | 0:55 | |
| 16 | 98 | 0:01 |
| 58 | 0:05 | |
| 72 | 0:55 | |
| 1 | 72 | 5:00 |
| 1 | 10 | inf |
Tyc C5 2013-08-22
- Reaction
| what | µl |
|---|---|
| Bacillus | 1 |
| AT05 | 2 |
| AT06 | 2 |
| Phusion Flash 2x Master Mix | 10 |
| DMSO | 1 |
| ddH20 | 4 |
- Conditions II
| Cycles | temperature [°C] | Time [min:s] |
|---|---|---|
| 1 | 98 | 2:00 |
| 14 | 98 | 0:01 |
| 61 ↓0.5 | 0:05 | |
| 72 | 0:55 | |
| 16 | 98 | 0:01 |
| 63 | 0:05 | |
| 72 | 0:55 | |
| 1 | 72 | 5:00 |
| 1 | 10 | inf |
Tyc B1 2013-08-23
B 23-08-2013
- Reaction
| what | µl |
|---|---|
| Bacillus | 1 |
| AT03 | 2 |
| AT04 | 2 |
| Phusion Flash 2x Master Mix | 10 |
| DMSO | 1.5 |
| ddH20 | 3.5 |
- Conditions
| Cycles | temperature [°C] | Time [min:s] |
|---|---|---|
| 1 | 98 | 2:00 |
| 35 | 98 | 0:01 |
| 63 | 0:05 | |
| 72 | 0:50 | |
| 1 | 72 | 5:00 |
| 1 | 10 | inf |
Tyc C5 2013-08-23
B 23-08-2013
- Reaction I
| what | µl |
|---|---|
| Bacillus | 1 |
| AT05 | 2 |
| AT06 | 2 |
| Phusion Flash 2x Master Mix | 10 |
| DMSO | 1.5 |
| ddH20 | 3.5 |
- Reaction II
| what | µl |
|---|---|
| Bacillus | 1 |
| AT05 | 2 |
| AT06 | 2 |
| Phusion Flash 2x Master Mix | 10 |
| DMSO | 1 |
| ddH20 | 4 |
- Conditions
| Cycles | temperature [°C] | Time [min:s] |
|---|---|---|
| 1 | 98 | 2:00 |
| 35 | 98 | 0:01 |
| 63 | 0:05 | |
| 72 | 0:50 | |
| 1 | 72 | 5:00 |
| 1 | 10 | inf |
Final validation of BAP-I-cells and Mass-Spectrometry
SDS-PAGEs of positive BAP-I-cells (Dipeptide & Tripeptide I)
As the SDS-PAGE carried out the week before was unfortunately not successful (no bands were showing up at all), we concluded that the use of another loading buffer, in which the samples are boiled would be useful.
Recipe for loading buffer
The new recipe is as follows:
- 800 µl ddH20
- 250 µl 0.5M Tris-HCl (pH = ~7.3) (i.e. dissolve 302.5 mg Tris in 5 ml and bring to appropriate pH with HCl)
- 400 µl Glycerol 50%
- 400 µl SDS 10%
- 100 µl β-Mercaptoethanol 99%
- bromophenol-blue
Procedure
- Take 1 ml culture in 1.5 ml Eppi
- centrifuge at 13,000 rpm for 10 minutes
- discard supernatant
- resuspend pellet in 100 µl loading buffer (eventually OD-normalize amount of loading buffer)
- boil with closed lids at 98°C for at least 10 minutes under the hood
- cool down (or freeze samples and thaw them again)
- centrifuge at 13,000 rpm for 10 minutes
- load max. 25 µl in SDS-Gel
- use 10 µl BSA-Standard
- let run for 1 hour at 180 V
Results
Two seperate SDS-PAGEs were conducted using the protocol described above.
blue arrows indicate the desired synthetases. For the synthetases of Dipeptide and the Tripeptide-I 212 kDa and 380 kDa bands were expected. The golden arrows indicate a possible lane for the NRPS. For the 380 kDa construct, it is not 100% clear, where one should find it on the gel.
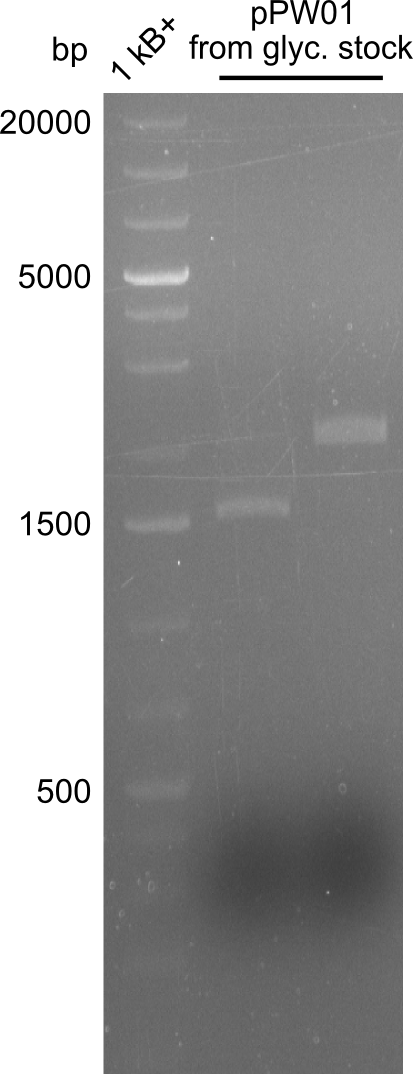
Screening for positive Tetrapeptide-I-colonies
As we did not succeed in finding a positive colony in BAP-I-cells, we decided to continue screening for positive colonies. This however proved to be ineffective as one can see in the image below. All colonies that were grown in liquid culture, prepped and digested with EcoRI and PstI are negative for the insert.
So far, restriction digests were neagtive for Tetrapeptide-I (pPW01) transformed cells, i.e. only the backbone was detectable. For whatever reasons, we had somehow lost the positive plasmids (or couldn't transform them in chemically competent BAP-I cells due to their size. We therefore analyzed the glycerol-stocks we had prepared and performed restriction digests on the plasmids obtained after miniprep.
Both glycerol stocks, the one for DH10β (left image), as well as the one for BAP-I (right image) were clearly negative.
As we however have to functional plasmids, we will focus on the analysis of those and abandon our work on the Tetrapeptide-I-construct pPW01.
Tyrocidine-Indigoidine-Fusion - Cloning & Validation
Gibson Assembly
Gibson assemblies were prepared according to the following formulas:
pPW03 (Phe-Ind)
| fragment | concentration [ng/µl] | volume for gibson assembly [µL] |
|---|---|---|
| A | 12 | 0.89 |
| B | 8 | 4.29 |
| C | 6 | 2.86 |
| D | 35 | 1.96 |
pPW04 (Asn-Ind)
| fragment | concentration [ng/µl] | volume for gibson assembly [µL] |
|---|---|---|
| D | 35 | 3.87 |
| E | 20 | 1.06 |
| F | 20 | 5.08 |
pPW05 (Val-Ind)
| fragment | concentration [ng/µl] | volume for gibson assembly [µL] |
|---|---|---|
| D | 35 | 3.45 |
| G | 15 | 1.26 |
| H | 16 | 3.78 |
| I | 20 | 1.51 |
Transformation
The constructs prepared by gibson assembly were chemically transformed (heat shock) into competent DH10ß.
Restriction Digest
Procedure
DH10ß - colonies were picked and grown overnight in LB with Chloramphenicol. After a miniprep, a restriction digest with EcoRI was performed, the expected bands were:
- pPW03 (Phe-Ind): 5858 and 3183
- pPW04 (Asn-Ind): 5858 and 3582
- pPW05 (Val-Ind): 5858 and 3105
Results
All samples showed the expected bands.
Discussion
Clones pPW03 A, B, C & D; pPW04 B, C & D; pPW05 A, B, C, D, E & F show the expected bands, hence two of each clone were sent to sequencing.
Sequencing & Transformation into BAP-I
Vectors were sequenced with the Primers used for the assembly. All sequences turned out to be positive, hence the minipreps that were sent to sequencing, were used for chemical transformation into BAP-I-cells accoding to the standard protocol. For each transformation 10µl and the rest were plated seperately. After less then two days, blue colonies occured on all plates, hence colony-PCR were performed on 5 colonies of each plate (3 blue ones and 2 white ones).
In parallel, BAP-I-cells were transformed with the remaining Gibson-Mix for pPW03, pPW04 and pPW05. Cells were picked and grown in LB with Chloramphenicol overnight. After miniprep, restricion digest with EcoRI was performed in 20 µl volume. Again, the expected bands were:
- pPW03 (Phe-Ind): 5858 and 3183
- pPW04 (Asn-Ind): 5858 and 3582
- pPW05 (Val-Ind): 5858 and 3105
As these results were not as clear as for the sequenced samples, we did not continue work on the direct BAP-transformants.
Screening PCR for positive BAP-I-colonies
Procedure
In order to screen for positive BAP-I-colonies, blue and white colonies were picked and used in colony-PCR.
Results
Almost all colonies were positive for both modules, except the colonies that were transformed with pPW03 (Phe-Ind). For these constructs, the bands that show up do not match the expected bands:
- expected: xxxx
- obtained: yyyy
Induction, SDS-PAGE & TLC
Procedure
Cells were grown at 37°C and induced at OD600 = ~0.5 with 1mM IPTG. Cultures that were transformed with pPW05 turned blue after about 30 to 60 minutes. Cells were kept at 30°C overnight and the synthetized NRP was extracted and purified from samples. Herefore, 1ml culture was centrifuged at 14,000 rpm for 15 minutes, supernatant was kept for further analysis. The pellet was washed in 1ml Methanol and centrifuged at 14,000 rpm for 15 minutes. Supernatant was kept for further analysis and pellet was resuspended in 500µl DMSO. The crude supernatant, the methanol-wash and the purified NRP were used for TLC. As a control, purified indigoidine (treated with the same protocol) and its washes were used.
As solvent, a mixture of 95% Dichloromethane and 5% Methanol was used. However, all samples were running at the solvent front, hence a less polar solvent, i.e. 100% Dichloromethane was used, and qualitatively better results were obtained.
For the SDS-PAGE, remaining culture was treated as described previously and prepared for SDS-PAGE. Not only pPW05-cells, but also pPW03 and pPW04-positive cells were tested, in order to check for proper expression of the NRPSs.
Results
Discussion
Especially the last TLC-picture nicely shows that the indigoidine-control has a significantly and reproducibly different sunning behavior on the TLC. Different biological replicates (different clones) were used for Valin-Indigoidine and in all cases, it is running lower than the control - as expected.
As far as the SDS-PAGE is concerned, the expected protein sizes are:
- Phe-Ind-NRPS: 247 kDa
- Asn-Ind-NRPS: 261 kDa
- Val-Ind-NRPS: 242 kDa
- Note: the indigoidine-synthetase alone: 145 kDa
As indicated by the blue arrows, the Val-Ind-NRPS is clearly present in all of the tested samples. For the other two NRPSs, there are bands at the expected height, as indicated by the golden arrows, these are however qualitatively not as good as the ones for the Val-Ind-NRPS due to smear or low expression.
RFC10 Standardization of Tyc Modules
new Primer for B1 and a new fw Primer for TycC5
Amplification Tyc B1 and Tyc C5
29-08-2013
- Reaction I
| what | µl |
|---|---|
| Bacillus | 1 |
| AT09/11 | 2 |
| AT10/06 | 2 |
| Phusion Flash 2x Master Mix | 10 |
| DMSO | 1 |
| ddH20 | 4 |
- Conditions II
| Cycles | temperature [°C] | Time [min:s] |
|---|---|---|
| 1 | 98 | 2:00 |
| 14 | 98 | 0:01 |
| 65 ↓0.5 | 0:05 | |
| 72 | 0:55 | |
| 16 | 98 | 0:01 |
| 68 | 0:05 | |
| 72 | 0:55 | |
| 1 | 72 | 5:00 |
| 1 | 10 | inf |
Results of Gel extraction Tyc B1 and Tyc C5
| Sample | concentration ng/µl | Adsorption 260 | Adsorption 280 |
|---|---|---|---|
| H2O | 0.1 | 0.002 | 0.015 |
| B1 | 43.5 | 0.871 | 0.461 |
| C5 | 23.9 | 0.477 | 0.296 |
Restriction Digest
Tyc ADeltaCom, B1, C5, C6 (AT_01 to AT02, AT_09 to AT_10, AT_11 to AT_06, AT_07 to AT_08; xx kb; xx kb ; xx kb; xx kb) with EcoRI-HF and PstI
| what | µl |
|---|---|
| Tyc ADeltaCom, B1, C5, C6 | 20 |
| EcoRI-HF | 1 |
| PstI-HF | 1 |
| Buffer CutSmart | 5 |
| dd H2O | 24 |
Inkubate 37°C 2h
Restriction Digest of pSB1C3 (xx kb) with EcoRI-HF and PstI
| what | µl |
|---|---|
| pSB1C3 | 3 |
| EcoRI-HF | 0.5 |
| PstI-HF | 0.5 |
| Buffer CutSmart | 5 |
| dd H2O | 41 |
Inkubate 37°C 2h
Nucleotide Removal and Concentration Measurement of digested pSB1C3, Tyc ADeltaCom, B1, C5, C6
Concentration measurements showed that DNA was lost with Nucleotide Removal.
Reamplification and RFC10_Modules#Restriction_Digestas above
Detection of short synthetic NRPs
03.09.2013 Pre-test
Pre-test: solubilize the synthetic dipeptide in Methanol; result: very bad solubility => not used for MS comparisons
03.09. - 04.09.2013 Preparation of samples 1-10 for mass spectrometry at neonate screening
Inocculation of BAP1 (Dipeptide I) and BAP1 (Tripeptide I) [Both tested on NRPS content with SDS-PAGE] in LB media. Washing and transfer of cells to M9 minimal media (evening 01.09.2013) and IPTG induction (noon 02.09.2013) of 50 ml (each) culture.
Taking first 15 ml samples after 2.5 hours. Centrifugation (3750 rpm, 4°C, 45 min) and separation of pellet and supernatant (2x ~7,5ml). Freezing with nitrogen and Lyophilization for 12 hours at ~-45°C and ~0,1 mbar.
Second sample (taken 12 hours after induction) and third one (21 hours after induction) have been treated as the first one.
Inocculation of native BAP1 cells in LB medium, washing in M9 and growing of cultures in M9 as negative reference for mass spec. Same treatment as positive samples.
| Sample number | Content | MS- Ornithine content [µmol/L] |
|---|---|---|
| 1 | Di A in BAP1 in M9+Cm Pellet 21 hrs after induction | 6,05 |
| 2 | Tri I in BAP1 in M9+Cm Pellet 12 hrs after induction | 29,81 |
| 3 | Tri I in BAP1 in M9+Cm Pellet 21 hrs after induction | 40,24 |
| 4 | Tri I in BAP1 in M9+Cm Pellet 2.5 hrs hrs after induction | 27,72 |
| 5 | Di A in BAP1 in M9+Cm Pellet 2.5 hrs after induction | 6,49 |
| 6 | Di A in BAP1 in M9+Cm Pellet 12 hrs after induction | 4,77 |
| 7 | Di A in BAP1 M9+cm Medium 1 2.5 hrs after induction | 4,78 |
| 8 | Tri I in BAP1 M9+Cm Medium 1 2.5 hrs after induction | 166,07 |
| 9 | Di A in BAP1 M9+Cm Medium 2 2.5 hrs after induction | 7,09 |
| 10 | Tri 1 in BAP1 M9+Cm Medium 2 2.5 hrs after induction | 173,36 |
Samples 1-6 contained different pellets, which have been resuspended in 500 µL PBS Buffer (1X) and treated with 3x20[s] ultra-sonification. Finally the samples have been centrifuged and supernatant decanted to 1.5 ml tubes for mass spectrometry at neonate screening.
Samples 7-10 contained lyophilized Medium and have been resuspended in 500 µL methanol for MS screening. As samples 1-6, supernatant was separated from solid contents and decanted to 1.5ml tubes. 100 µL were handed for MS at neonate screening. The rest has been frozen for hydrolysis.
05.09.-06.09.2013 Preparation of samples 11-21 for mass spectrometry at neonate screening
Samples treated as samples 1-10.
| Sample number | Content | MS result (Ornithine) |
|---|---|---|
| 11 | Di A in BAP1 M9+Cm after 12 hrs after induction Medium 1 | 15,5 |
| 12 | Di A in BAP1 M9+Cm after 21 hrs after induction Medium 1 | 10,2 |
| 13 | Di A in BAP1 M9+Cm after 21 hrs after induction Medium 2 | 10,7 |
| 14 | Di A in BAP1 M9+Cm after 21 hrs after induction Medium 3 | 7,8 |
| 15 | TriI in BAP1 M9+Cm after 12 hrs after induction Medium 1 | 1138,0 |
| 16 | TriI in BAP1 M9+Cm after 21 hrs after induction Medium 1 | 879,1 |
| 17 | TriI in BAP1 M9+Cm after 21 hrs after induction Medium 2 | 1343,4 |
| 18 | TriI in BAP1 M9+Cm after 21 hrs after induction Medium 3 | 1324,4 |
| 19 | BAP1 native M9 after 12 hrs after induction Medium 1 | 73,8 |
| 20 | BAP1 native M9 after 12 hrs after induction Medium 2 | 18,4 |
| 21 | BAP1 native M9 after 12 hrs after induction Pellet | 8,2 |
Samples with "H" are hydrolysates (6 M HCL at 105° over night). Those were hydrolysed over night, evaporated and neutralized for MS. Resolved supernatant for "media" samples has been analysed separately for the methanol supernatant and solid phase (marked with "sol").
| Sample number | Content | MS result |
|---|---|---|
| H 1 | Di A in BAP1 in M9+Cm Pellet 21 hrs after induction | not needed |
| H 2 | Tri I in BAP1 in M9+Cm Pellet 12 hrs after induction | not needed |
| H 3 | Tri I in BAP1 in M9+Cm Pellet 21 hrs after induction | not needed |
| H 4 | Tri I in BAP1 in M9+Cm Pellet 2.5 hrs after induction | not needed |
| H 5 | Di A in BAP1 in M9+Cm Pellet 2.5 hrs after induction | not needed |
| H 6 | Di A in BAP1 in M9+Cm Pellet 12 hrs after induction | not needed |
| H 7 | Di A in BAP1 M9+cm Medium 1 2.5 hrs after induction | not needed |
| H 8 | Tri I in BAP1 M9+Cm Medium 1 2.5 hrs after induction | not needed |
| H 9 | Di A in BAP1 M9+Cm Medium 2 2.5 hrs after induction | not needed |
| H 10 | Tri 1 in BAP1 M9+Cm Medium 2 2.5 hrs after induction | not needed |
| H 11 | Di A in BAP1 M9+Cm 12 hrs after induction Medium 1 | not needed |
| H 11 sol | Di A in BAP1 M9+Cm 12 hrs after induction Medium 1 | not needed |
| H 12 | Di A in BAP1 M9+Cm 21 hrs after induction Medium 1 | not needed |
| H 12 sol | Di A in BAP1 M9+Cm 21 hrs after induction Medium 1 | not needed |
| H 13 | Di A in BAP1 M9+Cm 21 hrs after induction Medium 2 | not needed |
| H 13 sol | Di A in BAP1 M9+Cm 21 hrs after induction Medium 2 | not needed |
| H 14 | Di A in BAP1 M9+Cm 21 hrs after induction Medium 3 | not needed |
| H 14 sol | Di A in BAP1 M9+Cm 21 hrs after induction Medium 3 | not needed |
| H 15 | TriI in BAP1 M9+Cm 12 hrs after induction Medium 1 | not needed |
| H 15 sol | TriI in BAP1 M9+Cm 12 hrs after induction Medium 1 | not needed |
| H 16 | TriI in BAP1 M9+Cm 21 hrs after induction Medium 1 | not needed |
| H 16 sol | TriI in BAP1 M9+Cm 21 hrs after induction Medium 1 | not needed |
| H 17 | TriI in BAP1 M9+Cm 21 hrs after induction Medium 2 | not needed |
| H 17 sol | TriI in BAP1 M9+Cm 21 hrs after induction Medium 2 | not needed |
| H 18 | TriI in BAP1 M9+Cm 21 hrs after induction Medium 3 | 273,3 |
| H 18 sol | TriI in BAP1 M9+Cm 21 hrs after induction Medium 3 | not needed |
| H 19 | BAP1 native M9 12 hrs after induction Medium 1 | not needed |
| H 19 sol | BAP1 native M9 12 hrs after induction Medium 1 | not needed |
| H 20 | BAP1 native M9 12 hrs after induction Medium 2 | not needed |
| H 21 | BAP1 native M9 12 hrs after induction Pellet | not needed |
09.09.-11.09.2013 further preparation for MS at chemistry
Preparation of cultures containing di- and tripeptide for MS (inocculation of LB, washing in M9, transfer to M9 and IPTG induction). IPTG induction at 12 p.m. 10.09., samples taken after 8.5 and 24 and 48 hours. Procedure as mentioned above (lysis, lophylisation etc.), but took pellet from 10 ml and lyophilized 7.5 ml supernatant again.
Results of hydrolysis (05.09.-06.09): A Maillard reaction occurred! Everything brown and many different products (as bonds between amino acids and sugars) arised during cooking in HCL (this protocol seems to be only used for pure peptide solutions). Therefore we have to search for other enzymatic reactions or other strategies to assess ornithine concentrations. Tried to rescue samples by an alkaline reaction with 5 M NaOH, but samples got only slightly lighter.
| Sample number | Content | MS result |
|---|---|---|
| 22 | DiA in BAPI Pellet in M9+Cm+IPTG 8.5 hrs after induction 10.09.2013 | 13,0 |
| 23 | TriI in BAPI Pellet in M9+Cm+IPTG 8.5 hrs after induction 10.09.2013 | 33,5 |
| 24 | Di A in BAPI Pellet1 in M9+Cm+IPTG 24 hrs after induction 11.09.2013 | 19,4 |
| 25 | TriI in BAPI Pellet1 in M9+Cm+IPTG 24 hrs after induction 11.09.2013 | 88,0 |
| 26 | Di A in BAPI Pellet2 in M9+Cm+IPTG 24 hrs after induction 11.09.2013 | 11,2 |
| 27 | TriI in BAPI Pellet2 in M9+Cm+IPTG 24 hrs after induction 11.09.2013 | 119,4 |
| 28 | DiA in BAPI Medium in M9+Cm+IPTG 8.5 hrs after induction 10.09.2013 | 7,8 |
| 29 | TriI in BAPI Medium in M9+Cm+IPTG 8.5 hrs after induction 10.09.2013 | 582,1 |
| 30 | Di A in BAPI Medium1 in M9+Cm+IPTG 24 hrs after induction 11.09.2013 | 13,9 |
| 31 | Di A in BAPI Medium2 in M9+Cm+IPTG 24 hrs after induction 11.09.2013 | 6,3 |
| 32 | TriI in BAPI Medium1 in M9+Cm+IPTG 24 hrs after induction 11.09.2013 | 520,2 |
| 33 | TriI in BAPI Medium2 in M9+Cm+IPTG 24 hrs after induction 11.09.2013 | 504,5 |
| 34 | Di A in BAPI Pellet in M9+Cm+IPTG 48 hrs after induction 12.09.2013 | 263,3 |
| 35 | Di A in BAPI Medium in M9+Cm+IPTG 48 hrs after induction 12.09.2013 | 498,2 |
| 36 | TriI in BAPI Pellet in M9+Cm+IPTG 48 hrs after induction 12.09.2013 | 373,7 |
| 37 | TriI in BAPI Medium in M9+Cm+IPTG 48 hrs after induction 12.09.2013 | 356,6 |
12.09.further preparation and delievery to MS at chemistry
Resuspension of lyophilized samples in 500 microliters methanol. Delievery of samples 25 and 26 to MS. Other samples to neonate screening.
RFC10 Standardization of Tyc Modules
Ligation of digested Fragments each with linearized pSB1C3
DNA Concentration of Digestions
| Fragment | Source | Protocol | Concentration |
|---|---|---|---|
| Tyc AdCom | AT_01/AT_02 | Reamplification 2013-08-31xxx | 5.0 ng/µl |
| Tyc B1 | AT_09/AT_10 | Reamplification 2013-08-31xxx | 22.5 ng/µl |
| Tyc C5 | AT_11/AT_06 | Reamplification 2013-08-31xxx | 19.2 ng/µl |
| Tyc C6 | AT_07/AT_08 | Reamplification 2013-08-31xxx | 35.7 ng/µl |
| pSB1C3 | mediprep of ONC | - | 14.4 ng/µl |
Reaction
1:1 Ratio of pSB1C3:insert
| Fragment | Size [kb] | Concentration [ng/µL] | Amount for Reaction [µL] | 10x T4 DNA Lig Buffer [µL] | T4 DNA Ligase [µL] | +ddH2O |
|---|---|---|---|---|---|---|
| add Backbone pSB1C3; 4.2 kb; 14.4 ng/µl | 3.5 | |||||
| Tyc AdCom | 3.2 | 5.0 ng/µl | 7.6 | 2 | 1 | 5.9 |
| Tyc B1 | 3.2 | 22.5 ng/µl | 1.7 | 11.8 | ||
| Tyc C5 | 3.2 | 19.2 ng/µl | 2 | 11.5 | ||
| Tyc C6 | 3.9 | 35.7 ng/µl | 1.5 | 12 | ||
Transformation (Standard Protocol) into TOP10
2 plates per Ligation one with less one with more transformed cells.
Picking & Screening I
picked red clones Picked 3 clones per plate= 6 clones per construct
Colony PCR with Amplification Primers
Phusion Flash Colony PCR (see amplification protocols above)
Result NO Product?!
Screening Colony PCR with VR_rv and VF2_fw
iTaq Colony PCR Result NO Product?!
Picking & Screening II
NEGATIVE RESULTS BEFORE BECAUSE: mrfp was replaced by insert thus the positive colonies are WHITE!!! Picked white colonies
Screening PCR
Screened all picked colonies of one fragment: positive Screened one clone per fragment: positive
Tyrocidine-Indigoidine-Fusion - Standardization of Constructs
So far, the Tyrocidine-Indigoidine-fusion constructs had two illegal cutting sites of RFC-10 restriction enzymes. Hence, we tried a CPEC-approach for which we reamplified a fragment from the vector with primers that introduced a mutation at the desired position.
Amplification
| what | µl |
|---|---|
| pPW05 (dil.) | 1 |
| RB68 | 2 |
| RB69 | 2 |
| Phusion Flash 2x Master Mix | 10 |
| ddH20 | 5 |
| Cycles | temperature [°C] | Time [min:s] |
|---|---|---|
| 1 | 98 | 0:05 |
| 35 | 98 | 0:05 |
| 59 | 0:10 | |
| 72 | 3:00 | |
| 1 | 72 | 10:00 |
| 1 | 10 | inf |
Results
CPEC
After gel-extraction of the large fragment, the following procedure was followed:
- 22µl H2O, 20µl of the large fragment, 2µl of the short fragment, 1µl DpnI and 5µl 10x CutSmart buffer were incubated for 2 hours at 37°C
- Mixture was purified with isoprop, washed with ethanol and eluted in 10µl H2O
- 10µl Phuson Flash Master Mix was added and the followin protocol was run:
| Cycles | temperature [°C] | Time [min:s] |
|---|---|---|
| 1 | 98 | 0:10 |
| 5 | 98 | 0:01 |
| 53 | 0:05 | |
| 72 | 3:00 | |
| 1 | 72 | 10:00 |
| 1 | 10 | inf |
Unfortunately the efficiency of this was not high enough, as no colonies were visible on the plates after heat-shock transformation in BAP-I cells. The Amplification and CPEC will be repeated next week.
Short-Peptide-NRPSs: Mass-Spec
Since we did not receive all results from neonate screening yet, we chose two pellet samples(25 and 26) for delievery to Mass spectrometry.
Result
Too much background, therefore no distinctive peaks could be seen. This could be due to the solvent (DMSO) and other cell lysis products. But at least peaks were displayed, thus salts do not overlap the signal! We will wait for the results from neonate screening to deliever medium samples (solubilized in methanol).
Tyrocidine-Indigoidine fusion - extended
As Valin-Indigoidine and its synthetase could be detected by TLC and SDS-PAGE respectively, we decided to increase the number of Fusion-constructs in order to test Indigoidine as possible tag for NRPs and their synthesis. Herefore, we aim to build the following 7 NRPs:
Amplifications
Protocols
A
| what | µl |
|---|---|
| pIK04 | 1 |
| PW26 | 2 |
| PW27 | 2 |
| Phusion Flash 2x Master Mix | 10 |
| ddH20 | 5 |
| Cycles | temperature [°C] | Time [min:s] |
|---|---|---|
| 1 | 98 | 0:05 |
| 35 | 98 | 0:05 |
| 66 | 0:10 | |
| 72 | 0:50 | |
| 1 | 72 | 10:00 |
| 1 | 10 | inf |
B
| what | µl |
|---|---|
| B. parabrevis | 1 |
| PW28 | 2 |
| PW29 | 2 |
| Phusion Flash 2x Master Mix | 10 |
| ddH20 | 5 |
| Cycles | temperature [°C] | Time [min:s] |
|---|---|---|
| 1 | 98 | 0:05 |
| 35 | 98 | 0:05 |
| 58 | 0:10 | |
| 72 | 0:30 | |
| 1 | 72 | 10:00 |
| 1 | 10 | inf |
C
| what | µl |
|---|---|
| pPW05 | 1 |
| PW30 | 2 |
| PW16 | 2 |
| Phusion Flash 2x Master Mix | 10 |
| ddH20 | 5 |
| Cycles | temperature [°C] | Time [min:s] |
|---|---|---|
| 1 | 98 | 0:05 |
| 35 | 98 | 0:05 |
| 64 | 0:10 | |
| 72 | 2:00 | |
| 1 | 72 | 10:00 |
| 1 | 10 | inf |
D
| what | µl |
|---|---|
| pIK04 | 1 |
| PW37 | 2 |
| PW23 | 2 |
| Phusion Flash 2x Master Mix | 10 |
| ddH20 | 5 |
| Cycles | temperature [°C] | Time [min:s] |
|---|---|---|
| 1 | 98 | 0:05 |
| 35 | 98 | 0:05 |
| 66 | 0:10 | |
| 72 | 0:50 | |
| 1 | 72 | 10:00 |
| 1 | 10 | inf |
E
| what | µl |
|---|---|
| B. parabrevis | 1 |
| PW28 | 2 |
| PW31 | 2 |
| Phusion Flash 2x Master Mix | 10 |
| ddH20 | 5 |
| Cycles | temperature [°C] | Time [min:s] |
|---|---|---|
| 1 | 98 | 0:05 |
| 35 | 98 | 0:05 |
| 63 | 0:10 | |
| 72 | 1:00 | |
| 1 | 72 | 10:00 |
| 1 | 10 | inf |
F
| what | µl |
|---|---|
| B. parabrevis | 1 |
| PW32 | 2 |
| PW29 | 2 |
| Phusion Flash 2x Master Mix | 10 |
| ddH20 | 5 |
| Cycles | temperature [°C] | Time [min:s] |
|---|---|---|
| 1 | 98 | 0:05 |
| 35 | 98 | 0:05 |
| 58 | 0:10 | |
| 72 | 0:30 | |
| 1 | 72 | 10:00 |
| 1 | 10 | inf |
G
| what | µl |
|---|---|
| pPW05 | 1 |
| PW19 | 2 |
| PW31 | 2 |
| Phusion Flash 2x Master Mix | 10 |
| ddH20 | 5 |
| Cycles | temperature [°C] | Time [min:s] |
|---|---|---|
| 1 | 98 | 0:05 |
| 35 | 98 | 0:05 |
| 66 | 0:10 | |
| 72 | 0:50 | |
| 1 | 72 | 10:00 |
| 1 | 10 | inf |
H
| what | µl |
|---|---|
| pIK03 | 1 |
| IK13 | 2 |
| PW33 | 2 |
| Phusion Flash 2x Master Mix | 10 |
| ddH20 | 5 |
| Cycles | temperature [°C] | Time [min:s] |
|---|---|---|
| 1 | 98 | 0:05 |
| 35 | 98 | 0:05 |
| 65 | 0:10 | |
| 72 | 1:40 | |
| 1 | 72 | 10:00 |
| 1 | 10 | inf |
I
| what | µl |
|---|---|
| pPW05 | 1 |
| PW34 | 2 |
| PW16 | 2 |
| Phusion Flash 2x Master Mix | 10 |
| ddH20 | 5 |
| Cycles | temperature [°C] | Time [min:s] |
|---|---|---|
| 1 | 98 | 0:05 |
| 35 | 98 | 0:05 |
| 60 | 0:10 | |
| 72 | 1:40 | |
| 1 | 72 | 10:00 |
| 1 | 10 | inf |
J
| what | µl |
|---|---|
| pIK04 | 1 |
| IK23 | 2 |
| PW23 | 2 |
| Phusion Flash 2x Master Mix | 10 |
| ddH20 | 5 |
| Cycles | temperature [°C] | Time [min:s] |
|---|---|---|
| 1 | 98 | 0:05 |
| 35 | 98 | 0:05 |
| 66 | 0:10 | |
| 72 | 0:50 | |
| 1 | 72 | 10:00 |
| 1 | 10 | inf |
K
| what | µl |
|---|---|
| pIK03 | 1 |
| IK13 | 2 |
| PW35 | 2 |
| Phusion Flash 2x Master Mix | 10 |
| ddH20 | 5 |
| Cycles | temperature [°C] | Time [min:s] |
|---|---|---|
| 1 | 98 | 0:05 |
| 35 | 98 | 0:05 |
| 65 | 0:10 | |
| 72 | 1:40 | |
| 1 | 72 | 10:00 |
| 1 | 10 | inf |
L
| what | µl |
|---|---|
| B. parabrevis | 1 |
| PW36 | 2 |
| PW29 | 2 |
| Phusion Flash 2x Master Mix | 10 |
| ddH20 | 5 |
| Cycles | temperature [°C] | Time [min:s] |
|---|---|---|
| 1 | 98 | 0:05 |
| 35 | 98 | 0:05 |
| 58 | 0:10 | |
| 72 | 0:30 | |
| 1 | 72 | 10:00 |
| 1 | 10 | inf |
M
| what | µl |
|---|---|
| pIK04 | 1 |
| IK16 | 2 |
| PW33 | 2 |
| Phusion Flash 2x Master Mix | 10 |
| ddH20 | 5 |
| Cycles | temperature [°C] | Time [min:s] |
|---|---|---|
| 1 | 98 | 0:05 |
| 35 | 98 | 0:05 |
| 65 | 0:10 | |
| 72 | 3:10 | |
| 1 | 72 | 10:00 |
| 1 | 10 | inf |
N
| what | µl |
|---|---|
| pIK04 | 1 |
| IK16 | 2 |
| PW35 | 2 |
| Phusion Flash 2x Master Mix | 10 |
| ddH20 | 5 |
| Cycles | temperature [°C] | Time [min:s] |
|---|---|---|
| 1 | 98 | 0:05 |
| 35 | 98 | 0:05 |
| 65 | 0:10 | |
| 72 | 3:10 | |
| 1 | 72 | 10:00 |
| 1 | 10 | inf |
Gel-Pictures
Quantification-Gel
Gibson Assembly
pPW06 (Orn-Val-Ind)
| fragment | concentration [ng/µl] | volume for gibson assembly [µL] |
|---|---|---|
| A | 40 | 1.61 |
| B | 35 | 0.92 |
| C | 30 | 6.97 |
| D | 40 | 0.50 |
pPW07 (Orn-Val-Val-Ind)
| fragment | concentration [ng/µl] | volume for gibson assembly [µL] |
|---|---|---|
| A | 40 | 1.16 |
| C | 30 | 4.32 |
| D | 40 | 0.36 |
| E | 20 | 3.49 |
| F | 35 | 0.66 |
pPW08 (Val-Val-Ind)
| fragment | concentration [ng/µl] | volume for gibson assembly [µL] |
|---|---|---|
| C | 30 | 6.07 |
| F | 35 | 0.93 |
| G | 40 | 1.63 |
| OldG | 15 | 1.36 |
pPW09 (Pro-Leu-Ind)
| fragment | concentration [ng/µl] | volume for gibson assembly [µL] |
|---|---|---|
| H | 20 | 6.35 |
| I | 40 | 3.02 |
| J | 25 | 0.63 |
pPW10 (Pro-Leu-Val-Ind)
| fragment | concentration [ng/µl] | volume for gibson assembly [µL] |
|---|---|---|
| C | 30 | 4.58 |
| J | 20 | 0.66 |
| K | 25 | 4.23 |
| L | 40 | 0.53 |
pPW11 (Phe-Orn-Leu-Ind)
| fragment | concentration [ng/µl] | volume for gibson assembly [µL] |
|---|---|---|
| I | 40 | 0.58 |
| J | 20 | 0.15 |
| M | 5 | 9.27 |
pPW12 (Phe-Orn-Leu-Val-Ind)
| fragment | concentration [ng/µl] | volume for gibson assembly [µL] |
|---|---|---|
| C | 30 | 1.77 |
| J | 20 | 0.26 |
| L | 40 | 0.20 |
| N | 10 | 7.77 |
Cells were transformed with 1 µl and 14 µl 1:2 diluted Gibson-Mix.
Screening for positive transformants
Colony-PCR
First, there were colonies visible for the transformants of pPW09, pPW11 and pPW12. Later colonies for pPW06 and pPW10 followed.
Restriction Digest
Positive samples were digested with restriction digest with EcoRI. The expected sizes of bands were:
- pPW06:
- pPW09:
- pPW10:
- pPW11:
After only 20 minutes of running, the bands were not yet clearly separated. Waiting for another 20 minutes lead to a interpretable result.
==RFC10 Standardization of Tyc Modules==
Sequencing
| Primer | OK? | Comments | File |
|---|---|---|---|
| Tyc AdCom | |||
| VR_rv | - | File:Heidelberg RFC10 TycASeq.zip | |
| VF2_fw | - | File:Heidelberg RFC10 TycASeq.zip | |
| Tyc B1 | |||
| VR_rv | silent mutations: 4595 GCC (Ala) to GCG (Ala); 4598 CTT (Leu) to CTG (Leu) | File:Heidelberg RFC10 TycB1Seq.zip | |
| VF2_fw | File:Heidelberg RFC10 TycB1Seq.zip | ||
| Tyc C5 | |||
| VR_rv | backbone was ok, wrong insert; since the insert was amplified with the same protocol like TycB1 we think that the primers were mixed up | File:Heidelberg RFC10 TycC5Seq.zip | |
| VF2_fw | backbone was ok, wrong insert; since the insert was amplified with the same protocol like TycB1 we think that the primers were mixed up | File:Heidelberg RFC10 TycC5Seq.zip | |
| Tyc C6 | |||
| VR_rv | File:Heidelberg RFC10 TycC6Seq.zip | ||
| VF2_fw | silent mutations: 4595 GTA (Val) to GTG (Val) | File:Heidelberg RFC10 TycC6Seq.zip | |
Tyrocidine-Indigoidine-fusion - standardization
So far, the Tyrocidine-Indigoidine-fusion constructs had two illegal cutting sites of RFC-10 restriction enzymes. Hence, we tried a CPEC-approach for which we reamplified a fragment from the vector with primers that introduced a mutation at the desired position.
Amplification
| what | µl |
|---|---|
| pPW05 (dil.) | 1 |
| RB68 | 2 |
| RB69 | 2 |
| Phusion Flash 2x Master Mix | 10 |
| ddH20 | 5 |
| Cycles | temperature [°C] | Time [min:s] |
|---|---|---|
| 1 | 98 | 0:05 |
| 35 | 98 | 0:05 |
| 59 | 0:10 | |
| 72 | 3:00 | |
| 1 | 72 | 10:00 |
| 1 | 10 | inf |
Results
CPEC
After gel-extraction of the large fragment, the following procedure was followed:
- 22µl H2O, 20µl of the large fragment, 2µl of the short fragment, 1µl DpnI and 5µl 10x CutSmart buffer were incubated for 2 hours at 37°C
- Mixture was purified with isoprop, washed with ethanol and eluted in 10µl H2O
- 10µl Phuson Flash Master Mix was added and the followin protocol was run:
| Cycles | temperature [°C] | Time [min:s] |
|---|---|---|
| 1 | 98 | 0:10 |
| 5 | 98 | 0:01 |
| 53 | 0:05 | |
| 72 | 3:00 | |
| 1 | 72 | 10:00 |
| 1 | 10 | inf |
Validation
In order to validate colonies that were transformed with the CPEC-Mix, Restriction digest and sequencing was performed. As the unwanted restriction sites should have been mutated in the positive samples, using EcoRI as restriction enzyme should yield a single band at the size of the linearized vector (9049bp for pPW03, 9448bp for pPW04 and 8971bp for pPW05). Restriction digest was conducted with the standard protocol in a 20µl reaction volume.
The image on the lefthand-side shows the gel after 20 minutes at 100V, as this did not lead to good separation, the gel was let run for another 20 minutes. The gel after 40 minutes is displayed on the right side.
The sample for pPW01 and samples 1 and 3 for pPW05 were sent to sequencing as they migrated at the expected size.
Parallel-approach: Reassembly
In order to have a second pillar to lean on, we decided to reamplify fragment D (indC) without the two restriction restriction sites. The template for this was created by the Indigoidine-group which had used the CPEC-approach described above.
| what | µl |
|---|---|
| indC* | 0.5 |
| PW15 | 2 |
| PW16 | 2 |
| Phusion Flash 2x Master mix | 10 |
| ddH20 | 5.5 |
| Cycles | temperature [°C] | Time [s] |
|---|---|---|
| 1 | 98 | 5 |
| 12 | 98 | 5 |
| 61 | 5 | |
| 72 | 100 | |
| 23 | 98 | 5 |
| 58 | 10 | |
| 72 | 100 | |
| 1 | 72 | 600 |
| 1 | 10 | inf |
We obtained (as expected) clearly visible, bright bands at the expected fragment size (~4000bp)
Short-Peptide-NRPSs: Mass-Spectrometry
We received the results from the neonate screening: the Tripeptide-I shows highly elevated ornithine levels in comparison to the Dipeptide! Results of all samples analyzed by MS at neonate screening.
Samples 12 and 17 should be considered for re-analysis by mass spectrometry, since pellet samples did not show specific peaks at HR-ESI MS. Peaks were expected at 228,2881 Da (Dipeptide) and 392,49248 Da (Tripeptide-I). E/Z profile for the Dipeptide and E/Z profile for the Tripeptide I.
ccdb Construct
Amplification
ccdb-C(tycC2)-indC plasmid (pJS01) Amplification of C(tycC2), ccdB and pSB1C3 DNA fragments (indC was stored in the fridge from former experiments).
- ccdB pcr contents
| What | µl |
|---|---|
| primer_fw (PW38) | 2 |
| primer_rv (PW41) | 2 |
| template (Gateway pDONR vector) | 2 |
| Phusion Flash 2x Master Mix | 10 |
| ddH20 | 4 |
- PCR-Program ccdB sequence
| Cycles | Temperature [°C] | Time [min:s] |
|---|---|---|
| 1 | 98 | 0:10 |
| 8 | 98 | 0:01 |
| 70 ↓0.5 | 0:05 | |
| 72 | 0:15 | |
| 28 | 98 | 0:01 |
| 65 | 0:05 | |
| 72 | 0:15 | |
| 1 | 72 | 1:30 |
| 1 | 10 | inf |
- pSB1C3 PCR contents
| wWhat | µl |
|---|---|
| primer_fw (PW23) | 2 |
| primer_rv (PW42) | 2 |
| template (pSB1C3) | 0.5 |
| Phusion Flash 2x Master Mix | 10 |
| ddH20 | 5.5 |
- PCR-Program pSB1C3 sequence
| Cycles | Temperature [°C] | Time [min:s] |
|---|---|---|
| 1 | 98 | 2:00 |
| 35 | 98 | 0:05 |
| 60 | 0:20 | |
| 72 | 1:00 | |
| 1 | 72 | 10:00 |
| 1 | 10 | inf |
- C(TycC2) PCR contents
| What | µl |
|---|---|
| primer_fw(PW21) | 2 |
| primer_rv(PW14) | 2 |
| template (B. Parabrevis) | 1 |
| Phusion Flash 2x Master Mix | 10 |
| ddH20 | 5 |
- PCR-Program C(TycC2)
| Cycles | Temperature [°C] | Time [min:s] |
|---|---|---|
| 1 | 98 | 2:00 |
| 35 | 98 | 0:01 |
| 59 | 0:05 | |
| 72 | 1:00 | |
| 1 | 72 | 5:00 |
| 1 | 10 | inf |
After amplification, an analytical gel electrophoresis was run to quantify DNA concentrations.
- C(TycC2) PCR contents
| What | Size [bp] | Estimated concentration |
|---|---|---|
| pSB1C3 | 2500 | 35 |
| ccdB | 600 | 30 |
| C(TycC2) | 1000 | 30 |
| indC | 4000 | 100 |
Assembly
Gibson assembly was followed by purification with isopropanol and transformation by heat shock into ccdB resistent and non-resistent (Top10) cells.
After 10 hours of culture growth, colony PCRs and test digests with Pst1 and EcoRI were conducted. Afterwards, minipreps of cultures containing the plasmids and concentration measurements were performed accompanied by test digests. Finally, positive constructs were transformed again and prepared for sequencing.
- ccdB nanodrop measurements
| Colony | Concentration [ng/µl] |
|---|---|
| ccdB1 | 863.5 |
| ccdB2 | 436.9 |
| ccdB3 | 1258.5 |
| ccdB4 | 260.5 |
| ccdB5 | 106.6 |
| ccdB6 | 1064.4 |
| ccdB7 | 1213.0 |
| ccdB8 | 1301.4 |
| 3B | 982.3 |
| 3*B | 982.4 |
Sequencing results of ccdB3 and ccdB7 (just partwise sequencing) were positive. Biobrick can be submitted.
Tyrocidine-Indigoidine-fusion - standardization
Reassembly
As CPEC-approaches did not work out so far, a reassembly of the fusion constructs was run in parallel. Herefore, a standardized indC-module, that was prepared by the Indigoidine group via CPEC, was used.
The following formulas for gibson assembly were calculated:
pPW03 (Phe-Ind)
| Fragment | Concentration [ng/µl] | Volume for gibson assembly [µL] |
|---|---|---|
| A | 12 | 3.29 |
| B | 8 | 3.95 |
| C | 6 | 2.63 |
| D* | 120 | 0.13 |
pPW04 (Asn-Ind)
| Fragment | Concentration [ng/µl] | Volume for gibson assembly [µL] |
|---|---|---|
| D* | 120 | 0.25 |
| E | 20 | 3.75 |
| F | 20 | 6.00 |
pPW05 (Val-Ind)
| fragment | Concentration [ng/µl] | Volume for gibson assembly [µL] |
|---|---|---|
| D* | 120 | 0.26 |
| G | 15 | 4.21 |
| H | 16 | 3.95 |
| I | 20 | 1.58 |
Results
As shown in the images above, this approach did not lead to the desired result, as mostly colonies that were negative in the colony PCR were growing on the plate. Therefore, we decided to change the Gibson-protocol once more, using less backbone and more indC. For this optimization, we focussed on the Val-Ind-NRPS encoded by pPW05. However, the only positive colony (pPW05* B) was kept for further analysis.
Optimization
With the following optimization:
| Fragment | Concentration [ng/µl] | Volume for gibson assembly [µL] |
|---|---|---|
| D* | 120 | 1.67 |
| G | 15 | 1.33 |
| H | 16 | 5.00 |
| I | 20 | 2.00 |
Results: Only few colonies were growing after electroporation.
Validation
Procedure
Restriction digests were performed with the so far promising samples. The gels after digest (which were run at 135V) all had strange running patterns, as it seemed as if all of the samples ran too high.
Even though the sequencing was positive for all of those samples, we were concerned because of the unexpected restriction patterns. Therefore, we picked 12 colonies from remaining plates, let them grew overnight, took 2ml for miniprep and induced the remaining 1ml. In addition, we transformed the promising samples, that were already positive in sequencing, into BAP-I. Transformation was also performed for TOP10 and NEB-Turbo cells, which were also co-transformed with a plasmid carrying a PPTase and kanamycin resistance. Instead of plating them and picking colonies, we decided to grow the transformants directly in LB+Cm-selection medium. The next morning, we induced them as well.
Results
There were 7 out of the 12 colonies that turned blue after induction with 1mM IPTG, hence they were miniprepped and digested with EcoRI and PstI. Only half of the volume was loaded on a gel, the other half was purified with isopropanol.
Again, the pattern of bands was uncommon and unexpected, hence we purified the mixture to remove residual enzyme and cut DNA with isopropanol. Analysing this on a gel that was run at 100V yielded a better result. The obtained bands met our expectations. For validation, a TLC was run with the samples, which again showed the slower migration of Val-Ind. Finally, we could submit our samples to the registry, as sequencing was positive for all linkers.
To design the Linker Variation Constructs, we amplified the DNA fragments LV1a, LV1b, LV2b, LV3a, LV5b and LV6 by PCR with the following protocol. (Primer are listed on our primer-page)
| What | µl |
|---|---|
| primer_fw (see link above) | 2 |
| primer_rv (see link above) | 2 |
| Brevibacillus parabrevis | 1 |
| Phusion Flash 2x Master Mix | 10 |
| ddH20 | 5 |
- PCR-Program LV1a, LV1b, LV2b, LV5b amplification
| Cycles | Temperature [°C] | Time [min:s] |
|---|---|---|
| 1 | 98 | 2:00 |
| 35 | 98 | 0:02 |
| 59,4 | 0:05 | |
| 72 | 0:28 | |
| 1 | 72 | 10:00 |
| 1 | 10 | inf |
- PCR-Program LV3a, LV6a amplification
| Cycles | Temperature [°C] | Time [min:s] |
|---|---|---|
| 1 | 98 | 2:00 |
| 35 | 98 | 0:02 |
| 59,4 | 0:05 | |
| 72 | 0:44 | |
| 1 | 72 | 10:00 |
| 1 | 10 | inf |
Results
We were able to amplify all of our constructs, each of them run on the expected size.
Gel extraction
The amplified constructs LV14,LV1b,LV2b,LV3a,LV5b,LV6a were sliced out of the gel and a gel extraction performed. Afterwards, the concentration was measured with a nanodrop.
Results
| Construct | Concentration in ng/µl | A280/A260 |
|---|---|---|
| LV1a | 41,6 | 1,89 |
| LV1b | 69,4 | 1,86 |
| LV2b | 74,4 | 1,97 |
| LV3a | 72,9 | 1,84 |
| LV5b | 56,7 | 1,94 |
| LV6a | 50,7 | 2,05 |
Amplification of Backbone and indC
As we want to usethe strategy we established to detect a successful transformation by the expression of indigoidine, we amplified not only the backbone, but also the indigoidine constructs. They were amplified with both, a gibson-overhang for the short-linker-constructs and the long-linker-constructs.
- PCR-Program backbone short- and long-linker amplification
| Cycles | Temperature [°C] | Time [min:s] |
|---|---|---|
| 1 | 98 | 0:05 |
| 35 | 98 | 0:02 |
| 66,2 | 0:05 | |
| 72 | 0:50 | |
| 1 | 72 | 10:00 |
| 1 | 10 | inf |
- PCR-Program indigoidine short- and long-linker amplification
| Cycles | Temperature [°C] | Time [min:s] |
|---|---|---|
| 1 | 98 | 0:05 |
| 35 | 98 | 0:02 |
| 56,1 | 0:05 | |
| 72 | 1:20 | |
| 1 | 72 | 10:00 |
| 1 | 10 | inf |
Results
As we were able to amplify all af the constructs, we quantified the gained concentrations for gibson assembly.
| Construct | Concentration ind ng/µl |
|---|---|
| BBs | 10 |
| BBl | 40 |
| Inds | 45 |
| Indl | 45 |
Tyrocidine-Indigoidine-fusion extended
As the parts submission had priority last week, we now continued to work on the further constructs for the Tyrocidine-Indigoidine fusion. There were samples for pPW06, pPW09, pPW10 and pPW11. Colonies in DH10β or TOP10 exist for constructs pPW06, pPW09, pPW10, pPW11 and pPW12. Colonies in BAP-I exist for constructs pPW06 and pPW09.
pPW06 (Orn-Val-Ind)
All sequencings for pPW06 were positive, however, the best result was obtained for "pPW06 newC". There already existed a plate of BAP-I cells that were transformed with pPW06 newC. Hence colonies were picked, grown in LB+Cm and induced at OD = ~0.5. After less than two hours, cultures turned blue. When the NRP (expected: Orn-Val-Leu) was purified the next morning, the color of the cultures had already become fainly blue-green. Hence the yield was not high enough to conduct a reliable TLC. Therefore, another liquid culture was inocculated with the same cells in order to obtain higher yield. Using this sample, the following TLC was run which shows the expected different running patterns between Indigoidine and our tagged Dipeptide consisting of Ornithine and Valine.
pPW09 (Pro-Leu-Ind)
Though restriction-digest and screening-PCRs were positive, there was one (always the same) mutation occuring in the primer area at the beginning of the construct. There was a guanine being deleted in all of the cases, which lead to a frameshift. As this occured for multiple clones, we believe that the fragments used in Gibson Assembly already carry the mutation and new fragments should be amplified.
pPW10 (Pro-Leu-Val-Ind)
The exact same thing as for pPW09 accounts for pPW10. Hence the procedure will be the same.
pPW11 (Phe-Orn-Leu-Ind)
There were several minipreps sequenced, however, none of them contained the Tyrocidine part of the construct, but only the C-domain and Indigoidine, hence further colonies were picked, screened with colony PCR, grown overnight, miniprepped and restriction digested with EcoRI.
pPW12 (Phe-Orn-Leu-Val-Ind)
As pPW12 was yet not screened or sequenced, colonies were picked and treated the same as the samples for pPW11.
Colony PCRs for pPW11 and pPW12
The left image shows a screening for the Tyc-part (VF2 and IK17), the right one the screening for the Ind-part (KH05 and VR). Samples that were kept for further analysis are: pPW11D and pPW11F (as they are positive for both modules) and pPW12A, pPW12E and pPW12G as the colonies were small and hence the negative result could be due to missing template. In restriction digest however, only pPW11D, pPW11F, pPW12A and pPW12E showed a band at the expected size. The samples were transformed into BAP-I, grown in liquid culture and induced.
Gibson assembly of constructs 1 and 7
As these two constructs were the most divergent ones (construct 1 with only short linkers and construct 7 with only very long linkers) we decided to focus on these gibson assembly first This could help to to narrow functional regions.
| LV | Backbone-concentration | Ind-concentration | C4-concentration | C2-concentration |
|---|---|---|---|---|
| 1 | 3,27 µl | 4,42 µl | 1,76 µl | 0,55 µl |
| 7 | 0,97 µl | 5,26 µl | 2,42 µl | 1,34 µl |
Afterwards,the constructs were transformed in DH10ß-cells and platet on LB-plates with chloramphenicol. The day after, the Plates containing LV1 and LV7 showed colonies. Therefore colony PCRs were performed.
Mastermixes for colony PCRs:
| What | µl |
|---|---|
| iTaq-Polymerase | 50 |
| H2O | 48 |
| Primer VF2 | 1 |
| Primer PW20 | 1 |
Mastermix for the indC Amplification:
| What | µl |
|---|---|
| iTaq-Polymerase | 50 |
| H2O | 48 |
| Primer VR | 1 |
| Primer KH5 | 1 |
PCR conditions:
| Biometra T100 | ||
| Cycles | temperature [°C] | Time [min:s] |
|---|---|---|
| 1 | 95 | 2:00 |
| 35 | 95 | 0:30 |
| 52 | 0:30 | |
| 72 | 2:30 | |
| 1 | 72 | 5:00 |
| 1 | 10 | inf |
Results
Only for construct LV1C a slight band for the Tyrocidine module was visble. To make sure, that there was no mistake in the colony PCR itself, we decided to transform every LV1 construct in BAP. Overnight cultures of them were minipreped with a QiaPrep-Kit.
Concentrations measured via NanoDrop:
| Construct | Concentration in ng/µl | A260/280 |
|---|---|---|
| LV1A | 10,6 | 0,211/0,1 |
| LV1B | 12,2 | 0,244/0,104 |
| LV1C | 11,3 | 0,226/0,113 |
| LV1D | 3,7 | 0,073/-0,017 |
Chemical Transformation of LV1 constructs in BAPI
Positive constructs were transformed in BAPI-cells and spread on plates. There were slight blue circles around the colonies of LV1B and LV1C. Colonies of all plates were picked. Without induction LV1B1, LV1B2, LV1B3, LV1C1, LV1C3 turned into a clear visible dark blue. 2ml of these culture were minipreped and treated by restriction digested with ecoR1.
| What | µl |
|---|---|
| CutSmart | 2 |
| EcoR1 | 1 |
| DNA | 3 |
| ddH2O | 14 |
Results
All LV1 constructs were negative. The Gibson Transformation has to be done again.
colony PCR of LV7
As the former colony-PCR was negative, again colonies of DH10ß were picked and a colony PCR redone.
Mastermix for TycC4dC-C(TycC2) amplification:
| What | µl |
|---|---|
| iTaq-Polymerase | 5 |
| H2O | 3 |
| Primer VF2 | 1 |
| Primer PW20 | 1 |
Mastermix for the Indigoidine Amplification
| What | µl |
|---|---|
| iTaq-Polymerase | 5 |
| H2O | 3 |
| Primer VR | 1 |
| Primer KH5 | 1 |
Conditions
| Biometra T100 | ||
| Cycles | Temperature [°C] | Time [min:s] |
|---|---|---|
| 1 | 95 | 2:00 |
| 35 | 95 | 0:30 |
| 52 | 0:30 | |
| 72 | 2:30 | |
| 1 | 72 | 5:00 |
| 1 | 10 | inf |
Gibson assembly of the other linker-variation constructs
As we had putative positive clones for LV1, we did a Gibson-assembly with the other constucts, too.
Mastermix for Gibson Assembly
10µl Gibson-mastermix + LV-Mix
| LV | BB | indC | TycC4dC | C(TycC2) |
|---|---|---|---|---|
| 2 | 0,75 (short) | 5,22 (medium) | 1,62 (short) | 2,41 (medium) |
| 3 | 1,59 (medium) | 3,23 (short) | 4,78 (medium) | 0,41 (short) |
| 5 | 1,54 (medium) | 3,12 (long) | 4,62 (medium) | 0,71 (long) |
| 6 | 0,81 (long) | 4,36 (medium) | 2,25 (long) | 2,58 (medium) |
| 8 | 3,09 (short) | 4,18 (long) | 1,67 (short) | 1,08 (long) |
| 9 | 1,01 (long) | 5,48 (short) | 2,82 (short) | 0,68 (short) |
These mixes were incubated at 50°C for 1h. Afterwards they were transformed by electroporation and plated out. Colonies were picked and a colony PCR was executed.
Mastermix for TycC4dC-C(TycC2) amplification
| What | µl |
|---|---|
| iTaq-Polymerase | 5 |
| H2O | 3 |
| Primer VF2 | 1 |
| Primer PW20 | 1 |
Mastermix for the Indigoidine amplification
| What | µl |
|---|---|
| iTaq-Polymerase | 5 |
| H2O | 3 |
| Primer VR | 1 |
| Primer KH5 | 1 |
Conditions
| Biometra T100 | ||
| Cycles | temperature [°C] | Time [min:s] |
|---|---|---|
| 1 | 95 | 2:00 |
| 35 | 95 | 0:30 |
| 52 | 0:30 | |
| 72 | 2:30 | |
| 1 | 72 | 5:00 |
| 1 | 10 | inf |
The constructs of LV3b,c,d were positive, so the liquid cultures were prepared.
colony PCR of LV 2,5,6,7,8,9
| What | µl |
|---|---|
| oneTaq-Polymerase | 5 |
| H2O | 3 |
| Primer VF2 | 1 |
| Primer PW20 | 1 |
Mastermix for the Indigoidine Amplification
| What | µl |
|---|---|
| oneTaq-Polymerase | 5 |
| H2O | 3 |
| Primer VR | 1 |
| Primer KH5 | 1 |
Conditions
| Biometra T100 | ||
| Cycles | temperature [°C] | Time [min:s] |
|---|---|---|
| 1 | 95 | 2:00 |
| 35 | 95 | 0:30 |
| 52 | 0:30 | |
| 72 | 2:30 | |
| 1 | 72 | 5:00 |
| 1 | 10 | inf |
Tyrocidine-Indigoidine-Fusion - extended
For the additional Tyrocidine-Indigoidine-fusion constructs, we performed restriction digest after miniprep for validation of the constructs. This restriction digest was performed with PstI, hence a single band is expected at the size of the respective plasmids.
In the gel picture however, a second band was visible for all fragments, which suggests presence of contamination. But as this second band occured in all lanes, we believe that the source of the contamination lies in the restriction digest and not in the mini-preps.
Conclusively, we selected the positive constructs for transformation.
After cotransformation with the PPTase-construct pRB15 in NEB-turbo-cells, they were grown at 37°C and picked the next day. The liquid culture was induced as soon as OD = ~0.5 with 1mM IPTG.
Restriction digest of LV3B,3C,3D,5A,5B and LV8A
A miniprep of these constructs was done by the use of the QuiaPrep Kit. Measurements via nanodrop displayed the following concentrations:
| Construct | Concentration [ng/µl] | A260/280 |
|---|---|---|
| LV3B | 240,5 | 4,809/2,51 |
| LV3C | 170,3 | 3,41/1,81 |
| LV3D | 197,8 | 3,96/2,07 |
| LV5A | 212,6 | 4,25/1,256 |
| LV5B | 202,7 | 4,05/2,13 |
| LV8A | 40,1 | 0,802/0,44 |
These DNA fragments were digested with PstI. The Constructs 3B,3D 5B and 8A showed the desired bands. Hence, we transformed them in NEB-Turbo cells, by co-transformation with a PPTase. Some of the colonies (especially the colonies of LV8A) turned blue on the plates. Liquid cultures were prepared from all colonies we picked and induced with IPTG.
 "
"


