Team:NTU-Taida/Modeling/2D Diffusion
From 2013.igem.org
Revision as of 21:05, 27 September 2013 by Shinsekaiyori (Talk | contribs)
2D Diffusion with Cell Division
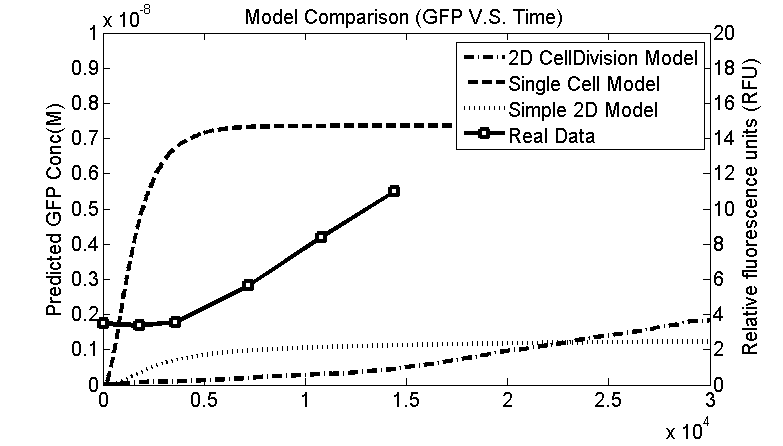
We have extended simple cell model into 2D diffusion model as mentioned before, however both systems reach saturated concentration quickly, and it is far from reality (figure 1.)
If cell division occurred, more cells can receive the AHL and trigger the reaction, yields more GFP. The time reach GFP saturation will be much more later than the time which original static model did.
We build the 2D cell division model following these assumptions and constraints:
- Collision between cells never occurred. Each cell will detect the neighbor cell and go away from the neighborhood. We can define the moving speed of each cell, the default speed is 1grid/15sec.
- The cell grow horizontally, the cell division will occur after the cell reach two times of initial length. In fact we use 30 state (not including initial state) to describe the behavior of cell growing and division. [[File:]] States of growing cell. Red represents intracellular region, green represents cell membrane region and blue represents extracellular region We can define the duration of each states of each cell. We set 60sec / states so that the cell will finish the division in 1800sec (30min) if no neighbor or obstacle exists.
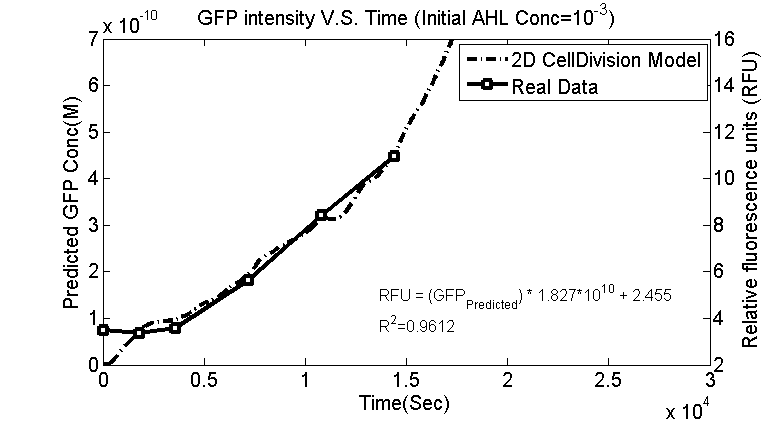
- Protein cannot diffuse to extra-cellular region during cell growing, moving and division. Here is the simulation result ([AHL_Initial] = 10^-5 M)
 "
"


